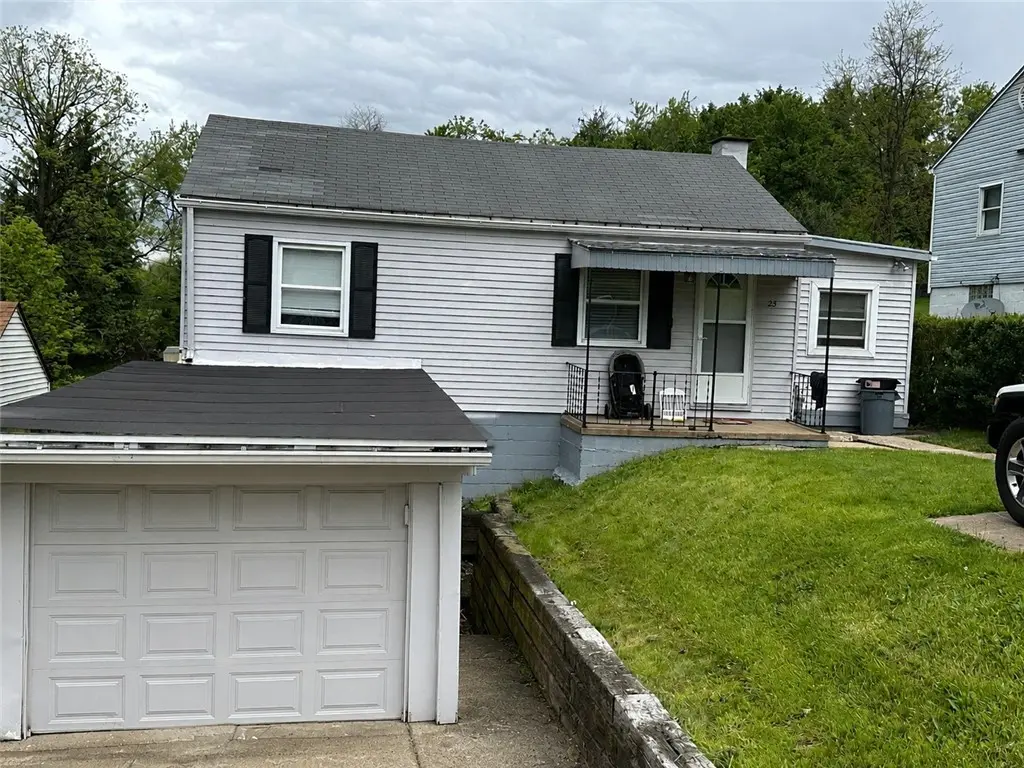
23 Virginia Dr · Lincoln, PA
Flood risk 1/10 · Minimal
- FEMA flood zone
- X (unshaded)
- Chance of flooding over 30 yrs
- 0.0%
- Est. flood insurance / yr
- $473 – $860
Fire risk 1/10 · Minimal
- Est. fire insurance / yr
- $511 – $949
Heat risk 3/10 · Minor
- Hot days now (above 96°F)
- 7 days/yr
- Hot days in 30 yrs
- 17 days/yr
Wind risk 2/10 · Minimal
- Chance of severe wind over 30 yrs
- —
Air-quality risk 5/10 · Moderate
- Unhealthy air days now
- 8 days/yr
- Unhealthy air days in 30 yrs
- 8 days/yr
Risk factors via First Street. Map © Google.
Why this score? — see what drove the C grade
The composite is a weighted blend of 9 inputs, each scored 0–100. Each bar is that input's sub-score; the figure is the points it added to the 100-point composite (weight × sub-score).
- Cash flow +18.3/30.0
- ARV discount +7.5/15.0
- Appreciation +7.3/10.0
- DSCR +5.7/10.0
- 1% rule +5.3/10.0
- Livability +3.4/5.0
- Schools +2.8/10.0
- Rent growth +2.5/5.0
- Condition / age +2.5/5.0
$90,000
🖨 Deal sheet 📄 Offer letter ✓ Due diligence
Listing remarks MLS
Great Starter home or downsizing. .. .newer roof , furnace and central air,
Key facts
- Extra lot
- Newer central heat
- Finished basement
Tags
Property features AI
Exterior
- Parking: Attached garage
- Utilities: Public water; Public sewer
- Home design: Single-story; Frame construction; Asphalt roof
- Construction: Frame construction; Asphalt roof
- Exterior features: Public water; Public sewer; Resale condition
Interior
- Kitchen: Refrigerator; Stove
- Flooring: Vinyl
- Bathrooms: 1 full bathroom
- Heating & cooling: Gas heating; Central air conditioning
- Interior features: Vinyl flooring; Full basement
Neighborhood map
What this means for you Summary
Snapshot
- This is a 2-bed/1.0-bath single-family listed at $90k.
Deal economics
- At list price, monthly cash flow is $82 ($983/yr) — positive.
- The deal already cash-flows at list — no discount required.
- Meets the 1% rule at list price ($931 rent vs $90k).
- Recommended offer: $89k (1.5% below list) — sets the bar for market timing.
Location & tenants
- Location reads 67/100 on livability (#984 in PA) — a middle-class / working-renter tenant base. Strengths: crime A+, cost of living A+, housing A+; Watch: schools F, amenities F, commute F.
- South Allegheny SD (suburban): math 23% / reading 44% proficiency, ranked #430 of 539 in PA (top 80%) — families likely to look elsewhere, expect single-tenant / working-renter base with shorter leases.
- Market conditions: 39 active listings in the ZIP; 2 comparable units currently listed for rent nearby; 2,996 units permitted in Allegheny County in 2024 (1,588 in 5+ unit buildings).
- This rent is only 17% of the median local income ($66k/yr) — well below the 30% rent-burden line; pricing power to push rent on renewal without tenant pushback.
Forward outlook
- In year one you build about $5k of equity ($622 loan paydown + $4k appreciation (4.5% local appreciation)).
- At projected returns (4.5% appreciation + 3.0% rent growth), your $25k cash investment doubles in ~4 years — after that, you're playing with house money.
- By year 7, paydown + projected appreciation supports a ~$30k cash-out refi (75% LTV) — recoverable capital for the next deal without selling this one.
Negotiation context
- It's been on market 27 days — a 2% lower offer ($89k) is reasonable based on typical stale-listing flexibility.
- 3 sale attempts since 25y ago with the ask held roughly flat each time — persistent listings suggest the price (not the market) is what's stuck; bring a comps-based counter.
- Current owner paid $27k; list at $90k implies a 235% gain — meaningful room to come down on a strong offer.
Risks & watch-outs
- Watch-outs: built in 1925 — expect roof / HVAC / electrical / plumbing capex.
Questions for the listing agent
- Built in 1925 — when were the roof, HVAC, electrical panel, plumbing, and water heater last replaced?
- Is there a deadline driving the sale (1031 exchange, divorce, estate, relocation)? That informs how much negotiation room exists.
- Schools are F-rated, which usually means shorter tenancies and higher turnover. Who's the typical renter profile here, and what's been the actual vacancy rate?
- What's the average days-on-market for RENTAL listings here right now (not sales)? A rising rental-DOM trend means longer vacancies and softer asking-rent achievability than the comps imply.
- What's the recent tenant-quality profile in this submarket — average credit score on applications, eviction rate, late-payment / NSF rate, and stable-employment percentage? A property-management company in the area should have these aggregated.
- How much new for-sale + rental construction is in the pipeline within 1–3 miles? Heavy new supply typically softens prices + rents 12–24 months out; constrained supply supports both.
Investment metrics
- 1% rule
- 1.03% ✓
- Cap rate
- 7.39%
- Cash-on-cash
- 3.90%
- DSCR
- 1.17
- GRM
- 8.1
CMA / ARV
No comps found within radius.
Projected returns pro-forma
4.52% appreciation · 3.0% rent growth · sell at horizon
- IRR
- 15.1%
- Equity multiple
- 1.93×
- Total profit
- $23,560
- Equity at exit
- $48,413
- IRR
- 15.9%
- Equity multiple
- 3.70×
- Total profit
- $68,010
- Equity at exit
- $81,489
Cash invested: $25,200 (down + closing). Projections, not guarantees.
Landlord ↔ Tenant lean methodology
- Overall (STATE)
- 62 Landlord-Friendly
- State Pennsylvania
- 62 Landlord-Friendly · EVEN
- County
- — inherits STATE
- City
- — inherits STATE
ZIP-level market 15133
- Home prices YoY
- 2.1%
- Active inventory
- 39
- Price-to-rent
- 8.1×
Monthly cashflow live
- Estimated rent
- $931 medium interval (Pro) →
- Mortgage (P&I)
- −$472
- Tax from tax record
- −$144 /mo · $1,727/yr
- Insurance
- −$38
- HOA
- −$0
- Vacancy / Maint / Mgmt
- −$195
- Net cashflow
- $82
Break-even live
UW: 25.0% down · 7.5% · 30yr · 1.5% tax · 5.0% vac · 8.0% maint · 8.0% mgmt
Financing live
Cash to close
- Down payment
- $22,500
- Closing costs
- $2,700
- Reserves months
- —
- Total cash needed
- —
Loan-product check · same deal, 3 products live
Conventional
25% down · 7.5% · 30yr
- Down + closing
- —
- Monthly P&I
- —
- Monthly cashflow
- —
- DSCR
- —
- Eligible?
- —
Personal DTI + credit; lowest rate.
DSCR
20% down · 8.5% · 30yr
- Down + closing
- —
- Monthly P&I
- —
- Monthly cashflow
- —
- DSCR
- —
- Eligible?
- —
No personal income docs; deal must DSCR.
Hard money
10% down · 12.0% · 12mo
- Down + closing
- —
- Monthly P&I
- —
- Monthly cashflow
- —
- DSCR
- —
- Eligible?
- —
Short-term bridge; refi at stabilization.
Rent comps 2 comps
| Address | Beds | Baths | Sqft | Rent | $/sqft | DOM | Units | Dist |
|---|---|---|---|---|---|---|---|---|
| 2860 Washington Blvd Unit 3 McKeesport, PA | 1.0 | 1.0 | 600 | $799 | $1.33 | 44d | 1 | 0.41mi |
| 2860 Washington Blvd Unit 5 McKeesport, PA | 1.0 | 1.0 | 600 | $799 | $1.33 | 24d | 1 | 0.41mi |
Listing history 21 events
-
2026-06-18days on market $90,000 Active 27 DOM
-
2026-06-17days on market $90,000 Active 26 DOM
-
2026-06-16days on market $90,000 Active 25 DOM
-
2026-06-15days on market $90,000 Active 24 DOM
-
2026-06-13days on market $90,000 Active 22 DOM
-
2026-06-13days on market $90,000 Active 21 DOM
-
2026-06-09days on market $90,000 Active 18 DOM
-
2026-06-08days on market $90,000 Active 17 DOM
-
2026-06-07days on market $90,000 Active 16 DOM
-
2026-06-05days on market $90,000 Active 13 DOM
-
2026-06-03days on market $90,000 Active 12 DOM
-
2026-06-02days on market $90,000 Active 11 DOM
-
2026-06-01days on market $90,000 Active 10 DOM
-
2026-05-31days on market $90,000 Active 9 DOM
-
2026-05-19$90,000 Active
-
2017-11-22soldstatus $26,900
-
2012-02-21$35,900 75-char remark
Show marketing remark (75 chars)
Great Starter home or downsizing. .. .newer roof , furnace and central air,
-
2001-11-13soldstatus $38,000
-
2001-11-08soldstatus $38,000 79-char remark
Show marketing remark (79 chars)
DOLL HOUSE, NICE YD STORAGE SHED, ABOVE GROUND POOL, SHOWS WELL UPDATED KITCHEN
-
2001-08-01$42,900 79-char remark
Show marketing remark (79 chars)
DOLL HOUSE, NICE YD STORAGE SHED, ABOVE GROUND POOL, SHOWS WELL UPDATED KITCHEN
-
1988-04-20soldstatus $12,000
ⓘ Source: listings_history table (triggers on properties + properties_extension) + one-shot
backfill from property_details.listing_events for pre-trigger history.
Tax reassessment forecast PA · Partial reset (capped growth)
- Current annual tax
- $1,727 · $144/mo
- Projected year-2 tax
- $1,727 · $144/mo
- Expected delta
- $0/yr ($0/mo · 0.0%)
ⓘ Screening estimate from a state-policy table — verify with the county assessor before closing.
Climate risk First Street
- Flood 1/10 Low FEMA zone X (unshaded) · 0% chance over 30 yrs
- Wildfire 1/10 Low
- Heat 3/10 Moderate 7 d/yr ≥96°F today · 17 d/yr by 30 yrs out
- Wind 2/10 Low
- Air quality 5/10 Major 8 unhealthy d/yr today · 8 by 30 yrs out
Nearby sold comps map
Loading sold comps map…
Walkable amenities ~0.75 mi
Loading nearby amenities…
Taxation est. · year 1
- Rental income
- $11,169
- − Mortgage interest
- −$5,041
- − Property taxes
- −$1,727
- − Insurance
- −$450
- − Repairs & maintenance
- −$894
- − Management
- −$894
- − Depreciation
- −$2,618
- Taxable loss
- −$455
- Est. tax savings @ 24.0%
- +$109
- After-tax cash flow
- $1,092/yr
For passive investors: Depreciation is non-cash, so a rental often shows a tax loss while cash-flowing — sheltering income. Rental losses are passive: they offset passive income freely, and up to $25,000/yr can offset ordinary (W-2) income if you actively participate and your MAGI is under $100k (phasing out to $0 by $150k); unused losses carry forward. On sale, claimed depreciation is recaptured at up to 25%, and gains may owe capital-gains tax (a 1031 exchange can defer both). Figures are a year-1 estimate at your 24.0% rate — not tax advice; consult a CPA.
Schools (NCES district)
- District
- South Allegheny SD
- NCES district ID
- 4221910
- Math proficiency
- 23% ▼ -10.00%
- Reading proficiency
- 44% ▼ -13.00%
- Median HH income
- $40,891
- Composite
- 28.15/100
- National rank
- #6815
- State rank
- #430 of 539 in PA
Livability — Lincoln
- Score
- 67/100
- State rank
- #984
- US rank
- #10802
Category grades
Schools grade is shown separately in the Schools card above.
Census & demographics
- Census place
- Lincoln, PA
- County
- Allegheny County · 1,022,028 people
- Metro
- Pittsburgh, PA
- Population (ZIP)
- 6,112
- Household income
- $65,938
- Rent vs Own
- Severe rent burden
- 94.0
Population outlook (Allegheny County) Hauer SSP2
- Today (2025)
- 1,250,282 people
- By 2030
- 1,256,482 · +0.5%
- By 2040
- 1,256,318 · +0.5%
- By 2050
- 1,244,169 · -0.5%
- By 2075
- 1,197,693 · -4.2%
- By 2100
- 1,093,187 · -12.6%
Race, ethnicity, and origin ACS 2023
- Neighborhood character
- Predominantly White (84%)
- Race & ethnicity
- White 84% Two or more races 7% Black 4% Hispanic / Latino 3%
- Common ancestry
- Romanian 10% Slovene 2% Italian 2%
- Foreign-born
- 0%
- Languages at home
- 99% English-only · Other Indo-European 1%
Political lean MEDSL · Allegheny
- 2024 margin
- Strong D (+20.3) · D 59.7% · R 39.4%
- 2008→2024 swing
- +4.8pp toward D · 2008: 15.5pp · 2024: 20.3pp
- All cycles
- 2024: D+20.3 2020: D+20.4 2016: D+16.4 2012: D+14.4 2008: D+15.5
Not yet ingested
- Civics
- —
Market trends
- HPI YoY
- ▲ 4.52%
- Current HPI
- 214.5922
- Rent YoY
- —
- Metro
- Pittsburgh, PA
- State GDP YoY
- ▲ 1.68%
- F500 in state
- 34
Industry mix (Fortune 500 HQ in PA)
| Industry | F500 HQs | Revenue |
|---|---|---|
| Healthcare | 2 | $309B |
|
||
| Insurance | 2 | $27B |
|
||
| Telecommunications / Media | 1 | $124B |
|
||
| Industrial Distribution | 1 | $22B |
|
||
| Financial Services | 1 | $20B |
|
||
| Chemicals / Materials | 1 | $18B |
|
||
Price history
+650.0% since first listed7 events — show timeline
- 2026-05-19 Listed $90,000 West Penn MLS
- 2017-11-22 Sold (Public Records) $26,900 Public Records
- 2012-02-21 Listed $35,900 West Penn MLS
- 2001-11-13 Sold (Public Records) $38,000 Public Records
- 2001-11-08 Sold (MLS) $38,000 West Penn MLS
- 2001-08-01 Listed $42,900 West Penn MLS
- 1988-04-20 Sold (Public Records) $12,000 Public Records
Property tax history
+4.4%/yrLatest (2026): $1,727 · +5.8% YoY. Source: county tax records.
Cash-flow waterfall
monthlySold comps — $/sqft
last 12 mo · ≤1 miLoading sold comps…