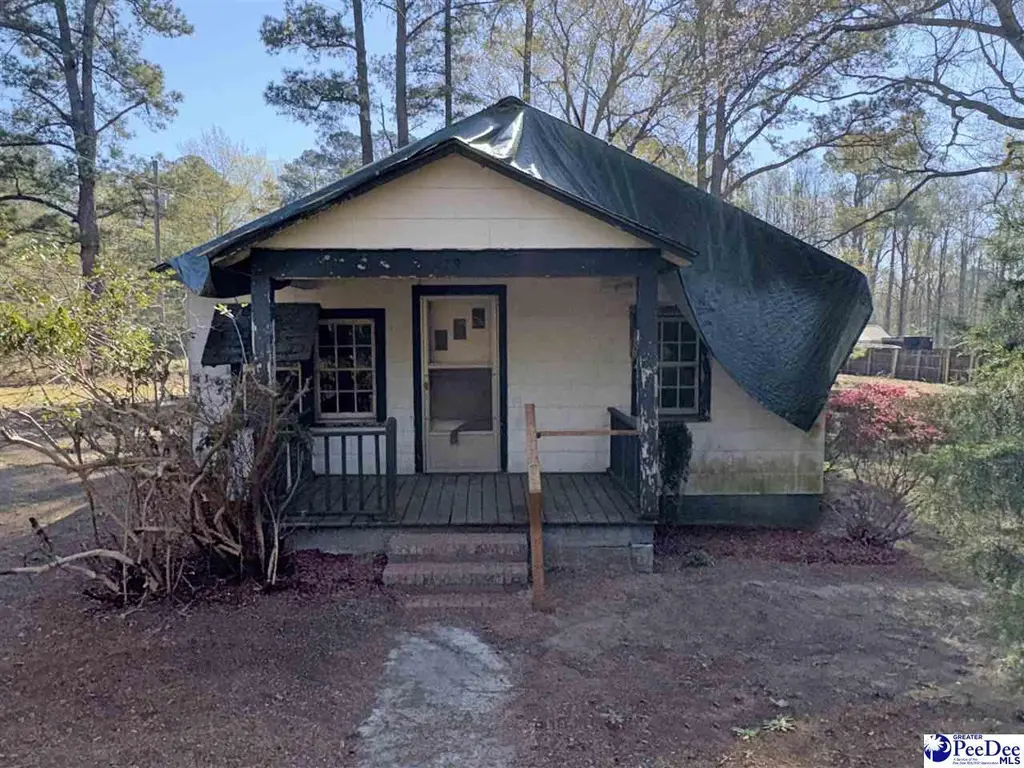
619 CC Chapman Rd · Cash, SC
Flood risk 1/10 · Minimal
- FEMA flood zone
- X (unshaded)
- Chance of flooding over 30 yrs
- 0.0%
- Est. flood insurance / yr
- $507 – $1,088
Fire risk 6/10 · Moderate
- Est. fire insurance / yr
- $783 – $1,453
Heat risk 7/10 · Major
- Hot days now (above 107°F)
- 7 days/yr
- Hot days in 30 yrs
- 16 days/yr
Wind risk 6/10 · Moderate
- Chance of severe wind over 30 yrs
- 66.0%
Air-quality risk 2/10 · Minimal
- Unhealthy air days now
- 1 days/yr
- Unhealthy air days in 30 yrs
- 1 days/yr
Risk factors via First Street. Map © Google.
Why this score? — see what drove the B- grade
The composite is a weighted blend of 9 inputs, each scored 0–100. Each bar is that input's sub-score; the figure is the points it added to the 100-point composite (weight × sub-score).
- Cash flow +30.0/30.0
- 1% rule +10.0/10.0
- DSCR +10.0/10.0
- ARV discount +7.5/15.0
- Rent growth +2.5/5.0
- Schools +2.5/10.0
- Livability +2.5/5.0
- Condition / age +2.5/5.0
- Appreciation +0.0/10.0
$25,000
🖨 Deal sheet 📄 Offer letter ✓ Due diligence
Listing remarks
Single family home located on 2.4 acres just outside of Cheraw. A covered front porch greets you when walking up to the home. Open concept with the living room flowing nicely to the kitchen. There are 2 good sized bedrooms and 1 full bath in the home. A 3rd bedroom could easily be added by closing in the den area. The back porch overlooks a private wooded area. This is a Fannie Mae Homepath Property.
Key facts
- Covered front porch
- Open concept
- Private wooded area
Tags
Property features AI
Exterior
- Utilities: Public sewer
- Home design: Residential single-family home
- Construction: Wood siding; Shingle roof; Crawl space foundation; Built area above grade: 988
- Exterior features: Front porch; Shingle roof; Wood siding construction; Approximately 3 acres
Interior
- Flooring: Carpet; Wood; Hardwood
- Bathrooms: 1 full bathroom
- Heating & cooling: Central heating; Exhaust fan; Central air conditioning; Ceiling fans
- Interior features: Carpet, wood, and hardwood flooring; Fireplace (1); Crawl space basement
Neighborhood map
What this means for you Summary
Snapshot
- This is a 2-bed/1.0-bath other listed at $25k.
Deal economics
- At list price, monthly cash flow is $635 ($8k/yr) — positive.
- The deal already cash-flows at list — no discount required.
- Meets the 1% rule at list price ($998 rent vs $25k).
Location & tenants
- Location reads: area grade B — affects rentability + tenant quality, not the cash-flow math above.
- Chesterfield 01 (rural): math 25% / reading 36% proficiency, ranked #55 of 80 in SC (top 69%) — families likely to look elsewhere, expect single-tenant / working-renter base with shorter leases; 63% free/reduced lunch — lower-income household profile, screen leases tightly.
- Zoned schools: Cheraw Primary (468 students, 100% FRL); Long Middle (math 12% / reading 25%, grade F, #186 of 229 statewide, top 82%, 416 students, 100% FRL); Cheraw High (math 42% / reading 67%, grade C-, #130 of 196 statewide, top 69%, 654 students, 100% FRL) — zoned schools average 100% FRL vs 63% district-wide (37 pts higher); higher-poverty schools than district average — tighter screening recommended.
- Market conditions: 84 active listings in the ZIP; 145 units permitted in Chesterfield County in 2024 (10 in 5+ unit buildings).
Forward outlook
- Local home prices are declining (-3.0%/yr); year-one equity from $173 of loan paydown is wiped out by about $750 of value loss. Plan a longer hold.
- Chesterfield County population projected at -17% by 2050 — secular population decline; favor cash flow + early exit over multi-decade hold.
- At projected returns (-3.0% appreciation + 3.0% rent growth), your $7k cash investment doubles in ~1 year — after that, you're playing with house money.
Negotiation context
- Only 4 days on market — expect competitive offers; lowballing is unlikely to land.
Risks & watch-outs
- Watch-outs: built in 1942 — expect roof / HVAC / electrical / plumbing capex.
- Climate carrying-cost: major wind risk, 66% chance of damaging wind over 30y; major wildfire risk; extreme-heat days projected 7→16/yr by 2055 (HVAC capex compounding) — expect insurance premiums to compound above CPI over the hold.
Questions for the listing agent
- Built in 1942 — when were the roof, HVAC, electrical panel, plumbing, and water heater last replaced?
- Is there a deadline driving the sale (1031 exchange, divorce, estate, relocation)? That informs how much negotiation room exists.
- What's the average days-on-market for RENTAL listings here right now (not sales)? A rising rental-DOM trend means longer vacancies and softer asking-rent achievability than the comps imply.
- What's the recent tenant-quality profile in this submarket — average credit score on applications, eviction rate, late-payment / NSF rate, and stable-employment percentage? A property-management company in the area should have these aggregated.
- How much new for-sale + rental construction is in the pipeline within 1–3 miles? Heavy new supply typically softens prices + rents 12–24 months out; constrained supply supports both.
Investment metrics
- 1% rule
- 3.99% ✓
- Cap rate
- 36.79%
- Cash-on-cash
- 108.92%
- DSCR
- 5.85
- GRM
- 2.1
CMA / ARV
No comps found within radius.
Projected returns pro-forma
-3.0% appreciation · 3.0% rent growth · sell at horizon
- IRR
- —
- Equity multiple
- 6.20×
- Total profit
- $36,419
- Equity at exit
- $3,728
- IRR
- —
- Equity multiple
- 12.98×
- Total profit
- $83,832
- Equity at exit
- $2,162
Cash invested: $7,000 (down + closing). Projections, not guarantees.
Landlord ↔ Tenant lean methodology
- Overall (STATE)
- 90 Strongly Landlord-Friendly
- State South Carolina
- 90 Strongly Landlord-Friendly · R+6
- County
- — inherits STATE
- City
- — inherits STATE
ZIP-level market 29520
- Home prices YoY
- -17.3%
- Active inventory
- 84
- Price-to-rent
- 2.1×
Monthly cashflow live
- Estimated rent
- $998 medium interval (Pro) →
- Mortgage (P&I)
- −$131
- Tax from tax record
- −$12 /mo · $140/yr
- Insurance
- −$10
- HOA
- −$0
- Vacancy / Maint / Mgmt
- −$210
- Net cashflow
- $635
Break-even live
UW: 25.0% down · 7.5% · 30yr · 1.5% tax · 5.0% vac · 8.0% maint · 8.0% mgmt
Financing live
Cash to close
- Down payment
- $6,250
- Closing costs
- $750
- Reserves months
- —
- Total cash needed
- —
Loan-product check · same deal, 3 products live
Conventional
25% down · 7.5% · 30yr
- Down + closing
- —
- Monthly P&I
- —
- Monthly cashflow
- —
- DSCR
- —
- Eligible?
- —
Personal DTI + credit; lowest rate.
DSCR
20% down · 8.5% · 30yr
- Down + closing
- —
- Monthly P&I
- —
- Monthly cashflow
- —
- DSCR
- —
- Eligible?
- —
No personal income docs; deal must DSCR.
Hard money
10% down · 12.0% · 12mo
- Down + closing
- —
- Monthly P&I
- —
- Monthly cashflow
- —
- DSCR
- —
- Eligible?
- —
Short-term bridge; refi at stabilization.
Listing history 2 events
-
2026-05-22$25,000 Active
-
2007-09-10soldstatus $42,000
ⓘ Source: listings_history table (triggers on properties + properties_extension) + one-shot
backfill from property_details.listing_events for pre-trigger history.
Tax reassessment forecast SC · Resets to sale price
- Current annual tax
- $140 · $12/mo
- Projected year-2 tax
- $142 · $12/mo
- Expected delta
- +$2/yr ($0/mo · 1.8%)
ⓘ Screening estimate from a state-policy table — verify with the county assessor before closing.
Climate risk First Street
- Flood 1/10 Low FEMA zone X (unshaded) · 0% chance over 30 yrs
- Wildfire 6/10 Major
- Heat 7/10 Severe 7 d/yr ≥107°F today · 16 d/yr by 30 yrs out
- Wind 6/10 Major 66% chance of damaging wind over 30 yrs
- Air quality 2/10 Low 1 unhealthy d/yr today · 1 by 30 yrs out
Nearby sold comps map
Loading sold comps map…
Walkable amenities ~0.75 mi
Loading nearby amenities…
Taxation est. · year 1
- Rental income
- $11,978
- − Mortgage interest
- −$1,400
- − Property taxes
- −$140
- − Insurance
- −$125
- − Repairs & maintenance
- −$958
- − Management
- −$958
- − Depreciation
- −$727
- Taxable income
- $7,669
- Est. tax owed @ 24.0%
- −$1,841
- After-tax cash flow
- $5,784/yr
For passive investors: Depreciation is non-cash, so a rental often shows a tax loss while cash-flowing — sheltering income. Rental losses are passive: they offset passive income freely, and up to $25,000/yr can offset ordinary (W-2) income if you actively participate and your MAGI is under $100k (phasing out to $0 by $150k); unused losses carry forward. On sale, claimed depreciation is recaptured at up to 25%, and gains may owe capital-gains tax (a 1031 exchange can defer both). Figures are a year-1 estimate at your 24.0% rate — not tax advice; consult a CPA.
Schools (NCES district)
- District
- Chesterfield 01
- NCES district ID
- 4501560
- Math proficiency
- 25% ▼ -11.00%
- Reading proficiency
- 36% ▬ 0.00%
- Median HH income
- $33,946
- Composite
- 25.04/100
- National rank
- #7547
- State rank
- #55 of 80 in SC
Livability — Cash
No livability data for this city. (Only ~50 U.S. cities are tracked.)
Census & demographics
- Population (ZIP)
- 12,860
Population outlook (Chesterfield County) Hauer SSP2
- Today (2025)
- 44,632 people
- By 2030
- 43,331 · -2.9%
- By 2040
- 40,218 · -9.9%
- By 2050
- 36,847 · -17.4%
- By 2075
- 29,636 · -33.6%
- By 2100
- 23,536 · -47.3%
Race, ethnicity, and origin ACS 2023
- Neighborhood character
- Diverse neighborhood (Simpson 0.59)
- Race & ethnicity
- White 47% Black 43% Two or more races 6% Hispanic / Latino 4%
- Common ancestry
- Slovak 1% Lithuanian 1% Serbian 1%
- Foreign-born
- 3% · Canada, Guatemala
- Languages at home
- 94% English-only · Spanish 3% German/W. Germanic 1%
Political lean MEDSL · Chesterfield
- 2024 margin
- Strong R (+28.1) · D 35.5% · R 63.5% · Other 1.0%
- 2008→2024 swing
- -25.1pp toward R · 2008: -3.0pp · 2024: -28.1pp
- All cycles
- 2024: R+28.1 2020: R+20.5 2016: R+14.3 2012: R+3.3 2008: R+3.0
Not yet ingested
- Civics
- —
Market trends
- HPI YoY
- ▼ -43.46%
- Current HPI
- 207.8249
- Rent YoY
- —
- Metro
- —
- State GDP YoY
- ▲ 4.51%
- F500 in state
- 2
Industry mix (Fortune 500 HQ in SC)
| Industry | F500 HQs | Revenue |
|---|---|---|
| Packaging | 1 | $7B |
|
||
Price history
-40.5% since first listed2 events — show timeline
- 2026-05-22 Listed $25,000 RAGPD
- 2007-09-10 Sold (Public Records) $42,000 Public Records
Property tax history
-3.7%/yrLatest (2024): $140 · +4.3% YoY. Source: county tax records.
Cash-flow waterfall
monthlySold comps — $/sqft
last 12 mo · ≤1 miLoading sold comps…