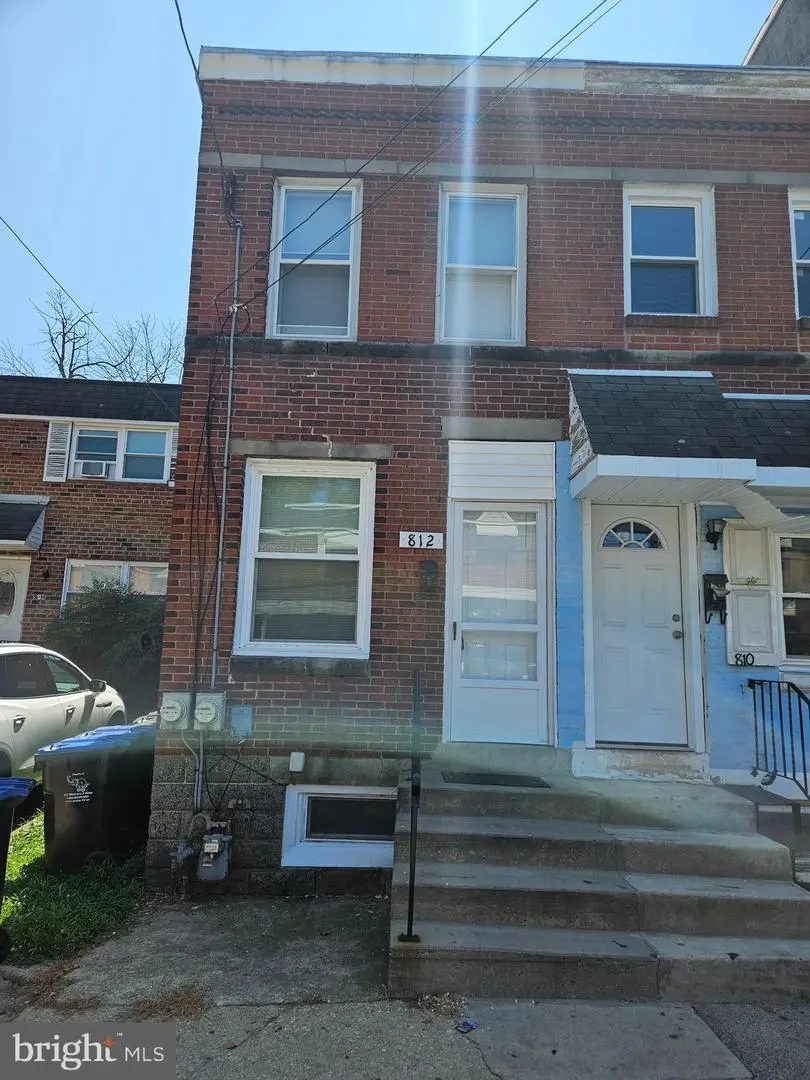
812 Kohn St · Norristown, PA
Flood risk 1/10 · Minimal
- FEMA flood zone
- X (unshaded)
- Chance of flooding over 30 yrs
- 0.0%
- Est. flood insurance / yr
- $473 – $860
Fire risk 1/10 · Minimal
- Est. fire insurance / yr
- $511 – $949
Heat risk 7/10 · Major
- Hot days now (above 102°F)
- 7 days/yr
- Hot days in 30 yrs
- 15 days/yr
Wind risk 6/10 · Moderate
- Chance of severe wind over 30 yrs
- 27.0%
Air-quality risk 4/10 · Minor
- Unhealthy air days now
- 5 days/yr
- Unhealthy air days in 30 yrs
- 8 days/yr
Risk factors via First Street. Map © Google.
Why this score? — see what drove the C grade
The composite is a weighted blend of 9 inputs, each scored 0–100. Each bar is that input's sub-score; the figure is the points it added to the 100-point composite (weight × sub-score).
- Cash flow +25.4/30.0
- DSCR +8.4/10.0
- 1% rule +7.2/10.0
- ARV discount +5.8/15.0
- Livability +4.2/5.0
- Rent growth +2.8/5.0
- Condition / age +2.5/5.0
- Schools +2.2/10.0
- Appreciation +0.0/10.0
$129,900
🖨 Deal sheet 📄 Offer letter ✓ Due diligence
Listing remarks
West End- Up-Dated 2 Story End of Row- ( Property up-dated in 2025) features: Living room w/ knotty pine wall, newer vinyl plank flooring- Kitchen w/ newer white base and wall cabinets, newer counter top, newer gas range, range hood and newer vinyl plank flooring and newer refrigerator- hall to bathroom w/ newer vinyl plank flooring, tub shower and vanity and exit to rear yard. 2nd Floor w/ newer carpet on stairs to 2 bedrooms w/ newer vinyl floors. Full unfinished basement w/ walk out exit to rear yard. Property being Sold in the "As Is Condition " Buyer to apply for the Use and Occupancy Permit at their expense and comply with all requirements at their expense. Landlord is a L
Key facts
- Built 1910
- Listed 9 days
Property features AI
Exterior
- Parking: On-street parking
- Utilities: 100 amp electric service with circuit breakers; Electric available; Natural gas available; Public water; Public sewer; Natural gas hot water
- Home design: End-of-row townhouse; Fee simple ownership; Effective remodel year 2025
- Construction: Brick construction; Block foundation
- Exterior features: Walkout basement with unfinished space; Above-grade and below-grade structures noted; Municipal trash service
Interior
- Kitchen: Gas oven/range
- Bedrooms: Two bedrooms on the upper level
- Bathrooms: One full bathroom on the main level; One full bathroom total
- Heating & cooling: Hot water radiator heating; Natural gas heating
- Interior features: Ceiling fans; Eat-in kitchen; Window treatments; Storm door
- Laundry & utility: Washer/dryer hookups on the lower floor
Neighborhood map
What this means for you Summary
Snapshot
- This is a 2-bed/1.0-bath townhouse listed at $130k.
Deal economics
- At list price, monthly cash flow is $301 ($4k/yr) — positive.
- The deal already cash-flows at list — no discount required.
- Meets the 1% rule at list price ($2k rent vs $130k).
- Cap rate 9.1% vs local median 4.5% in Norristown — top-decile yield for the area; either an underpriced asset or a hidden risk that comps aren't pricing in. Stress-test before assuming the spread holds.
Location & tenants
- Location reads 84/100 on livability (#100 in PA, #720 nationally) — a professional / high-income tenant draw. Strengths: amenities A+, commute A+, cost of living A+; Watch: schools C-, crime D-.
- Norristown Area SD (suburban): math 18% / reading 31% proficiency, ranked #466 of 539 in PA (top 86%) — low school quality limits family demand, transient renter base, plan for 1-2y turnover; 70% free/reduced lunch — lower-income household profile, screen leases tightly.
- Market conditions: Rents rising (+1.3%/yr); 164 active listings in the ZIP; 33 comparable units currently listed for rent nearby; rentals at typical pace (median 24d on market — plan ~3-4 weeks tenant-placement turnaround); 1,936 units permitted in Montgomery County in 2024 (530 in 5+ unit buildings).
Forward outlook
- Local home prices are declining (-3.0%/yr); year-one equity from $898 of loan paydown is wiped out by about $4k of value loss. Plan a longer hold.
- Montgomery County population projected at +5% by 2050 — modest demand growth; plan on rents tracking national, not racing it.
Negotiation context
- Only 9 days on market — expect competitive offers; lowballing is unlikely to land.
- Current owner paid $52k; list at $130k implies a 147% gain — meaningful room to come down on a strong offer.
Risks & watch-outs
- Watch-outs: built in 1910 — expect roof / HVAC / electrical / plumbing capex.
- Climate carrying-cost: major wind risk, 27% chance of damaging wind over 30y; extreme-heat days projected 7→15/yr by 2055 (HVAC capex compounding) — expect insurance premiums to compound above CPI over the hold.
Questions for the listing agent
- Built in 1910 — when were the roof, HVAC, electrical panel, plumbing, and water heater last replaced?
- Is there a deadline driving the sale (1031 exchange, divorce, estate, relocation)? That informs how much negotiation room exists.
- Crime grade is D in this area — have there been break-ins, vandalism, or insurance claims at this property in the last 3 years? What carrier currently insures it and at what premium?
- What's the average days-on-market for RENTAL listings here right now (not sales)? A rising rental-DOM trend means longer vacancies and softer asking-rent achievability than the comps imply.
- What's the recent tenant-quality profile in this submarket — average credit score on applications, eviction rate, late-payment / NSF rate, and stable-employment percentage? A property-management company in the area should have these aggregated.
- How much new for-sale + rental construction is in the pipeline within 1–3 miles? Heavy new supply typically softens prices + rents 12–24 months out; constrained supply supports both.
Investment metrics
- 1% rule
- 1.22% ✓
- Cap rate
- 9.07%
- Cash-on-cash
- 9.93%
- DSCR
- 1.44
- GRM
- 6.8
CMA / ARV
- ARV (on-the-fly)
- $125,235
- Comps found
- 5
Show comp detail 5 sales within ~0.75 mi
| Address | Dist | Beds/Ba | Sqft | Sold | Price | $/sf | Match |
|---|---|---|---|---|---|---|---|
| 879 Cherry St | 0.36mi | 3/1.0 (+1) | 780 (+3%) | 14mo | $68,000 | $87 | 62 |
| 20 Lincoln Ave | 0.35mi | 2/1.0 | 858 (+13%) | 10mo | $130,000 | $152 | 54 |
| 102 Wendover Unit 2-A | 0.68mi | 2/1.0 | 777 (+2%) | 22mo | $215,000 | $277 | 45 |
| 19 E Blackberry Aly | 0.56mi | 2/1.0 | 850 (+12%) | 11mo | $140,000 | $165 | 45 |
| 447 Forrest Ave | 0.72mi | 2/1.0 | 832 (+10%) | 22mo | $224,000 | $269 | 32 |
Match score weights: distance 35% · size 25% · config 20% · recency 20%. Top-matched comps best support the ARV.
Projected returns pro-forma
-3.0% appreciation · 1.29% rent growth · sell at horizon
- IRR
- -3.4%
- Equity multiple
- 0.88×
- Total profit
- $-4,497
- Equity at exit
- $19,369
- IRR
- 4.2%
- Equity multiple
- 1.29×
- Total profit
- $10,379
- Equity at exit
- $11,231
Cash invested: $36,372 (down + closing). Projections, not guarantees.
Landlord ↔ Tenant lean methodology
- Overall (STATE)
- 62 Landlord-Friendly
- State Pennsylvania
- 62 Landlord-Friendly · EVEN
- County
- — inherits STATE
- City
- — inherits STATE
ZIP-level market 19401
- Rents YoY
- 1.3%
- Active inventory
- 164
- Price-to-rent
- 6.8×
Monthly cashflow live
- Estimated rent
- $1,584 high interval (Pro) →
- Mortgage (P&I)
- −$681
- Tax from tax record
- −$215 /mo · $2,578/yr
- Insurance
- −$54
- HOA
- −$0
- Vacancy / Maint / Mgmt
- −$333
- Net cashflow
- $301
Break-even live
UW: 25.0% down · 7.5% · 30yr · 1.5% tax · 5.0% vac · 8.0% maint · 8.0% mgmt
Financing live
Cash to close
- Down payment
- $32,475
- Closing costs
- $3,897
- Reserves months
- —
- Total cash needed
- —
Loan-product check · same deal, 3 products live
Conventional
25% down · 7.5% · 30yr
- Down + closing
- —
- Monthly P&I
- —
- Monthly cashflow
- —
- DSCR
- —
- Eligible?
- —
Personal DTI + credit; lowest rate.
DSCR
20% down · 8.5% · 30yr
- Down + closing
- —
- Monthly P&I
- —
- Monthly cashflow
- —
- DSCR
- —
- Eligible?
- —
No personal income docs; deal must DSCR.
Hard money
10% down · 12.0% · 12mo
- Down + closing
- —
- Monthly P&I
- —
- Monthly cashflow
- —
- DSCR
- —
- Eligible?
- —
Short-term bridge; refi at stabilization.
Rent comps 33 comps
| Address | Beds | Baths | Sqft | Rent | $/sqft | DOM | Units | Dist |
|---|---|---|---|---|---|---|---|---|
| 712 George St Unit 1 Norristown, PA | 1.0 | 1.0 | 700 | $1,500 | $2.14 | 43d | 1 | 0.13mi |
| 822 Stanbridge St Norristown, PA | 1.0–2.0 | 1.0 | 775 | $1,695 | $2.19 | 43d | 1 | 0.16mi |
| 1009 Markley St Unit 1009 1R Norristown, PA | 1.0 | 1.0 | 750 | $1,295 | $1.73 | 43d | 1 | 0.22mi |
| 835 W Marshall St Unit 6 Norristown, PA | 1.0 | 1.0 | 550 | $1,150 | $2.09 | 24d | 1 | 0.32mi |
| 917 Swede St Unit 1 Norristown, PA | 1.0 | 1.0 | 600 | $1,295 | $2.16 | 24d | 1 | 0.39mi |
| 309 W Poplar St Norristown, PA | 1.0–2.0 | 1.0 | 712 | $1,745 | $2.45 | 43d | 1 | 0.44mi |
| 515 Cherry St Norristown, PA | 3.0 | 3.0 | 1100 | $1,995 | $1.81 | 24d | 1 | 0.50mi |
| 221 W Main St Unit 7 Norristown, PA | 1.0 | 1.0 | 740 | $1,450 | $1.96 | 24d | 1 | 0.54mi |
| 1029 W Main St Unit 1R Norristown, PA | 1.0 | 1.0 | 700 | $1,295 | $1.85 | 24d | 1 | 0.60mi |
| 215 W Lafayette St Unit 1 Norristown, PA | 1.0 | 1.0 | 800 | $1,500 | $1.88 | 43d | 1 | 0.61mi |
| 1020 W Main St Unit 3 Norristown, PA | 1.0 | 1.0 | 800 | $1,500 | $1.88 | 3d | 1 | 0.62mi |
| 1 W Main St Unit 504 Norristown, PA | 1.0 | 1.0 | 623 | $1,595 | $2.56 | 18d | 1 | 0.64mi |
| 1115 W Main St Unit 2 Norristown, PA | 3.0 | 1.5 | 1050 | $2,010 | $1.91 | 43d | 1 | 0.64mi |
| 449 Hamilton St Norristown, PA | 2.0 | 1.0 | 582 | $1,519 | $2.61 | 1d | 5 | 0.66mi |
| 423 DeKalb St Norristown, PA | 2.0 | 1.0 | 795 | $1,350 | $1.70 | 24d | 1 | 0.67mi |
| 244 Minor St Norristown, PA | 2.0 | 1.0 | 1098 | $1,700 | $1.55 | 43d | 1 | 0.68mi |
| 801 Laura Ln Norristown, PA | 1.0–2.0 | 1.0 | 787 | $1,695 | $2.15 | 24d | 1 | 0.72mi |
| 1 Meadow Ln Jeffersonville, PA | 2.0 | 1.0 | 975 | $1,847 | $1.89 | 11d | 1 | 0.74mi |
| 1 Meadow Ln Jeffersonville, PA | 2.0 | 1.0 | 975 | $1,597 | $1.64 | 43d | 1 | 0.74mi |
| 1 Meadow Ln Jeffersonville, PA | 1.0 | 1.0 | 950 | $1,597 | $1.68 | 2d | 1 | 0.74mi |
| 1 Meadow Ln Jeffersonville, PA | 1.0 | 1.0 | 775 | $1,597 | $2.06 | 3d | 1 | 0.74mi |
| 421 Wendover Dr Eagleville, PA | 2.0 | 1.0 | 903 | $1,940 | $2.15 | 5d | 1 | 0.90mi |
| 1029 Northridge Dr Unit 82B Norristown, PA | 2.0 | 1.0 | 903 | $1,950 | $2.16 | 43d | 1 | 0.92mi |
| 331 W Logan St Norristown, PA | 1.0–2.0 | 1.0 | 750 | $1,545 | $2.06 | 3d | 18 | 0.95mi |
| 301 E Brown St Unit A9 Norristown, PA | 2.0 | 1.0 | 1000 | $1,595 | $1.59 | 44d | 1 | 1.00mi |
| 301 Violet St Norristown, PA | 1.0 | 1.0 | 800 | $1,200 | $1.50 | 18d | 1 | 1.06mi |
| 1011 New Hope St Norristown, PA | 1.0–2.0 | 1.0 | 807 | $1,810 | $2.24 | 1d | 13 | 1.21mi |
| 708 Carmen Dr Apt B Norristown, PA | 2.0 | 1.0 | 1000 | $1,650 | $1.65 | 22d | 1 | 1.24mi |
| 721 Sandy St Norristown, PA | 1.0 | 1.0 | 600 | $1,375 | $2.29 | 1d | 4 | 1.24mi |
| 900 Luxor Ln Norristown, PA | 2.0 | 1.0–2.0 | 754 | $2,070 | $2.74 | 43d | 20 | 1.38mi |
| 200 Ross Rd King of Prussia, PA | 1.0–2.0 | 1.0 | 950 | $1,750 | $1.84 | 43d | 1 | 1.45mi |
| 311 E 4th St Unit 9 Bridgeport, PA | 2.0 | 1.0 | 900 | $1,800 | $2.00 | 24d | 1 | 1.46mi |
| 520 Russwood Dr Norristown, PA | 1.0–2.0 | 1.0 | 792 | $1,753 | $2.21 | 3d | 13 | 1.49mi |
Listing history 10 events
-
2026-06-18days on market $129,900 Active 9 DOM
-
2026-06-17days on market $129,900 Active 8 DOM
-
2026-06-16days on market $129,900 Active 7 DOM
-
2026-06-15days on market $129,900 Active 6 DOM
-
2026-06-13days on market $129,900 Active 4 DOM
-
2026-06-13days on market $129,900 Active 3 DOM
-
2026-06-10statusdays on market $129,900 Active 1 DOM
-
2026-06-09days on market $129,900 Coming Soon 2 DOM
-
2026-06-08remarks 689-char remark
-
2026-06-08$129,900 Coming Soon 1 DOM
ⓘ Source: listings_history table (triggers on properties + properties_extension) + one-shot
backfill from property_details.listing_events for pre-trigger history.
Tax reassessment forecast PA · Partial reset (capped growth)
- Current annual tax
- $2,578 · $215/mo
- Projected year-2 tax
- $2,578 · $215/mo
- Expected delta
- $0/yr ($0/mo · 0.0%)
ⓘ Screening estimate from a state-policy table — verify with the county assessor before closing.
Climate risk First Street
- Flood 1/10 Low FEMA zone X (unshaded) · 0% chance over 30 yrs
- Wildfire 1/10 Low
- Heat 7/10 Severe 7 d/yr ≥102°F today · 15 d/yr by 30 yrs out
- Wind 6/10 Major 27% chance of damaging wind over 30 yrs
- Air quality 4/10 Moderate 5 unhealthy d/yr today · 8 by 30 yrs out
Nearby sold comps map
Loading sold comps map…
Walkable amenities ~0.75 mi
Loading nearby amenities…
Taxation est. · year 1
- Rental income
- $19,006
- − Mortgage interest
- −$7,276
- − Property taxes
- −$2,578
- − Insurance
- −$650
- − Repairs & maintenance
- −$1,520
- − Management
- −$1,520
- − Depreciation
- −$3,779
- Taxable income
- $1,682
- Est. tax owed @ 24.0%
- −$404
- After-tax cash flow
- $3,209/yr
For passive investors: Depreciation is non-cash, so a rental often shows a tax loss while cash-flowing — sheltering income. Rental losses are passive: they offset passive income freely, and up to $25,000/yr can offset ordinary (W-2) income if you actively participate and your MAGI is under $100k (phasing out to $0 by $150k); unused losses carry forward. On sale, claimed depreciation is recaptured at up to 25%, and gains may owe capital-gains tax (a 1031 exchange can defer both). Figures are a year-1 estimate at your 24.0% rate — not tax advice; consult a CPA.
Schools (NCES district)
- District
- Norristown Area SD
- NCES district ID
- 4216980
- Math proficiency
- 18% ▼ -11.00%
- Reading proficiency
- 31% ▼ -14.00%
- Median HH income
- $56,024
- Composite
- 22.17/100
- National rank
- #8166
- State rank
- #466 of 539 in PA
Livability — Norristown
- Score
- 84/100
- State rank
- #100
- US rank
- #720
Category grades
Schools grade is shown separately in the Schools card above.
Census & demographics
- Census place
- Norristown, PA
- County
- Montgomery County · 712,331 people
- City population
- 87,376
- Metro
- Philadelphia-Camden-Wilmington, PA-NJ-DE-MD
- Population (ZIP)
- 43,359
- Household income
- $69,908
- Rent vs Own
- Severe rent burden
- 2725.0
Population outlook (Montgomery County) Hauer SSP2
- Today (2025)
- 856,074 people
- By 2030
- 870,887 · +1.7%
- By 2040
- 891,195 · +4.1%
- By 2050
- 896,417 · +4.7%
- By 2075
- 903,212 · +5.5%
- By 2100
- 843,240 · -1.5%
Race, ethnicity, and origin ACS 2023
- Neighborhood character
- Highly diverse neighborhood (Simpson 0.72)
- Race & ethnicity
- White 33% Black 29% Hispanic / Latino 29% Two or more races 16% Asian 3% Native American 2%
- Hispanic origin (detail)
- Mexican 16% Puerto Rican 5% Dominican 2%
- Common ancestry
- Romanian 3% Slovak 1%
- Foreign-born
- 17% · Canada, Jamaica, South Korea
- Languages at home
- 71% English-only · Spanish 22% Other Indo-European 2% Russian/Polish/Slavic 1%
Political lean MEDSL · Montgomery
- 2024 margin
- Strong D (+22.8) · D 60.9% · R 38.1% · Other 1.1%
- 2008→2024 swing
- +2.0pp toward D · 2008: 20.8pp · 2024: 22.8pp
- All cycles
- 2024: D+22.8 2020: D+26.3 2016: D+21.1 2012: D+14.3 2008: D+20.8
Not yet ingested
- Civics
- —
Market trends
- HPI YoY
- ▼ -203.75%
- Current HPI
- 301.7748
- Rent YoY
- ▲ 1.29%
- Metro
- Philadelphia-Camden-Wilmington, PA-NJ-DE-MD
- State GDP YoY
- ▲ 1.68%
- F500 in state
- 34
Industry mix (Fortune 500 HQ in PA)
| Industry | F500 HQs | Revenue |
|---|---|---|
| Healthcare | 2 | $309B |
|
||
| Insurance | 2 | $27B |
|
||
| Telecommunications / Media | 1 | $124B |
|
||
| Industrial Distribution | 1 | $22B |
|
||
| Financial Services | 1 | $20B |
|
||
| Chemicals / Materials | 1 | $18B |
|
||
Price history
+147.4% since first listed6 events — show timeline
- 2026-06-07 Coming Soon $129,900 BRIGHT MLS
- 2026-02-22 Rental Removed $1,450 BRIGHTMLS
- 2025-11-08 Price Changed $1,450 BRIGHTMLS
- 2025-09-12 Price Changed $1,600 BRIGHTMLS
- 2025-08-15 Listed for Rent $1,750 BRIGHTMLS
- 2024-02-14 Sold (Public Records) $52,500 Public Records
Property tax history
+2.6%/yrLatest (2026): $2,578 · +2.3% YoY. Source: county tax records.
Cash-flow waterfall
monthlySold comps — $/sqft
last 12 mo · ≤1 miLoading sold comps…