 🏗️ New Construction
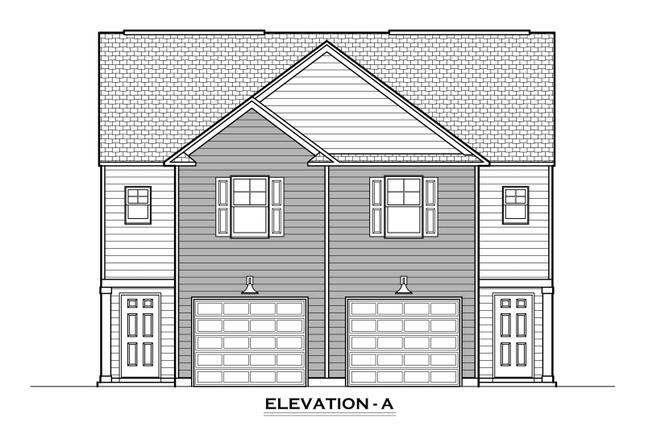
Belmont Plan · Pendleton, SC
Flood risk No data
- FEMA flood zone
- —
- Chance of flooding over 30 yrs
- —
- Est. flood insurance / yr
- —
Fire risk No data
- Est. fire insurance / yr
- —
Heat risk No data
- Hot days now (above threshold)
- —
- Hot days in 30 yrs
- —
Wind risk No data
- Chance of severe wind over 30 yrs
- —
Air-quality risk No data
- Unhealthy air days now
- —
- Unhealthy air days in 30 yrs
- —
Risk factors via First Street. Map © Google.
Why this score? — see what drove the D grade
The composite is a weighted blend of 9 inputs, each scored 0–100. Each bar is that input's sub-score; the figure is the points it added to the 100-point composite (weight × sub-score).
- Cash flow +13.0/30.0
- ARV discount +7.5/15.0
- Schools +4.9/10.0
- DSCR +3.9/10.0
- 1% rule +3.7/10.0
- Livability +3.4/5.0
- Rent growth +2.5/5.0
- Condition / age +2.5/5.0
- Appreciation +0.0/10.0
$221,900
🖨 Deal sheet 📄 Offer letter ✓ Due diligence
Listing remarks
The Belmont by Great Southern Homes is a thoughtfully designed two-story townhome floor plan offering approximately 1,472 square feet of efficient and functional living space. This plan features 3 bedrooms and 2.5 baths, making it an ideal option for homeowners seeking low-maintenance living with well-defined spaces and modern conveniences. The main level offers an open-concept layout that connects the kitchen, dining area, and great room, creating a comfortable flow for everyday living and entertaining. The kitchen includes ample cabinetry and counter space, while the great room opens directly to a rear patio or deck, with options for a covered or screened outdoor living area. A powder roo
Key facts
- Lake hartwell
- Boscobel golf club
- Parking
Tags
Property features AI
Finance
- Financial info: List price available (plan/listing status active)
Exterior
- Parking: 1 parking space
- Utilities: Natural gas and electric service; Central air for cooling
- Home design: Single-family plan (Belmont); Status: Active
- Exterior features: Living area approximately 1,472 (per listing)
Interior
- Bedrooms: 3 bedrooms
- Bathrooms: 2 full bathrooms and 1 half bathroom (2.5 total)
- Heating & cooling: Natural gas and electric heating; Central air conditioning
- Interior features: Active plan named Belmont (new construction plan)
Neighborhood map
What this means for you Summary
Snapshot
- This is a 3-bed/2.5-bath townhouse listed at $222k.
Deal economics
- At list price, monthly cash flow is $-11 ($-133/yr) — negative.
- To cash-flow at today's rent, offer at most $215k (3.2% below list).
- To meet the 1% rule (rent ≥ 1% of price), the offer needs to be $188k (15.3% below list).
- Recommended offer: $188k (15.3% below list) — sets the bar for 1% rule.
- Cap rate 6.2% vs local median 3.2% in Pendleton — top-decile yield for the area; either an underpriced asset or a hidden risk that comps aren't pricing in. Stress-test before assuming the spread holds.
Location & tenants
- Location reads 68/100 on livability (#82 in SC) — a middle-class / working-renter tenant base. Strengths: cost of living A+, housing A, health & safety B+; Watch: schools D+, amenities F, commute F.
- Anderson 04 (rural): math 56% / reading 60% proficiency, ranked #4 of 80 in SC (top 5%) — acceptable for families but not a draw, mixed tenant base, ~2y average lease.
- Market conditions: 161 active listings in the ZIP; 2 comparable units currently listed for rent nearby; 1,255 units permitted in Anderson County in 2024 (0 in 5+ unit buildings).
- This rent runs 31% of the median local income ($72k/yr) — at the standard rent-burdened threshold; future hikes will face affordability resistance.
Forward outlook
- Local home prices are declining (-3.0%/yr); year-one equity from $1k of loan paydown is wiped out by about $6k of value loss. Plan a longer hold.
- Anderson County population projected at +14% by 2050 — modest demand growth; plan on rents tracking national, not racing it.
Negotiation context
- It's been on market 325 days — a 12% lower offer ($195k) is reasonable based on typical stale-listing flexibility.
Questions for the listing agent
- What do current leases actually rent for vs. the listed asking? Can we see a recent rent roll and the last 12 months of T-12 income?
- It's been on market 325 days. Have you received any prior offers? Is the seller open to a 15% concession, seller financing, or rate buy-down credit?
- Why hasn't it sold? Are there any deal-killer items the seller is aware of (foundation, flood, title, zoning, code violations)?
- Is there a deadline driving the sale (1031 exchange, divorce, estate, relocation)? That informs how much negotiation room exists.
- Schools are D-rated, which usually means shorter tenancies and higher turnover. Who's the typical renter profile here, and what's been the actual vacancy rate?
- The area grade is low — what's the realistic commute time and amenity access for the typical tenant pool here? Any planned neighborhood developments (good or bad) we should know about?
- What's the average days-on-market for RENTAL listings here right now (not sales)? A rising rental-DOM trend means longer vacancies and softer asking-rent achievability than the comps imply.
- What's the recent tenant-quality profile in this submarket — average credit score on applications, eviction rate, late-payment / NSF rate, and stable-employment percentage? A property-management company in the area should have these aggregated.
- How much new for-sale + rental construction is in the pipeline within 1–3 miles? Heavy new supply typically softens prices + rents 12–24 months out; constrained supply supports both.
Investment metrics
- 1% rule
- 0.87% ✗
- Cap rate
- 6.23%
- Cash-on-cash
- -0.22%
- DSCR
- 0.99
- GRM
- 9.6
CMA / ARV
- ARV (on-the-fly)
- $216,384
- Comps found
- 12
Show comp detail 12 sales within ~0.75 mi
| Address | Dist | Beds/Ba | Sqft | Sold | Price | $/sf | Match |
|---|---|---|---|---|---|---|---|
| 571 Seaborn Cir | 0.07mi | 3/2.5 | 1,450 (-2%) | 3mo | $224,900 | $155 | 92 |
| 596 Seaborn Cir | 0.09mi | 3/2.5 | 1,510 (+3%) | 2mo | $219,900 | $146 | 89 |
| 616 Seaborn Cir | 0.09mi | 3/2.5 | 1,509 (+2%) | 3mo | $221,900 | $147 | 89 |
| 221 Samuel St | 0.22mi | 3/2.5 | 1,466 (-0%) | 0mo | $215,500 | $147 | 88 |
| 573 Seaborn Cir | 0.09mi | 3/2.5 | 1,518 (+3%) | 4mo | $215,000 | $142 | 87 |
| 538 Seaborn Cir | 0.14mi | 3/2.5 | 1,521 (+3%) | 3mo | $225,000 | $148 | 86 |
| 575 Seaborn Cir | 0.09mi | 3/2.5 | 1,544 (+5%) | 2mo | $222,900 | $144 | 86 |
| 598 Seaborn Cir | 0.10mi | 3/2.5 | 1,540 (+5%) | 3mo | $219,900 | $143 | 85 |
| 549 Seaborn Cir | 0.10mi | 3/2.5 | 1,540 (+5%) | 4mo | $209,900 | $136 | 85 |
| 551 Seaborn Cir | 0.10mi | 3/2.5 | 1,540 (+5%) | 4mo | $209,900 | $136 | 85 |
| 117 Adger Rd | 0.34mi | 3/2.5 | 1,424 (-3%) | 1mo | $218,900 | $154 | 78 |
| 131 Adger Rd | 0.30mi | 3/3.0 | 1,281 (-13%) | 4mo | $203,000 | $158 | 59 |
Match score weights: distance 35% · size 25% · config 20% · recency 20%. Top-matched comps best support the ARV.
Projected returns pro-forma
-3.0% appreciation · 3.0% rent growth · sell at horizon
- IRR
- -16.7%
- Equity multiple
- 0.41×
- Total profit
- $-35,743
- Equity at exit
- $32,264
- IRR
- -8.4%
- Equity multiple
- 0.47×
- Total profit
- $-31,922
- Equity at exit
- $18,709
Cash invested: $60,588 (down + closing). Projections, not guarantees.
Landlord ↔ Tenant lean methodology
- Overall (STATE)
- 90 Strongly Landlord-Friendly
- State South Carolina
- 90 Strongly Landlord-Friendly · R+6
- County
- — inherits STATE
- City
- — inherits STATE
ZIP-level market 29670
- Home prices YoY
- -2.8%
- Active inventory
- 161
- Price-to-rent
- 9.8×
Monthly cashflow live
- Estimated rent
- $1,879 medium interval (Pro) →
- Mortgage (P&I)
- −$1,135
- Tax est. 1.5%
- −$270 /mo · $3,246/yr
- Insurance
- −$90
- HOA
- −$0
- Vacancy / Maint / Mgmt
- −$395
- Net cashflow
- $-11
Break-even live
UW: 25.0% down · 7.5% · 30yr · 1.5% tax · 5.0% vac · 8.0% maint · 8.0% mgmt
Financing live
Cash to close
- Down payment
- $54,096
- Closing costs
- $6,492
- Reserves months
- —
- Total cash needed
- —
Loan-product check · same deal, 3 products live
Conventional
25% down · 7.5% · 30yr
- Down + closing
- —
- Monthly P&I
- —
- Monthly cashflow
- —
- DSCR
- —
- Eligible?
- —
Personal DTI + credit; lowest rate.
DSCR
20% down · 8.5% · 30yr
- Down + closing
- —
- Monthly P&I
- —
- Monthly cashflow
- —
- DSCR
- —
- Eligible?
- —
No personal income docs; deal must DSCR.
Hard money
10% down · 12.0% · 12mo
- Down + closing
- —
- Monthly P&I
- —
- Monthly cashflow
- —
- DSCR
- —
- Eligible?
- —
Short-term bridge; refi at stabilization.
Rent comps 2 comps
| Address | Beds | Baths | Sqft | Rent | $/sqft | DOM | Units | Dist |
|---|---|---|---|---|---|---|---|---|
| 145 Adger Rd Pendleton, SC | 3.0 | 2.5 | 1488 | $1,675 | $1.13 | 2d | 1 | 0.25mi |
| 804 S Mechanic St Unit 3A Pendleton, SC | 3.0 | 2.5 | 1320 | $1,675 | $1.27 | 23d | 1 | 1.41mi |
Listing history 15 events
-
2026-06-18days on market $221,900 Active 325 DOM
-
2026-06-17days on market $221,900 Active 324 DOM
-
2026-06-16days on market $221,900 Active 323 DOM
-
2026-06-15days on market $221,900 Active 322 DOM
-
2026-06-13days on market $221,900 Active 320 DOM
-
2026-06-13days on market $221,900 Active 319 DOM
-
2026-06-10days on market $221,900 Active 317 DOM
-
2026-06-09days on market $221,900 Active 316 DOM
-
2026-06-08days on market $221,900 Active 315 DOM
-
2026-06-07days on market $221,900 Active 314 DOM
-
2026-06-05days on market $221,900 Active 311 DOM
-
2026-06-03days on market $221,900 Active 310 DOM
-
2026-06-03days on market $221,900 Active 309 DOM
-
2026-06-01days on market $221,900 Active 308 DOM
-
2026-05-31days on market $221,900 Active 307 DOM
ⓘ Source: listings_history table (triggers on properties + properties_extension) + one-shot
backfill from property_details.listing_events for pre-trigger history.
Nearby sold comps map
Loading sold comps map…
Walkable amenities ~0.75 mi
Loading nearby amenities…
Taxation est. · year 1
- Rental income
- $22,546
- − Mortgage interest
- −$12,121
- − Property taxes
- −$3,246
- − Insurance
- −$1,082
- − Repairs & maintenance
- −$1,804
- − Management
- −$1,804
- − Depreciation
- −$6,295
- Taxable loss
- −$3,805
- Est. tax savings @ 24.0%
- +$913
- After-tax cash flow
- $780/yr
For passive investors: Depreciation is non-cash, so a rental often shows a tax loss while cash-flowing — sheltering income. Rental losses are passive: they offset passive income freely, and up to $25,000/yr can offset ordinary (W-2) income if you actively participate and your MAGI is under $100k (phasing out to $0 by $150k); unused losses carry forward. On sale, claimed depreciation is recaptured at up to 25%, and gains may owe capital-gains tax (a 1031 exchange can defer both). Figures are a year-1 estimate at your 24.0% rate — not tax advice; consult a CPA.
Schools (NCES district)
- District
- Anderson 04
- NCES district ID
- 4500870
- Math proficiency
- 56% ▼ -5.00%
- Reading proficiency
- 60% ▼ -1.00%
- Median HH income
- $48,338
- Composite
- 49.25/100
- National rank
- #2030
- State rank
- #4 of 80 in SC
Livability — Pendleton
- Score
- 68/100
- State rank
- #82
- US rank
- #9399
Category grades
Schools grade is shown separately in the Schools card above.
Census & demographics
- Census place
- Pendleton, SC
- County
- Anderson County · 99,076 people
- City population
- 11,084
- Metro
- Greenville-Anderson, SC
- Population (ZIP)
- 11,084
- Household income
- $72,445
- Rent vs Own
- Severe rent burden
- 280.0
Population outlook (Anderson County) Hauer SSP2
- Today (2025)
- 210,546 people
- By 2030
- 217,791 · +3.4%
- By 2040
- 230,643 · +9.5%
- By 2050
- 240,220 · +14.1%
- By 2075
- 259,518 · +23.3%
- By 2100
- 258,696 · +22.9%
Race, ethnicity, and origin ACS 2023
- Neighborhood character
- Predominantly White (75%)
- Race & ethnicity
- White 75% Black 15% Two or more races 5% Hispanic / Latino 2% Asian 1%
- Common ancestry
- Slovak 5% Lithuanian 5% Serbian 4%
- Foreign-born
- 3% · Canada
- Languages at home
- 96% English-only · Spanish 2% Other Indo-European 1%
Political lean MEDSL · Anderson
- 2024 margin
- Solid R (+47.4) · D 25.7% · R 73.1% · Other 1.2%
- 2008→2024 swing
- -14.1pp toward R · 2008: -33.3pp · 2024: -47.4pp
- All cycles
- 2024: R+47.4 2020: R+42.0 2016: R+43.7 2012: R+36.4 2008: R+33.3
Not yet ingested
- Civics
- —
Market trends
- HPI YoY
- ▼ -10.11%
- Current HPI
- 348.1373
- Rent YoY
- —
- Metro
- Greenville-Anderson, SC
- State GDP YoY
- ▲ 4.51%
- F500 in state
- 2
Industry mix (Fortune 500 HQ in SC)
| Industry | F500 HQs | Revenue |
|---|---|---|
| Packaging | 1 | $7B |
|
||
Cash-flow waterfall
monthlySold comps — $/sqft
last 12 mo · ≤1 miLoading sold comps…