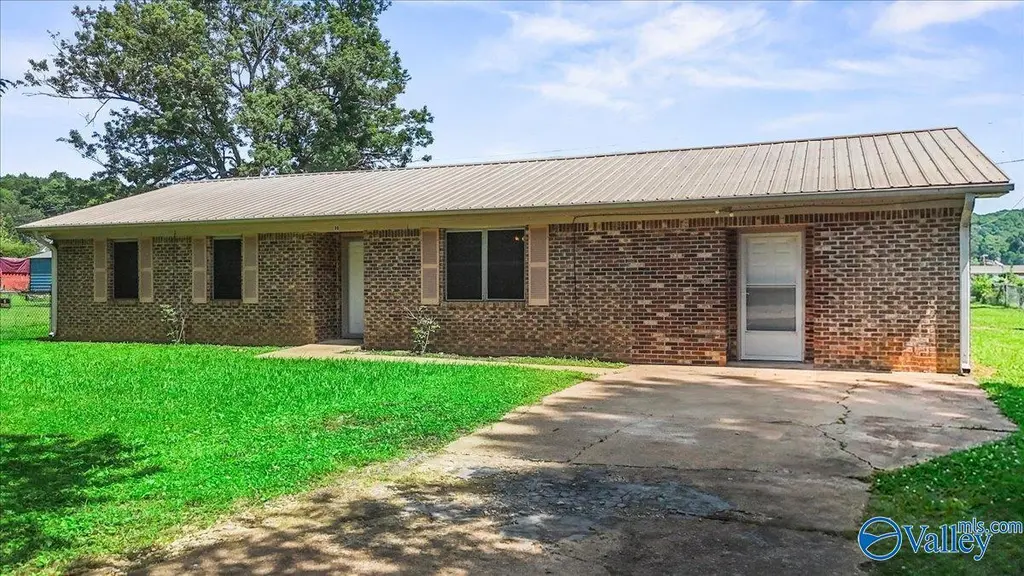
80 Mcdonald Ln · Guntersville, AL
Flood risk 6/10 · Moderate
- FEMA flood zone
- X (unshaded)
- Chance of flooding over 30 yrs
- 0.7%
- Est. flood insurance / yr
- $507 – $1,088
Fire risk 4/10 · Minor
- Est. fire insurance / yr
- $916 – $1,700
Heat risk 6/10 · Moderate
- Hot days now (above 106°F)
- 8 days/yr
- Hot days in 30 yrs
- 22 days/yr
Wind risk 5/10 · Moderate
- Chance of severe wind over 30 yrs
- 25.0%
Air-quality risk 2/10 · Minimal
- Unhealthy air days now
- 0 days/yr
- Unhealthy air days in 30 yrs
- 1 days/yr
Risk factors via First Street. Map © Google.
Why this score? — see what drove the D+ grade
The composite is a weighted blend of 9 inputs, each scored 0–100. Each bar is that input's sub-score; the figure is the points it added to the 100-point composite (weight × sub-score).
- Cash flow +15.5/30.0
- ARV discount +15.0/15.0
- DSCR +4.8/10.0
- 1% rule +3.2/10.0
- Livability +3.0/5.0
- Rent growth +2.5/5.0
- Condition / age +2.5/5.0
- Schools +2.2/10.0
- Appreciation +0.0/10.0
$199,900
🖨 Deal sheet (PDF) 📄 Offer letter ✓ Due diligence
Listing remarks MLS
Nice full brick Ranch in great location close to Guntersville Lake. New paint & carpet. House was originally a 3 bedroom and could be easily converted back to a 3 bedroom. Formal Living Room, large eat-in Kitchen/Breakfast, great Family Room with wood ceiling. Laundry room has plenty of storage space. Large, fenced level yard. See attachment for PAS requirements and WFHM offer submittal information in the MLS document section.
Key facts
- Fenced back yard
- Conveniently located
- Level back yard
Tags
Property features AI
Finance
- Other: Directions: Hwy 431 North, turn left on McDonald; house on the right.
- HOA & community: No homeowners association; Subdivision: Mcdonald
Exterior
- Parking: Concrete driveway
- Utilities: Septic tank sewer; Electric service
- Home design: Single-family residence; Built in 1981; Brick construction
- Construction: Slab foundation
- Exterior features: Lot size about 0.37 acres (110 x 150); Public water
Interior
- Kitchen: Range; Dishwasher; Refrigerator
- Bathrooms: 1 full bathroom
- Heating & cooling: Central heating (electric); Central cooling (electric)
- Interior features: One-level living
Neighborhood map
What this means for you Summary
Snapshot
- This is a 3-bed/1.0-bath single-family listed at $200k.
Deal economics
- At list price, monthly cash flow is $82 ($978/yr) — positive.
- The deal already cash-flows at list — no discount required.
- To meet the 1% rule (rent ≥ 1% of price), the offer needs to be $163k (18.2% below list).
- Recommended offer: $163k (18.2% below list) — sets the bar for 1% rule.
- Cap rate 6.8% vs local median 2.1% in Guntersville — top-decile yield for the area; either an underpriced asset or a hidden risk that comps aren't pricing in. Stress-test before assuming the spread holds.
Location & tenants
- Location reads 59/100 on livability (#323 in AL) — a working-class tenant base; expect higher turnover. Strengths: cost of living A+, housing A+; Watch: crime C-, employment C-, amenities F.
- Marshall County (rural): math 14% / reading 38% proficiency, ranked #86 of 129 in AL (top 67%) — low school quality limits family demand, transient renter base, plan for 1-2y turnover; 63% free/reduced lunch — lower-income household profile, screen leases tightly.
- Zoned schools: Kate D Smith Dar Elementary School (math 27% / reading 52%, grade F, #243 of 627 statewide, top 41%, 585 students, 43% FRL); Kate Duncan Smith Dar Middle (math 13% / reading 54%, grade F, #99 of 257 statewide, top 39%, 364 students, 42% FRL); Kate D Smith Dar High School (math 32% / reading 52%, grade F, #28 of 305 statewide, top 10%, 394 students, 34% FRL) — zoned schools average 39% FRL vs 63% district-wide (24 pts lower); this property's tenant base skews higher-income than the district average.
- Zoned-school proficiency averages 38% at this address vs 26% district-wide (+12 pts) — the actual schools serving this property are materially stronger than the Marshall County average implies; a family-tenant draw the district grade alone would hide.
- Market conditions: 467 active listings in the ZIP; 163 units permitted in Marshall County in 2024 (0 in 5+ unit buildings).
Forward outlook
- Local home prices are declining (-3.0%/yr); year-one equity from $1k of loan paydown is wiped out by about $6k of value loss. Plan a longer hold.
Negotiation context
- Only 14 days on market — expect competitive offers; lowballing is unlikely to land.
- 2 sale attempts since 11y ago with the ask held roughly flat each time — persistent listings suggest the price (not the market) is what's stuck; bring a comps-based counter.
- Current owner paid $65k; list at $200k implies a 208% gain — meaningful room to come down on a strong offer.
Risks & watch-outs
- Climate carrying-cost: major flood risk; moderate wind risk, 25% chance of damaging wind over 30y; extreme-heat days projected 8→22/yr by 2055 (HVAC capex compounding) — expect insurance premiums to compound above CPI over the hold.
Questions for the listing agent
- Is there a deadline driving the sale (1031 exchange, divorce, estate, relocation)? That informs how much negotiation room exists.
- Schools are D-rated, which usually means shorter tenancies and higher turnover. Who's the typical renter profile here, and what's been the actual vacancy rate?
- The area grade is low — what's the realistic commute time and amenity access for the typical tenant pool here? Any planned neighborhood developments (good or bad) we should know about?
- What's the average days-on-market for RENTAL listings here right now (not sales)? A rising rental-DOM trend means longer vacancies and softer asking-rent achievability than the comps imply.
- What's the recent tenant-quality profile in this submarket — average credit score on applications, eviction rate, late-payment / NSF rate, and stable-employment percentage? A property-management company in the area should have these aggregated.
- How much new for-sale + rental construction is in the pipeline within 1–3 miles? Heavy new supply typically softens prices + rents 12–24 months out; constrained supply supports both.
Investment metrics
- 1% rule
- 0.82% ✗
- Cap rate
- 6.78%
- Cash-on-cash
- 1.75%
- DSCR
- 1.08
- GRM
- 10.2
CMA / ARV
- ARV (on-the-fly)
- $266,766
- Comps found
- 3
Show comp detail 3 sales within ~0.75 mi
| Address | Dist | Beds/Ba | Sqft | Sold | Price | $/sf | Match |
|---|---|---|---|---|---|---|---|
| 216 Mcdonald Ln | 0.15mi | 4/2.0 (+1) | 1,647 (+7%) | 9mo | $200,000 | $121 | 65 |
| 357 Tara Rd | 0.39mi | 3/2.0 | 1,463 (-5%) | 7mo | $265,900 | $182 | 64 |
| 9 Obrian Cir | 0.18mi | 3/2.0 | 1,672 (+8%) | 23mo | $289,900 | $173 | 55 |
Match score weights: distance 35% · size 25% · config 20% · recency 20%. Top-matched comps best support the ARV.
Projected returns pro-forma
-3.0% appreciation · 3.0% rent growth · sell at horizon
- IRR
- -13.6%
- Equity multiple
- 0.51×
- Total profit
- $-27,281
- Equity at exit
- $29,806
- IRR
- -4.7%
- Equity multiple
- 0.69×
- Total profit
- $-17,399
- Equity at exit
- $17,284
Cash invested: $55,972 (down + closing). Projections, not guarantees.
Landlord ↔ Tenant lean methodology
- Overall (STATE)
- 90 Strongly Landlord-Friendly
- State Alabama
- 90 Strongly Landlord-Friendly · R+15
- County
- — inherits STATE
- City
- — inherits STATE
ZIP-level market 35976
- Home prices YoY
- -25.1%
- Active inventory
- 467
- Price-to-rent
- 10.2×
Monthly cashflow live
- Estimated rent
- $1,635 medium interval (Pro) →
- Mortgage (P&I)
- −$1,048
- Tax from tax record
- −$78 /mo · $942/yr
- Insurance
- −$83
- HOA
- −$0
- Vacancy / Maint / Mgmt
- −$343
- Net cashflow
- $82
Break-even live
Sensitivity live
| Price | -10% $195 | -5% $138 | +0% $82 | +5% $25 | +10% $-32 |
|---|---|---|---|---|---|
| Rent | -10% $-48 | -5% $17 | +0% $82 | +5% $146 | +10% $211 |
| Rate | -1.0pp $182 | -0.5pp $132 | base $82 | +0.5pp $30 | +1.0pp $-23 |
UW: 25.0% down · 7.5% · 30yr · 1.5% tax · 5.0% vac · 8.0% maint · 8.0% mgmt
Financing live
Cash to close
- Down payment
- $49,975
- Closing costs
- $5,997
- Reserves months
- —
- Total cash needed
- —
Loan-product check · same deal, 3 products live
Conventional
25% down · 7.5% · 30yr
- Down + closing
- —
- Monthly P&I
- —
- Monthly cashflow
- —
- DSCR
- —
- Eligible?
- —
Personal DTI + credit; lowest rate.
DSCR
20% down · 8.5% · 30yr
- Down + closing
- —
- Monthly P&I
- —
- Monthly cashflow
- —
- DSCR
- —
- Eligible?
- —
No personal income docs; deal must DSCR.
Hard money
10% down · 12.0% · 12mo
- Down + closing
- —
- Monthly P&I
- —
- Monthly cashflow
- —
- DSCR
- —
- Eligible?
- —
Short-term bridge; refi at stabilization.
Listing history 12 events
-
2026-06-18days on market $199,900 Active 14 DOM
-
2026-06-17days on market $199,900 Active 13 DOM
-
2026-06-16days on market $199,900 Active 12 DOM
-
2026-06-15days on market $199,900 Active 11 DOM
-
2026-06-14days on market $199,900 Active 9 DOM
-
2026-06-13days on market $199,900 Active 8 DOM
-
2026-06-10days on market $199,900 Active 6 DOM
-
2026-06-09days on market $199,900 Active 5 DOM
-
2026-06-08days on market $199,900 Active 4 DOM
-
2026-06-07days on market $199,900 Active 3 DOM
-
2026-06-05remarks 227-char remark
-
2026-06-05$199,900 Active 1 DOM
ⓘ Source: listings_history table (triggers on properties + properties_extension) + one-shot
backfill from property_details.listing_events for pre-trigger history.
Tax reassessment forecast AL · Resets to sale price
- Current annual tax
- $942 · $78/mo
- Projected year-2 tax
- $942 · $78/mo
- Expected delta
- $0/yr ($0/mo · 0.0%)
ⓘ Screening estimate from a state-policy table — verify with the county assessor before closing.
Climate risk First Street
- Flood 6/10 Major FEMA zone X (unshaded) · 70% chance over 30 yrs
- Wildfire 4/10 Moderate
- Heat 6/10 Major 8 d/yr ≥106°F today · 22 d/yr by 30 yrs out
- Wind 5/10 Major 25% chance of damaging wind over 30 yrs
- Air quality 2/10 Low 0 unhealthy d/yr today · 1 by 30 yrs out
Nearby sold comps map
Loading sold comps map…
Walkable amenities ~0.75 mi
Loading nearby amenities…
Taxation est. · year 1
- Rental income
- $19,619
- − Mortgage interest
- −$11,198
- − Property taxes
- −$942
- − Insurance
- −$1,000
- − Repairs & maintenance
- −$1,570
- − Management
- −$1,570
- − Depreciation
- −$5,815
- Taxable loss
- −$2,474
- Est. tax savings @ 24.0%
- +$594
- After-tax cash flow
- $1,572/yr
For passive investors: Depreciation is non-cash, so a rental often shows a tax loss while cash-flowing — sheltering income. Rental losses are passive: they offset passive income freely, and up to $25,000/yr can offset ordinary (W-2) income if you actively participate and your MAGI is under $100k (phasing out to $0 by $150k); unused losses carry forward. On sale, claimed depreciation is recaptured at up to 25%, and gains may owe capital-gains tax (a 1031 exchange can defer both). Figures are a year-1 estimate at your 24.0% rate — not tax advice; consult a CPA.
Schools (NCES district)
- District
- Marshall County
- NCES district ID
- 0100006
- Math proficiency
- 14% ▼ -26.00%
- Reading proficiency
- 38% ▲ 2.00%
- Median HH income
- $40,439
- Composite
- 21.88/100
- National rank
- #8234
- State rank
- #86 of 129 in AL
Livability — Guntersville
- Score
- 59/100
- State rank
- #323
- US rank
- #19857
Category grades
Schools grade is shown separately in the Schools card above.
Census & demographics
- City population
- 16,604
- Population (ZIP)
- 16,604
Population outlook (Marshall County) Hauer SSP2
- Today (2025)
- 97,402 people
- By 2030
- 98,138 · +0.8%
- By 2040
- 98,502 · +1.1%
- By 2050
- 97,024 · -0.4%
- By 2075
- 89,334 · -8.3%
- By 2100
- 74,749 · -23.3%
Race, ethnicity, and origin ACS 2023
- Neighborhood character
- Predominantly White (84%)
- Race & ethnicity
- White 84% Black 6% Two or more races 6% Hispanic / Latino 5%
- Hispanic origin (detail)
- Mexican 4%
- Common ancestry
- Slovak 2% Serbian 2% Italian 2%
- Foreign-born
- 3% · Canada
- Languages at home
- 94% English-only · Spanish 4% French/Haitian/Cajun 1%
Political lean MEDSL · Marshall
- 2024 margin
- Solid R (+71.7) · D 13.8% · R 85.5%
- 2008→2024 swing
- -15.4pp toward R · 2008: -56.4pp · 2024: -71.7pp
- All cycles
- 2024: R+71.7 2020: R+68.7 2016: R+69.5 2012: R+60.1 2008: R+56.4
Not yet ingested
- Civics
- —
Market trends
- HPI YoY
- ▼ -74.75%
- Current HPI
- 223.0157
- Rent YoY
- —
- Metro
- —
- State GDP YoY
- ▲ 2.94%
- F500 in state
- 4
Industry mix (Fortune 500 HQ in AL)
| Industry | F500 HQs | Revenue |
|---|---|---|
| Financial Services | 1 | $8B |
|
||
| Healthcare | 1 | $5B |
|
||
Price history
+308.0% since first listed4 events — show timeline
- 2026-06-04 Listed $199,900 VMLS
- 2018-07-13 Sold (Public Records) $65,000 Public Records
- 2015-07-07 Sold (MLS) $40,000 VMLS
- 2015-04-24 Listed $49,000 VMLS
Property tax history
+6.3%/yrLatest (2025): $942 · +7.0% YoY. Source: county tax records.
Cash-flow waterfall
monthlySold comps — $/sqft
last 12 mo · ≤1 miLoading sold comps…