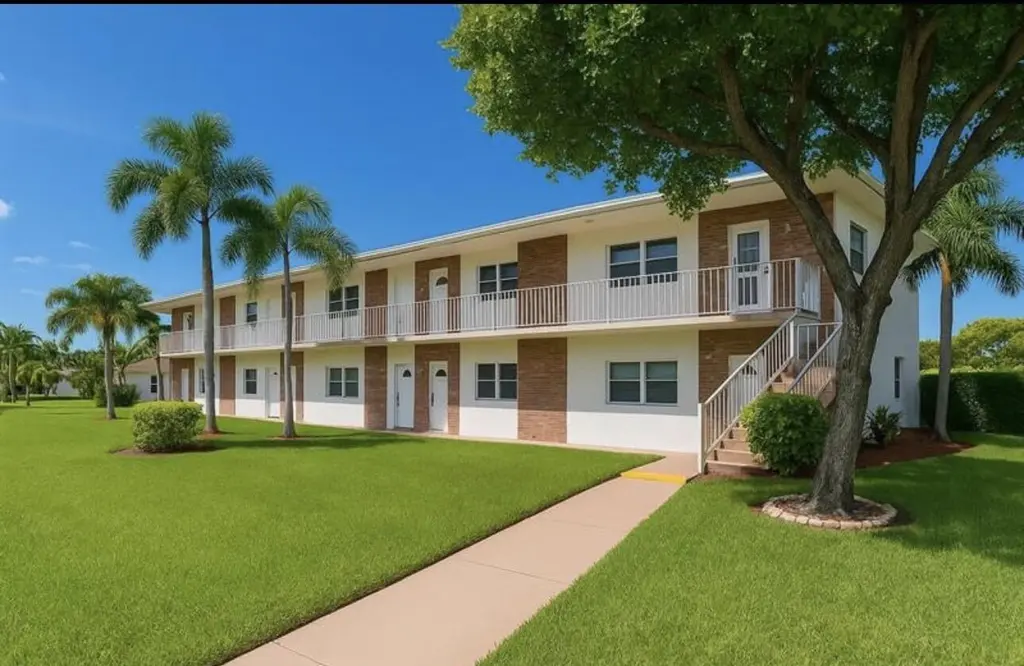
2851 E Golf Blvd #206 · Pompano Beach, FL
Flood risk No data
- FEMA flood zone
- —
- Chance of flooding over 30 yrs
- —
- Est. flood insurance / yr
- —
Fire risk No data
- Est. fire insurance / yr
- —
Heat risk No data
- Hot days now (above threshold)
- —
- Hot days in 30 yrs
- —
Wind risk No data
- Chance of severe wind over 30 yrs
- —
Air-quality risk No data
- Unhealthy air days now
- —
- Unhealthy air days in 30 yrs
- —
Risk factors via First Street. Map © Google.
Why this score? — see what drove the B grade
The composite is a weighted blend of 9 inputs, each scored 0–100. Each bar is that input's sub-score; the figure is the points it added to the 100-point composite (weight × sub-score).
- Cash flow +30.0/30.0
- 1% rule +10.0/10.0
- DSCR +10.0/10.0
- ARV discount +7.5/15.0
- Schools +4.1/10.0
- Livability +3.7/5.0
- Rent growth +2.9/5.0
- Condition / age +2.5/5.0
- Appreciation +0.0/10.0
$119,000
🖨 Deal sheet (PDF) 📄 Offer letter ✓ Due diligence
Listing remarks
LOCATION, LOCATION, LOCATION! Just 4 miles from the beach and conveniently located near Tri-Rail stations, this beautifully updated 2-bedroom, 1-bath condo is nestled in the desirable Leisureville Golf Community. Situated on the second floor, this unit offers peaceful golf course views and access to a free 9-hole golf course for residents. Freshly painted with new flooring, this move-in-ready condo is just steps from the pool, clubhouse, shuffleboard, billiards room, dry sauna, and more. Enjoy the Florida lifestyle in a vibrant 55+ community with resort-style amenities. Call today and make this slice of paradise your new home!
Key facts
- Golf course views
- Steps from the pool
- $263 HOA
Tags
Property features AI
Finance
- Other: Senior community
- Financial info: Not land-leased; Pets allowed with no restrictions
- HOA & community: Has association (Leisureville Association); Monthly HOA fee of 263; HOA covers common areas, golf, and pool service; Association amenities: Laundry, Pool (heated), Shuffleboard court, Storage, Community room, Maintained community, Maintenance
Exterior
- Parking: Detached carport; Attached carport; Total parking for 1 vehicle
- Security: Security features present (other)
- Utilities: Public water; Public sewer; Utilities: Other
- Home design: Condominium; Two stories (entry on second floor); Faces east; Resale condition
- Construction: Tile roof; Construction material: Other; 760 sq ft building area (public records)
- Exterior features: Second-floor entry; Not waterfront
Interior
- Kitchen: Disposal; Dishwasher; Electric range; Refrigerator
- Bedrooms: 2 bedrooms on the main level
- Flooring: Laminate; Tile; Wood; Other
- Bathrooms: 1 full bathroom
- Heating & cooling: Has heating (type: other); Central air; Ceiling fan(s)
- Interior features: Walk-in closet(s)
Neighborhood map
What this means for you Summary
Snapshot
- This is a 2-bed/1.0-bath condo listed at $119k.
Deal economics
- At list price, monthly cash flow is $447 ($5k/yr) — positive.
- The deal already cash-flows at list — no discount required.
- Meets the 1% rule at list price ($2k rent vs $119k).
- Recommended offer: $117k (1.5% below list) — sets the bar for market timing.
- Cap rate 10.8% vs local median 3.1% in Pompano Beach — top-decile yield for the area; either an underpriced asset or a hidden risk that comps aren't pricing in. Stress-test before assuming the spread holds.
Location & tenants
- Location reads 74/100 on livability (#284 in FL, #4,541 nationally) — a middle-class / working-renter tenant base. Strengths: commute A+, housing A+, cost of living B+; Watch: employment D+, amenities F.
- Broward (suburban): math 42% / reading 53% proficiency, ranked #46 of 73 in FL (top 63%) — families likely to look elsewhere, expect single-tenant / working-renter base with shorter leases.
- Zoned schools: Palmview Elementary School (math 24% / reading 41%, grade F, #1,787 of 2,144 statewide, top 84%, 532 students, 82% FRL); Crystal Lake Middle School (math 24% / reading 38%, grade F, #462 of 571 statewide, top 81%, 1,055 students, 74% FRL); Blanche Ely High School (math 7% / reading 29%, grade F, #570 of 667 statewide, top 86%, 1,906 students, 75% FRL) — zoned schools average 77% FRL vs 51% district-wide (26 pts higher); higher-poverty schools than district average — tighter screening recommended.
- Zoned-school proficiency averages 27% at this address vs 48% district-wide (-20 pts) — the specific schools serving this property underperform the Broward average; the district grade overstates school quality for this exact location.
- Market conditions: Rents rising (+1.8%/yr); 597 active listings in the ZIP; 40 comparable units currently listed for rent nearby; rentals at typical pace (median 26d on market — plan ~3-4 weeks tenant-placement turnaround); 2,111 units permitted in Broward County in 2024 (1,265 in 5+ unit buildings).
- This rent runs 34% of the median local income ($71k/yr) — at the standard rent-burdened threshold; future hikes will face affordability resistance.
Forward outlook
- Local home prices are declining (-3.0%/yr); year-one equity from $823 of loan paydown is wiped out by about $4k of value loss. Plan a longer hold.
- Broward County population projected at +34% by 2050 — long-run rental-demand tailwind backs the buy-and-hold thesis.
- At projected returns (-3.0% appreciation + 1.8% rent growth), your $33k cash investment doubles in ~9 years — after that, you're playing with house money.
Negotiation context
- It's been on market 24 days — a 2% lower offer ($117k) is reasonable based on typical stale-listing flexibility.
- 6 sale attempts since 14y ago with the ask held roughly flat each time — persistent listings suggest the price (not the market) is what's stuck; bring a comps-based counter.
- Current owner paid $60k; list at $119k implies a 98% gain — meaningful room to come down on a strong offer.
Questions for the listing agent
- Built in 1968 — when were the roof, HVAC, electrical panel, plumbing, and water heater last replaced?
- What does the HOA fee cover, when was the last increase, and are there any pending special assessments or reserve-fund shortfalls?
- Any open or pending special assessments — roof, HVAC, plumbing, elevator, façade? What's the per-unit balance and payoff schedule, and is the seller paying it off at close or rolling it to the buyer?
- Is there a deadline driving the sale (1031 exchange, divorce, estate, relocation)? That informs how much negotiation room exists.
- Schools are D-rated, which usually means shorter tenancies and higher turnover. Who's the typical renter profile here, and what's been the actual vacancy rate?
- What's the average days-on-market for RENTAL listings here right now (not sales)? A rising rental-DOM trend means longer vacancies and softer asking-rent achievability than the comps imply.
- What's the recent tenant-quality profile in this submarket — average credit score on applications, eviction rate, late-payment / NSF rate, and stable-employment percentage? A property-management company in the area should have these aggregated.
- How much new apartment / multifamily construction is in the pipeline within 1–3 miles? Heavy new supply (>2% of stock underway) typically softens rents 12–24 months out; light construction supports rent growth.
Investment metrics
- 1% rule
- 1.69% ✓
- Cap rate
- 10.80%
- Cash-on-cash
- 16.09%
- DSCR
- 1.72
- GRM
- 4.9
CMA / ARV
No comps found within radius.
Projected returns pro-forma
-3.0% appreciation · 1.75% rent growth · sell at horizon
- IRR
- 5.4%
- Equity multiple
- 1.21×
- Total profit
- $6,896
- Equity at exit
- $17,743
- IRR
- 13.5%
- Equity multiple
- 2.01×
- Total profit
- $33,552
- Equity at exit
- $10,289
Cash invested: $33,320 (down + closing). Projections, not guarantees.
Landlord ↔ Tenant lean methodology
- Overall (STATE)
- 87 Strongly Landlord-Friendly
- State Florida
- 87 Strongly Landlord-Friendly · R+3
- County
- — inherits STATE
- City
- — inherits STATE
ZIP-level market 33064
- Home prices YoY
- -18.7%
- Rents YoY
- 1.8%
- Active inventory
- 597
- Price-to-rent
- 4.9×
Monthly cashflow live
- Estimated rent
- $2,016 high interval (Pro) →
- Mortgage (P&I)
- −$624
- Tax from tax record
- −$210 /mo · $2,514/yr
- Insurance
- −$50
- HOA
- −$263
- Vacancy / Maint / Mgmt
- −$423
- Net cashflow
- $447
Break-even live
Sensitivity live
| Price | -10% $514 | -5% $480 | +0% $447 | +5% $413 | +10% $379 |
|---|---|---|---|---|---|
| Rent | -10% $287 | -5% $367 | +0% $447 | +5% $526 | +10% $606 |
| Rate | -1.0pp $507 | -0.5pp $477 | base $447 | +0.5pp $416 | +1.0pp $385 |
UW: 25.0% down · 7.5% · 30yr · 1.5% tax · 5.0% vac · 8.0% maint · 8.0% mgmt
Financing live
Cash to close
- Down payment
- $29,750
- Closing costs
- $3,570
- Reserves months
- —
- Total cash needed
- —
Loan-product check · same deal, 3 products live
Conventional
25% down · 7.5% · 30yr
- Down + closing
- —
- Monthly P&I
- —
- Monthly cashflow
- —
- DSCR
- —
- Eligible?
- —
Personal DTI + credit; lowest rate.
DSCR
20% down · 8.5% · 30yr
- Down + closing
- —
- Monthly P&I
- —
- Monthly cashflow
- —
- DSCR
- —
- Eligible?
- —
No personal income docs; deal must DSCR.
Hard money
10% down · 12.0% · 12mo
- Down + closing
- —
- Monthly P&I
- —
- Monthly cashflow
- —
- DSCR
- —
- Eligible?
- —
Short-term bridge; refi at stabilization.
Rent comps 40 comps
| Address | Beds | Baths | Sqft | Rent | $/sqft | DOM | Units | Dist |
|---|---|---|---|---|---|---|---|---|
| 2751 E Golf Blvd #2018 Pompano Beach, FL | 2.0 | 2.0 | 825 | $1,800 | $2.18 | 25d | 1 | 0.06mi |
| 201 S Golf Blvd #298 Pompano Beach, FL | 2.0 | 1.0 | 750 | $1,600 | $2.13 | 16d | 1 | 0.16mi |
| 201 S Golf Blvd #2004 Pompano Beach, FL | 2.0 | 1.0 | 820 | $1,700 | $2.07 | 25d | 1 | 0.16mi |
| 300 NW 30th Ct #202 Pompano Beach, FL | 1.0 | 1.0 | 633 | $1,650 | $2.61 | 25d | 1 | 0.22mi |
| 3050 NW 1st Ave Pompano Beach, FL | 2.0 | 1.0 | 1044 | $1,800 | $1.72 | 25d | 1 | 0.22mi |
| 251 S Golf Blvd #294 Pompano Beach, FL | 2.0 | 2.0 | 825 | $2,100 | $2.55 | 13d | 1 | 0.23mi |
| 251 S Golf Blvd #294 Pompano Beach, FL | 2.0 | 2.0 | 825 | $2,400 | $2.91 | 25d | 1 | 0.23mi |
| 111 NW 31st Ct Pompano Beach, FL | 2.0 | 1.0 | 874 | $1,995 | $2.28 | 25d | 1 | 0.27mi |
| 220 Leisure Blvd Pompano Beach, FL | 2.0 | 1.0 | 1046 | $2,200 | $2.10 | 25d | 1 | 0.33mi |
| 3109 NW 2nd Ter Unit 4-156 Pompano Beach, FL | 1.0 | 1.0 | 680 | $1,600 | $2.35 | 16d | 1 | 0.34mi |
| 3109 NW 2nd Ter Unit 4-156 Pompano Beach, FL | 1.0 | 1.0 | 680 | $1,600 | $2.35 | 25d | 1 | 0.34mi |
| 3000 NW 5th Ter #129 Pompano Beach, FL | 2.0 | 2.0 | 912 | $2,000 | $2.19 | 25d | 1 | 0.38mi |
| 2501 W Golf Blvd Pompano Beach, FL | 1.0 | 1.0 | 600 | $1,375 | $2.29 | 25d | 1 | 0.42mi |
| 3005 NW 5th Ter #2 Pompano Beach, FL | 2.0 | 1.0 | 968 | $2,100 | $2.17 | 25d | 1 | 0.43mi |
| 3281 E Golf Blvd #12 Pompano Beach, FL | 2.0 | 1.0 | 1020 | $2,200 | $2.16 | 25d | 1 | 0.44mi |
| 231 NE 24th St Unit 1 Pompano Beach, FL | 2.0 | 1.0 | 750 | $2,250 | $3.00 | 0d | 1 | 0.45mi |
| 3281 E Golf Blvd #4 Pompano Beach, FL | 2.0 | 1.5 | 1020 | $2,200 | $2.16 | 25d | 1 | 0.45mi |
| 250 W Sample Rd Pompano Beach, FL | 1.0–2.0 | 1.0–2.0 | 900 | $2,150 | $2.39 | 25d | 1 | 0.49mi |
| 401 NW 34th St Pompano Beach, FL | 2.0 | 1.0–1.5 | 704 | $2,294 | $3.26 | 3d | 16 | 0.55mi |
| 3550 NW 8th Ave Pompano Beach, FL | 2.0 | 1.5 | 765 | $1,775 | $2.32 | 16d | 4 | 0.67mi |
| 521 NW 35th Ct Unit D Pompano Beach, FL | 1.0 | 1.0 | 600 | $1,525 | $2.54 | 25d | 1 | 0.68mi |
| 3421 NE 5th Ave Unit A Pompano Beach, FL | 2.0 | 1.0 | 970 | $2,500 | $2.58 | 25d | 1 | 0.73mi |
| 2001 NE 2nd Ter Pompano Beach, FL | 3.0 | 2.0 | 999 | $3,000 | $3.00 | 25d | 1 | 0.78mi |
| 2550 NE 7th Ter Pompano Beach, FL | 2.0 | 1.0 | 893 | $2,445 | $2.74 | 0d | 1 | 0.80mi |
| 858 Crystal Lake Dr #858 Pompano Beach, FL | 2.0 | 2.0 | 987 | $2,200 | $2.23 | 25d | 1 | 0.97mi |
| 3180 NE 10th Ter Pompano Beach, FL | 2.0 | 1.0 | 991 | $2,700 | $2.72 | 25d | 1 | 1.08mi |
| 941 Crystal Lake Dr #302 Deerfield Beach, FL | 2.0 | 2.0 | 882 | $1,890 | $2.14 | 16d | 1 | 1.09mi |
| 1101 NE 23rd Pl Unit 1 Pompano Beach, FL | 3.0 | 2.0 | 1117 | $3,000 | $2.69 | 25d | 1 | 1.11mi |
| 3300 NE 10th Ter Pompano Beach, FL | 1.0 | 1.0 | 674 | $1,525 | $2.26 | 16d | 1 | 1.11mi |
| 3901 NW 9th Ave Deerfield Beach, FL | 2.0 | 2.0 | 800 | $1,995 | $2.49 | 25d | 1 | 1.12mi |
| 2797 NE 12th Ave Pompano Beach, FL | 2.0 | 1.0 | 817 | $2,740 | $3.35 | 9d | 1 | 1.13mi |
| 145 NW 41st Ct #11 Deerfield Beach, FL | 3.0 | 1.5 | 1004 | $2,490 | $2.48 | 21d | 1 | 1.13mi |
| 1021 Crystal Lake Dr #203 Deerfield Beach, FL | 2.0 | 2.0 | 890 | $1,800 | $2.02 | 16d | 1 | 1.14mi |
| 1100 Crystal Lake Dr #207 Deerfield Beach, FL | 1.0 | 1.0 | 660 | $1,900 | $2.88 | 25d | 1 | 1.15mi |
| 2933 NE 12th Ter Pompano Beach, FL | 2.0 | 1.0 | 824 | $2,700 | $3.28 | 25d | 1 | 1.17mi |
| 1101 Crystal Lake Dr #203 Deerfield Beach, FL | 2.0 | 2.0 | 930 | $2,200 | $2.37 | 25d | 1 | 1.17mi |
| 331 NW 42nd Ct Unit 101 Pompano Beach, FL | 2.0 | 1.0 | 800 | $1,799 | $2.25 | 16d | 1 | 1.19mi |
| 3500 Blue Lake Dr #101 Pompano Beach, FL | 1.0 | 1.5 | 850 | $1,900 | $2.24 | 25d | 1 | 1.20mi |
| 311 NW 42nd Ct #101 Deerfield Beach, FL | 2.0 | 1.0 | 800 | $1,799 | $2.25 | 25d | 1 | 1.20mi |
| 3400 Blue Lake Dr Pompano Beach, FL | 2.0 | 2.0 | 1039 | $2,288 | $2.20 | 25d | 2 | 1.20mi |
HOA detail condo
- Monthly dues
- $263 · $3,156/yr
- Likely covers
- pool
- Assessments
- None detected in remarks — confirm with the listing agent.
Listing history 31 events
-
2026-06-21days on market $119,000 Active 24 DOM
-
2026-06-18days on market $119,000 Active 21 DOM
-
2026-06-17days on market $119,000 Active 20 DOM
-
2026-06-16days on market $119,000 Active 19 DOM
-
2026-06-15days on market $119,000 Active 18 DOM
-
2026-06-13days on market $119,000 Active 16 DOM
-
2026-06-09days on market $119,000 Active 12 DOM
-
2026-06-08days on market $119,000 Active 11 DOM
-
2026-06-07days on market $119,000 Active 10 DOM
-
2026-06-04days on market $119,000 Active 7 DOM
-
2026-06-03days on market $119,000 Active 6 DOM
-
2026-06-02days on market $119,000 Active 5 DOM
-
2026-06-01days on market $119,000 Active 4 DOM
-
2026-05-31days on market $119,000 Active 3 DOM
-
2026-05-28$119,000 Active
-
2026-03-27historical
-
2025-10-29$110,000 Active
-
2023-12-20historical
-
2023-07-21$135,000 Active
-
2023-07-10historical
-
2023-01-11$135,000 Active
-
2018-01-26soldstatus $60,200
-
2014-03-03historical
-
2014-02-28soldstatus $37,000 Closed
-
2014-02-14status Pending
-
2014-01-13$45,000 Active
-
2012-09-18historical
-
2012-04-30$37,500
-
1987-08-31soldstatus $37,000
-
1987-08-01soldstatus $37,000
-
1973-05-01soldstatus $22,000
ⓘ Source: listings_history table (triggers on properties + properties_extension) + one-shot
backfill from property_details.listing_events for pre-trigger history.
Tax reassessment forecast FL · Resets to sale price
- Current annual tax
- $2,514 · $210/mo
- Projected year-2 tax
- $2,514 · $210/mo
- Expected delta
- $0/yr ($0/mo · 0.0%)
ⓘ Screening estimate from a state-policy table — verify with the county assessor before closing.
Nearby sold comps map
Loading sold comps map…
Walkable amenities ~0.75 mi
Loading nearby amenities…
Taxation est. · year 1
- Rental income
- $24,196
- − Mortgage interest
- −$6,666
- − Property taxes
- −$2,514
- − Insurance
- −$595
- − Repairs & maintenance
- −$1,936
- − Management
- −$1,936
- − HOA
- −$3,156
- − Depreciation
- −$3,462
- Taxable income
- $3,932
- Est. tax owed @ 24.0%
- −$944
- After-tax cash flow
- $4,417/yr
For passive investors: Depreciation is non-cash, so a rental often shows a tax loss while cash-flowing — sheltering income. Rental losses are passive: they offset passive income freely, and up to $25,000/yr can offset ordinary (W-2) income if you actively participate and your MAGI is under $100k (phasing out to $0 by $150k); unused losses carry forward. On sale, claimed depreciation is recaptured at up to 25%, and gains may owe capital-gains tax (a 1031 exchange can defer both). Figures are a year-1 estimate at your 24.0% rate — not tax advice; consult a CPA.
Schools (NCES district)
- District
- Broward
- NCES district ID
- 1200180
- Math proficiency
- 42% ▼ -18.00%
- Reading proficiency
- 53% ▼ -5.00%
- Median HH income
- $52,139
- Composite
- 40.88/100
- National rank
- #3621
- State rank
- #46 of 73 in FL
Livability — Pompano Beach
- Score
- 74/100
- State rank
- #284
- US rank
- #4541
Category grades
Schools grade is shown separately in the Schools card above.
Census & demographics
- Census place
- Pompano Beach, FL
- County
- Broward County · 1,963,430 people
- City population
- 155,861
- Metro
- Miami-Fort Lauderdale-Pompano Beach, FL
- Population (ZIP)
- 64,563
- Household income
- $71,301
- Rent vs Own
- Severe rent burden
- 2907.0
Population outlook (Broward County) Hauer SSP2
- Today (2025)
- 2,207,033 people
- By 2030
- 2,360,704 · +7.0%
- By 2040
- 2,661,208 · +20.6%
- By 2050
- 2,946,698 · +33.5%
- By 2075
- 3,602,273 · +63.2%
- By 2100
- 3,970,984 · +79.9%
Race, ethnicity, and origin ACS 2023
- Neighborhood character
- Highly diverse neighborhood (Simpson 0.75)
- Race & ethnicity
- White 34% Hispanic / Latino 27% Black 25% Two or more races 24% Asian 2%
- Hispanic origin (detail)
- Mexican 4% Puerto Rican 4% Cuban 4% Dominican 2%
- Common ancestry
- Hispanic 13% Estonian 10% Romanian 1%
- Foreign-born
- 43% · Canada, Jamaica, Dominican Republic
- Languages at home
- 45% English-only · Spanish 23% French/Haitian/Cajun 16% Other Indo-European 13%
Political lean MEDSL · Broward
- 2024 margin
- D (+17.0) · D 58.0% · R 41.0%
- 2008→2024 swing
- -17.8pp toward R · 2008: 34.7pp · 2024: 17.0pp
- All cycles
- 2024: D+17.0 2020: D+29.8 2016: D+35.0 2012: D+34.9 2008: D+34.7
Not yet ingested
- Civics
- —
Market trends
- HPI YoY
- ▼ -109.09%
- Current HPI
- 474.7007
- Rent YoY
- ▲ 1.75%
- Metro
- Miami-Fort Lauderdale-Pompano Beach, FL
- State GDP YoY
- ▲ 3.28%
- F500 in state
- 36
Industry mix (Fortune 500 HQ in FL)
| Industry | F500 HQs | Revenue |
|---|---|---|
| Industrial Technology | 2 | $29B |
|
||
| Insurance | 2 | $17B |
|
||
| Retail | 1 | $60B |
|
||
| Technology Distribution | 1 | $58B |
|
||
| Homebuilding | 1 | $35B |
|
||
| Technology Manufacturing | 1 | $35B |
|
||
Price history
+440.9% since first listed17 events — show timeline
- 2026-05-28 Listed $119,000 Beaches MLS
- 2026-03-27 Listing Removed — Beaches MLS
- 2025-10-29 Listed $110,000 Beaches MLS
- 2023-12-20 Listing Removed — MARMLS
- 2023-07-21 Listed $135,000 MARMLS
- 2023-07-10 Listing Removed — MARMLS
- 2023-01-11 Listed $135,000 MARMLS
- 2018-01-26 Sold (Public Records) $60,200 Public Records
- 2014-03-03 Listing Removed — Beaches MLS
- 2014-02-28 Sold (MLS) $37,000 Beaches MLS
- 2014-02-14 Pending — Beaches MLS
- 2014-01-13 Listed $45,000 Beaches MLS
- 2012-09-18 Listing Removed — Beaches MLS
- 2012-04-30 Listed $37,500 Beaches MLS
- 1987-08-31 Sold (Public Records) $37,000 Public Records
- 1987-08-01 Sold (Public Records) $37,000 Public Records
- 1973-05-01 Sold (Public Records) $22,000 Public Records
Property tax history
+10.6%/yrLatest (2025): $2,514 · +6.4% YoY. Source: county tax records.
Cash-flow waterfall
monthlySold comps — $/sqft
last 12 mo · ≤1 miLoading sold comps…