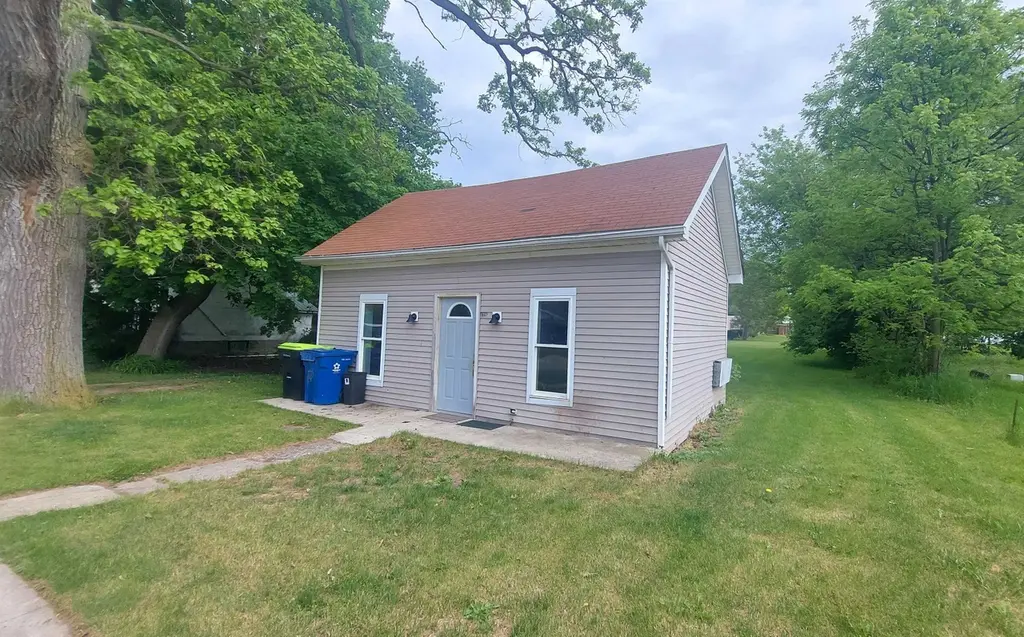
4326 Beach St · Akron, MI
Flood risk 1/10 · Minimal
- FEMA flood zone
- X (unshaded)
- Chance of flooding over 30 yrs
- 0.0%
- Est. flood insurance / yr
- $473 – $860
Fire risk 1/10 · Minimal
- Est. fire insurance / yr
- $784 – $1,456
Heat risk 2/10 · Minimal
- Hot days now (above 98°F)
- 7 days/yr
- Hot days in 30 yrs
- 14 days/yr
Wind risk 1/10 · Minimal
- Chance of severe wind over 30 yrs
- —
Air-quality risk 2/10 · Minimal
- Unhealthy air days now
- 1 days/yr
- Unhealthy air days in 30 yrs
- 2 days/yr
Risk factors via First Street. Map © Google.
Why this score? — see what drove the B+ grade
The composite is a weighted blend of 9 inputs, each scored 0–100. Each bar is that input's sub-score; the figure is the points it added to the 100-point composite (weight × sub-score).
- Cash flow +30.0/30.0
- ARV discount +12.5/15.0
- 1% rule +10.0/10.0
- DSCR +10.0/10.0
- Appreciation +5.4/10.0
- Livability +3.4/5.0
- Schools +3.2/10.0
- Rent growth +2.5/5.0
- Condition / age +2.5/5.0
$52,000
🖨 Deal sheet 📄 Offer letter ✓ Due diligence
Listing remarks MLS
Attention investors! Don't pass this one up. Renovations have been started. About half the home is down to the studs. Lots of potential. Sits on a nice sized lot, 1/4 of an acre in the Village of Akron. This property was acquired at tax sale and is heavily discounted. Listing and Pricing reflects sale and transfer via quit claim deed (QCD) only. All buyers are required to conduct their own due diligence.
Key facts
- Village amenities
- Outdoor space
- Oversized lot
Tags
Property features AI
Finance
- Other: Property type: Residential; Lot size about 0.25 acre; approximately 75 ft frontage; Roads: country and paved street
Exterior
- Parking: Road frontage
- Utilities: Public water; Public sanitary sewer; Gas water heater; Natural gas; Electric heat
- Home design: Residential single-story home; Built in 1890; Below-grade finished area: none; below-grade area roughly 400
- Construction: Vinyl siding construction; Block basement and crawlspace foundation; Original construction year 1890
- Exterior features: Vinyl siding; Rural setting; Walkable to school; Large lot (65+ ft. frontage)
Interior
- Kitchen: Kitchen on the first floor (about 8 x 5) with vinyl flooring; Range/Oven, Refrigerator, Freezer
- Bedrooms: Primary bedroom on the first floor, about 10 x 19 with carpet
- Flooring: Carpet in living room and primary bedroom; Vinyl in kitchen, dining room, bathroom and laundry room
- Bathrooms: 1 full bathroom on the first floor (approx. 7 x 6) with vinyl flooring
- Heating & cooling: Electric heating system; Natural gas fuel available
- Interior features: Freezer; Range/Oven; Refrigerator; Basement (block); Has basement
- Laundry & utility: Laundry room on the first floor with vinyl flooring; Gas water heater
Neighborhood map
What this means for you Summary
Snapshot
- This is a 1-bed/1.0-bath single-family listed at $52k.
Deal economics
- At list price, monthly cash flow is $318 ($4k/yr) — positive.
- The deal already cash-flows at list — no discount required.
- Meets the 1% rule at list price ($841 rent vs $52k).
Location & tenants
- Location reads 67/100 on livability (#398 in MI) — a middle-class / working-renter tenant base. Strengths: crime A+, cost of living A+, housing A+; Watch: health & safety C-, schools D+, employment D+.
- Akron-Fairgrove Schools (rural): math 35% / reading 35% proficiency, ranked #464 of 760 in MI (top 61%) — families likely to look elsewhere, expect single-tenant / working-renter base with shorter leases.
- Market conditions: 6 active listings in the ZIP; 56 units permitted in Tuscola County in 2024 (0 in 5+ unit buildings).
Forward outlook
- In year one you build about $827 of equity ($360 loan paydown + $467 appreciation (0.9% local appreciation)).
- Tuscola County population projected at -29% by 2050 — secular population decline; favor cash flow + early exit over multi-decade hold.
- At projected returns (0.9% appreciation + 3.0% rent growth), your $15k cash investment doubles in ~3 years — after that, you're playing with house money.
Negotiation context
- Only 9 days on market — expect competitive offers; lowballing is unlikely to land.
- 2 sale attempts since 15y ago with the ask held roughly flat each time — persistent listings suggest the price (not the market) is what's stuck; bring a comps-based counter.
- Current owner paid $4k; list at $52k implies a 1200% gain — meaningful room to come down on a strong offer.
Risks & watch-outs
- Watch-outs: built in 1890 — expect roof / HVAC / electrical / plumbing capex.
Questions for the listing agent
- Built in 1890 — when were the roof, HVAC, electrical panel, plumbing, and water heater last replaced?
- Is there a deadline driving the sale (1031 exchange, divorce, estate, relocation)? That informs how much negotiation room exists.
- Schools are D-rated, which usually means shorter tenancies and higher turnover. Who's the typical renter profile here, and what's been the actual vacancy rate?
- What's the average days-on-market for RENTAL listings here right now (not sales)? A rising rental-DOM trend means longer vacancies and softer asking-rent achievability than the comps imply.
- What's the recent tenant-quality profile in this submarket — average credit score on applications, eviction rate, late-payment / NSF rate, and stable-employment percentage? A property-management company in the area should have these aggregated.
- How much new for-sale + rental construction is in the pipeline within 1–3 miles? Heavy new supply typically softens prices + rents 12–24 months out; constrained supply supports both.
Investment metrics
- 1% rule
- 1.62% ✓
- Cap rate
- 13.63%
- Cash-on-cash
- 26.19%
- DSCR
- 2.17
- GRM
- 5.2
CMA / ARV
- ARV (on-the-fly)
- $58,504
- Comps found
- 1
Show comp detail 1 sale within ~0.75 mi
| Address | Dist | Beds/Ba | Sqft | Sold | Price | $/sf | Match |
|---|---|---|---|---|---|---|---|
| 4297 Center St | 0.15mi | 2/1.0 (+1) | 850 (+3%) | 10mo | $60,000 | $71 | 75 |
Match score weights: distance 35% · size 25% · config 20% · recency 20%. Top-matched comps best support the ARV.
Projected returns pro-forma
0.9% appreciation · 3.0% rent growth · sell at horizon
- IRR
- 28.2%
- Equity multiple
- 2.44×
- Total profit
- $20,954
- Equity at exit
- $17,475
- IRR
- 30.9%
- Equity multiple
- 4.69×
- Total profit
- $53,770
- Equity at exit
- $23,011
Cash invested: $14,560 (down + closing). Projections, not guarantees.
Landlord ↔ Tenant lean methodology
- Overall (STATE)
- 62 Landlord-Friendly
- State Michigan
- 62 Landlord-Friendly · EVEN
- County
- — inherits STATE
- City
- — inherits STATE
ZIP-level market 48701
- Home prices YoY
- 0.5%
- Active inventory
- 6
- Price-to-rent
- 5.2×
Monthly cashflow live
- Estimated rent
- $841 medium interval (Pro) →
- Mortgage (P&I)
- −$273
- Tax from tax record
- −$52 /mo · $626/yr
- Insurance
- −$22
- HOA
- −$0
- Vacancy / Maint / Mgmt
- −$177
- Net cashflow
- $318
Break-even live
UW: 25.0% down · 7.5% · 30yr · 1.5% tax · 5.0% vac · 8.0% maint · 8.0% mgmt
Financing live
Cash to close
- Down payment
- $13,000
- Closing costs
- $1,560
- Reserves months
- —
- Total cash needed
- —
Loan-product check · same deal, 3 products live
Conventional
25% down · 7.5% · 30yr
- Down + closing
- —
- Monthly P&I
- —
- Monthly cashflow
- —
- DSCR
- —
- Eligible?
- —
Personal DTI + credit; lowest rate.
DSCR
20% down · 8.5% · 30yr
- Down + closing
- —
- Monthly P&I
- —
- Monthly cashflow
- —
- DSCR
- —
- Eligible?
- —
No personal income docs; deal must DSCR.
Hard money
10% down · 12.0% · 12mo
- Down + closing
- —
- Monthly P&I
- —
- Monthly cashflow
- —
- DSCR
- —
- Eligible?
- —
Short-term bridge; refi at stabilization.
Listing history 8 events
-
2026-06-19days on market $52,000 Active 9 DOM
-
2026-06-18days on market $52,000 Active 8 DOM
-
2026-06-17days on market $52,000 Active 7 DOM
-
2026-06-16days on market $52,000 Active 6 DOM
-
2026-06-15days on market $52,000 Active 5 DOM
-
2026-06-14days on market $52,000 Active 3 DOM
-
2026-06-12remarks 567-char remark
-
2026-06-12$52,000 Active 2 DOM
ⓘ Source: listings_history table (triggers on properties + properties_extension) + one-shot
backfill from property_details.listing_events for pre-trigger history.
Tax reassessment forecast MI · Partial reset (capped growth)
- Current annual tax
- $626 · $52/mo
- Projected year-2 tax
- $713 · $59/mo
- Expected delta
- +$87/yr (+$7/mo · 14.0%)
ⓘ Screening estimate from a state-policy table — verify with the county assessor before closing.
Climate risk First Street
- Flood 1/10 Low FEMA zone X (unshaded) · 0% chance over 30 yrs
- Wildfire 1/10 Low
- Heat 2/10 Low 7 d/yr ≥98°F today · 14 d/yr by 30 yrs out
- Wind 1/10 Low
- Air quality 2/10 Low 1 unhealthy d/yr today · 2 by 30 yrs out
Nearby sold comps map
Loading sold comps map…
Walkable amenities ~0.75 mi
Loading nearby amenities…
Taxation est. · year 1
- Rental income
- $10,090
- − Mortgage interest
- −$2,913
- − Property taxes
- −$626
- − Insurance
- −$260
- − Repairs & maintenance
- −$807
- − Management
- −$807
- − Depreciation
- −$1,513
- Taxable income
- $3,164
- Est. tax owed @ 24.0%
- −$759
- After-tax cash flow
- $3,053/yr
For passive investors: Depreciation is non-cash, so a rental often shows a tax loss while cash-flowing — sheltering income. Rental losses are passive: they offset passive income freely, and up to $25,000/yr can offset ordinary (W-2) income if you actively participate and your MAGI is under $100k (phasing out to $0 by $150k); unused losses carry forward. On sale, claimed depreciation is recaptured at up to 25%, and gains may owe capital-gains tax (a 1031 exchange can defer both). Figures are a year-1 estimate at your 24.0% rate — not tax advice; consult a CPA.
Schools (NCES district)
- District
- Akron-Fairgrove Schools
- NCES district ID
- 2602010
- Math proficiency
- 35% ▲ 10.00%
- Reading proficiency
- 35% ▬ 0.00%
- Median HH income
- $40,975
- Composite
- 32.12/100
- National rank
- #10981
- State rank
- #464 of 760 in MI
Livability — Akron
- Score
- 67/100
- State rank
- #398
- US rank
- #10776
Category grades
Schools grade is shown separately in the Schools card above.
Census & demographics
- Census place
- Akron, MI
- Population (ZIP)
- 1,364
Population outlook (Tuscola County) Hauer SSP2
- Today (2025)
- 49,930 people
- By 2030
- 47,294 · -5.3%
- By 2040
- 41,504 · -16.9%
- By 2050
- 35,560 · -28.8%
- By 2075
- 24,455 · -51.0%
- By 2100
- 16,507 · -66.9%
Race, ethnicity, and origin ACS 2023
- Neighborhood character
- Predominantly White (87%)
- Race & ethnicity
- White 87% Two or more races 6% Native American 5% Hispanic / Latino 3%
- Common ancestry
- Romanian 9% Lithuanian 5% Slovak 3%
- Foreign-born
- 1%
- Languages at home
- 98% English-only · Spanish 1%
Political lean MEDSL · Tuscola
- 2024 margin
- Solid R (+43.0) · D 27.9% · R 70.9% · Other 1.3%
- 2008→2024 swing
- -42.1pp toward R · 2008: -0.8pp · 2024: -43.0pp
- All cycles
- 2024: R+43.0 2020: R+39.3 2016: R+38.0 2012: R+10.8 2008: R+0.8
Not yet ingested
- Civics
- —
Market trends
- HPI YoY
- ▲ 0.90%
- Current HPI
- 186.291
- Rent YoY
- —
- Metro
- —
- State GDP YoY
- ▲ 1.37%
- F500 in state
- 28
Industry mix (Fortune 500 HQ in MI)
| Industry | F500 HQs | Revenue |
|---|---|---|
| Automotive Parts | 3 | $48B |
|
||
| Automotive | 2 | $372B |
|
||
| Chemicals | 1 | $45B |
|
||
| Automotive Retail | 1 | $29B |
|
||
| Healthcare / Medical Devices | 1 | $23B |
|
||
| Automotive Technology | 1 | $20B |
|
||
Price history
+285.2% since first listed5 events — show timeline
- 2026-06-08 Listed $52,000 MiRealSource-MiMLS
- 2012-06-25 Sold (MLS) $4,000 MiRealSource-MiMLS
- 2012-06-11 Listing Removed — MiRealSource-MiMLS
- 2011-11-23 Listed $5,000 MiRealSource-MiMLS
- 2000-05-27 Sold (Public Records) $13,500 Public Records
Property tax history
+2.3%/yrLatest (2025): $626 · +35.2% YoY. Source: county tax records.
Cash-flow waterfall
monthlySold comps — $/sqft
last 12 mo · ≤1 miLoading sold comps…