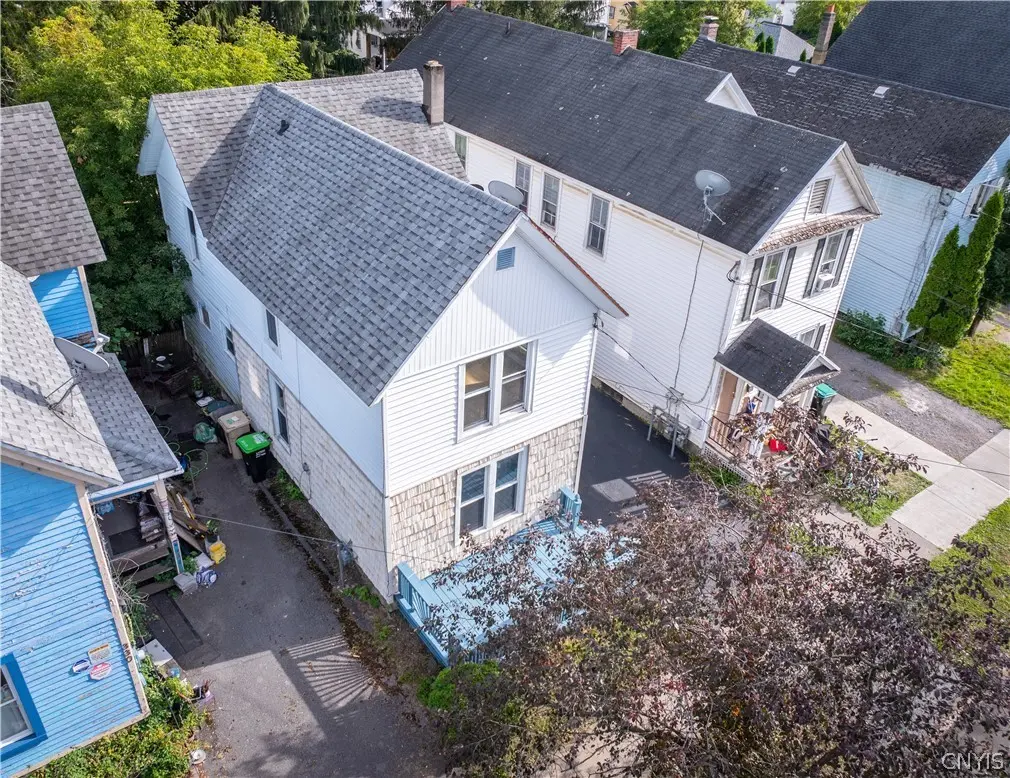
328 Pleasant Ave · Herkimer, NY
Flood risk 3/10 · Minor
- FEMA flood zone
- X (unshaded)
- Chance of flooding over 30 yrs
- 0.2%
- Est. flood insurance / yr
- $473 – $860
Fire risk 1/10 · Minimal
- Est. fire insurance / yr
- $691 – $1,283
Heat risk 3/10 · Minor
- Hot days now (above 98°F)
- 7 days/yr
- Hot days in 30 yrs
- 17 days/yr
Wind risk 2/10 · Minimal
- Chance of severe wind over 30 yrs
- 1.0%
Air-quality risk 1/10 · Minimal
- Unhealthy air days now
- 0 days/yr
- Unhealthy air days in 30 yrs
- 0 days/yr
Risk factors via First Street. Map © Google.
Why this score? — see what drove the C+ grade
The composite is a weighted blend of 9 inputs, each scored 0–100. Each bar is that input's sub-score; the figure is the points it added to the 100-point composite (weight × sub-score).
- Cash flow +26.4/30.0
- Appreciation +10.0/10.0
- DSCR +9.0/10.0
- 1% rule +7.2/10.0
- Schools +3.9/10.0
- Livability +3.6/5.0
- Rent growth +2.5/5.0
- Condition / age +2.5/5.0
- ARV discount +0.0/15.0
$139,900
🖨 Deal sheet 📄 Offer letter ✓ Due diligence
Listing remarks MLS
Welcome to 328 Pleasant Ave in the heart of Herkimer! This charming 2-story home features 4 spacious bedrooms and 1 full bathroom, offering plenty of room for comfortable living. Centrally located, this property puts you just minutes from local shops, restaurants, schools, and businesses, making everyday errands and activities a breeze. With its classic layout, convenient location, and potential to make it your own, this home is a fantastic opportunity for anyone looking to settle in a friendly neighborhood right in the center of town. Don’t miss your chance to own a home in this desirable location!
Key facts
- Built 1890
- Listed 71 days
Neighborhood map
What this means for you Summary
Snapshot
- This is a 4-bed/1.0-bath single-family listed at $140k.
Deal economics
- At list price, monthly cash flow is $366 ($4k/yr) — positive.
- The deal already cash-flows at list — no discount required.
- Meets the 1% rule at list price ($2k rent vs $140k).
- Recommended offer: $132k (6.0% below list) — sets the bar for market timing.
- Cap rate 9.4% vs local median 5.5% in Herkimer — top-decile yield for the area; either an underpriced asset or a hidden risk that comps aren't pricing in. Stress-test before assuming the spread holds.
Location & tenants
- Location reads 71/100 on livability (#392 in NY) — a middle-class / working-renter tenant base. Strengths: cost of living A+, housing A+, health & safety A+; Watch: schools D+, amenities D+, crime D.
- Herkimer Central School District (town): math 46% / reading 47% proficiency, ranked #455 of 590 in NY (top 77%) — families likely to look elsewhere, expect single-tenant / working-renter base with shorter leases.
- Market conditions: 56 active listings in the ZIP; 1 comparable units currently listed for rent nearby; 54 units permitted in Herkimer County in 2024 (0 in 5+ unit buildings).
Forward outlook
- In year one you build about $15k of equity ($967 loan paydown + $14k appreciation (10.0% local appreciation)).
- Herkimer County population projected at -24% by 2050 — secular population decline; favor cash flow + early exit over multi-decade hold.
- At projected returns (10.0% appreciation + 3.0% rent growth), your $39k cash investment doubles in ~2 years — after that, you're playing with house money.
- By year 3, paydown + projected appreciation supports a ~$38k cash-out refi (75% LTV) — recoverable capital for the next deal without selling this one.
Negotiation context
- It's been on market 71 days — a 6% lower offer ($132k) is reasonable based on typical stale-listing flexibility.
- 3 sale attempts since 10y ago with the ask held roughly flat each time — persistent listings suggest the price (not the market) is what's stuck; bring a comps-based counter.
- Current owner paid $36k; list at $140k implies a 289% gain — meaningful room to come down on a strong offer.
Risks & watch-outs
- Watch-outs: built in 1890 — expect roof / HVAC / electrical / plumbing capex.
Questions for the listing agent
- It's been on market 71 days. Have you received any prior offers? Is the seller open to a 6% concession, seller financing, or rate buy-down credit?
- Built in 1890 — when were the roof, HVAC, electrical panel, plumbing, and water heater last replaced?
- Why hasn't it sold? Are there any deal-killer items the seller is aware of (foundation, flood, title, zoning, code violations)?
- Is there a deadline driving the sale (1031 exchange, divorce, estate, relocation)? That informs how much negotiation room exists.
- Schools are D-rated, which usually means shorter tenancies and higher turnover. Who's the typical renter profile here, and what's been the actual vacancy rate?
- Crime grade is D in this area — have there been break-ins, vandalism, or insurance claims at this property in the last 3 years? What carrier currently insures it and at what premium?
- What's the average days-on-market for RENTAL listings here right now (not sales)? A rising rental-DOM trend means longer vacancies and softer asking-rent achievability than the comps imply.
- What's the recent tenant-quality profile in this submarket — average credit score on applications, eviction rate, late-payment / NSF rate, and stable-employment percentage? A property-management company in the area should have these aggregated.
- How much new for-sale + rental construction is in the pipeline within 1–3 miles? Heavy new supply typically softens prices + rents 12–24 months out; constrained supply supports both.
Investment metrics
- 1% rule
- 1.22% ✓
- Cap rate
- 9.43%
- Cash-on-cash
- 11.22%
- DSCR
- 1.50
- GRM
- 6.9
CMA / ARV
- ARV (median comp)
- $114,257
- List price
- $139,900
- Delta
- 22.44%
- Verdict
- OVERPRICED
- Comps
- 20 within 1.0 mi
Show comp detail 12 sales within ~0.75 mi
| Address | Dist | Beds/Ba | Sqft | Sold | Price | $/sf | Match |
|---|---|---|---|---|---|---|---|
| 352 Eureka Ave | 0.06mi | 3/1.5 (-1) | 1,386 (-6%) | 12mo | $110,000 | $79 | 70 |
| 334 Gray St | 0.49mi | 4/1.5 | 1,536 (+4%) | 10mo | $201,400 | $131 | 60 |
| 344 Eastern Ave | 0.07mi | 3/2.0 (-1) | 1,688 (+15%) | 7mo | $150,000 | $89 | 57 |
| 111 E German St | 0.69mi | 3/1.5 (-1) | 1,456 (-1%) | 3mo | $190,000 | $130 | 57 |
| 171 Main Rd | 0.63mi | 4/1.0 | 1,568 (+6%) | 5mo | $146,000 | $93 | 55 |
| 401 Harter St | 0.60mi | 3/2.0 (-1) | 1,520 (+3%) | 5mo | $193,000 | $127 | 54 |
| 318 Gray St | 0.46mi | 3/1.0 (-1) | 1,316 (-11%) | 11mo | $145,500 | $111 | 47 |
| 415 N Prospect St | 0.67mi | 4/2.5 | 1,608 (+9%) | 2mo | $103,000 | $64 | 46 |
| 310 E German St | 0.66mi | 4/1.0 | 1,624 (+10%) | 11mo | $150,000 | $92 | 43 |
| 308 West St | 0.72mi | 4/2.0 | 1,324 (-10%) | 8mo | $214,000 | $162 | 39 |
| 101 East St | 0.74mi | 3/1.0 (-1) | 1,350 (-8%) | 12mo | $130,000 | $96 | 36 |
| 501 Park Ave | 0.72mi | 5/1.5 (+1) | 1,682 (+14%) | 7mo | $105,900 | $63 | 30 |
Match score weights: distance 35% · size 25% · config 20% · recency 20%. Top-matched comps best support the ARV.
Projected returns pro-forma
10.0% appreciation · 3.0% rent growth · sell at horizon
- IRR
- 32.5%
- Equity multiple
- 3.54×
- Total profit
- $99,549
- Equity at exit
- $126,033
- IRR
- 28.1%
- Equity multiple
- 8.02×
- Total profit
- $274,876
- Equity at exit
- $271,795
Cash invested: $39,172 (down + closing). Projections, not guarantees.
Landlord ↔ Tenant lean methodology
- Overall (STATE)
- 15 Strongly Tenant-Friendly
- State New York
- 15 Strongly Tenant-Friendly · D+10
- County
- — inherits STATE
- City
- — inherits STATE
ZIP-level market 13350
- Home prices YoY
- 8.9%
- Active inventory
- 56
- Price-to-rent
- 6.9×
Monthly cashflow live
- Estimated rent
- $1,700 medium interval (Pro) →
- Mortgage (P&I)
- −$734
- Tax from tax record
- −$185 /mo · $2,218/yr
- Insurance
- −$58
- HOA
- −$0
- Vacancy / Maint / Mgmt
- −$357
- Net cashflow
- $366
Break-even live
UW: 25.0% down · 7.5% · 30yr · 1.5% tax · 5.0% vac · 8.0% maint · 8.0% mgmt
Financing live
Cash to close
- Down payment
- $34,975
- Closing costs
- $4,197
- Reserves months
- —
- Total cash needed
- —
Loan-product check · same deal, 3 products live
Conventional
25% down · 7.5% · 30yr
- Down + closing
- —
- Monthly P&I
- —
- Monthly cashflow
- —
- DSCR
- —
- Eligible?
- —
Personal DTI + credit; lowest rate.
DSCR
20% down · 8.5% · 30yr
- Down + closing
- —
- Monthly P&I
- —
- Monthly cashflow
- —
- DSCR
- —
- Eligible?
- —
No personal income docs; deal must DSCR.
Hard money
10% down · 12.0% · 12mo
- Down + closing
- —
- Monthly P&I
- —
- Monthly cashflow
- —
- DSCR
- —
- Eligible?
- —
Short-term bridge; refi at stabilization.
Rent comps 1 comps
| Address | Beds | Baths | Sqft | Rent | $/sqft | DOM | Units | Dist |
|---|---|---|---|---|---|---|---|---|
| 502 Lake St Herkimer, NY | 3.0 | 1.0 | 1125 | $1,700 | $1.51 | 43d | 1 | 0.79mi |
Listing history 23 events
-
2026-06-18days on market $139,900 Active 71 DOM
-
2026-06-17days on market $139,900 Active 70 DOM
-
2026-06-16days on market $139,900 Active 69 DOM
-
2026-06-15days on market $139,900 Active 68 DOM
-
2026-06-13days on market $139,900 Active 66 DOM
-
2026-06-12days on market $139,900 Active 65 DOM
-
2026-06-09days on market $139,900 Active 62 DOM
-
2026-06-08days on market $139,900 Active 61 DOM
-
2026-06-07days on market $139,900 Active 60 DOM
-
2026-06-07days on market $139,900 Active 59 DOM
-
2026-06-04days on market $139,900 Active 56 DOM
-
2026-06-02days on market $139,900 Active 55 DOM
-
2026-06-01days on market $139,900 Active 54 DOM
-
2026-05-31days on market $139,900 Active 53 DOM
-
2026-04-08$139,900 Active 612-char remark
Show marketing remark (612 chars)
Welcome to 328 Pleasant Ave in the heart of Herkimer! This charming 2-story home features 4 spacious bedrooms and 1 full bathroom, offering plenty of room for comfortable living. Centrally located, this property puts you just minutes from local shops, restaurants, schools, and businesses, making everyday errands and activities a breeze. With its classic layout, convenient location, and potential to make it your own, this home is a fantastic opportunity for anyone looking to settle in a friendly neighborhood right in the center of town. Don’t miss your chance to own a home in this desirable location!
-
2026-01-02historical
-
2025-11-24price $134,900
-
2025-11-04price $139,900
-
2025-09-22price $149,900
-
2025-08-20$159,900 Active
-
2018-06-18soldstatus $36,000
-
2016-10-04historical
-
2016-04-26$35,000
ⓘ Source: listings_history table (triggers on properties + properties_extension) + one-shot
backfill from property_details.listing_events for pre-trigger history.
Tax reassessment forecast NY · Partial reset (capped growth)
- Current annual tax
- $2,218 · $185/mo
- Projected year-2 tax
- $2,291 · $191/mo
- Expected delta
- +$73/yr (+$6/mo · 3.3%)
ⓘ Screening estimate from a state-policy table — verify with the county assessor before closing.
Climate risk First Street
- Flood 3/10 Moderate FEMA zone X (unshaded) · 20% chance over 30 yrs
- Wildfire 1/10 Low
- Heat 3/10 Moderate 7 d/yr ≥98°F today · 17 d/yr by 30 yrs out
- Wind 2/10 Low 100% chance of damaging wind over 30 yrs
- Air quality 1/10 Low 0 unhealthy d/yr today · 0 by 30 yrs out
Nearby sold comps map
Loading sold comps map…
Walkable amenities ~0.75 mi
Loading nearby amenities…
Taxation est. · year 1
- Rental income
- $20,400
- − Mortgage interest
- −$7,837
- − Property taxes
- −$2,218
- − Insurance
- −$700
- − Repairs & maintenance
- −$1,632
- − Management
- −$1,632
- − Depreciation
- −$4,070
- Taxable income
- $2,312
- Est. tax owed @ 24.0%
- −$555
- After-tax cash flow
- $3,840/yr
For passive investors: Depreciation is non-cash, so a rental often shows a tax loss while cash-flowing — sheltering income. Rental losses are passive: they offset passive income freely, and up to $25,000/yr can offset ordinary (W-2) income if you actively participate and your MAGI is under $100k (phasing out to $0 by $150k); unused losses carry forward. On sale, claimed depreciation is recaptured at up to 25%, and gains may owe capital-gains tax (a 1031 exchange can defer both). Figures are a year-1 estimate at your 24.0% rate — not tax advice; consult a CPA.
Schools (NCES district)
- District
- Herkimer Central School District
- NCES district ID
- 3614220
- Math proficiency
- 46% ▲ 6.00%
- Reading proficiency
- 47% ▲ 9.00%
- Median HH income
- $39,447
- Composite
- 38.87/100
- National rank
- #4100
- State rank
- #455 of 590 in NY
Livability — Herkimer
- Score
- 71/100
- State rank
- #392
- US rank
- #6787
Category grades
Schools grade is shown separately in the Schools card above.
Census & demographics
- Census place
- Herkimer, NY
- Population (ZIP)
- 9,641
Population outlook (Herkimer County) Hauer SSP2
- Today (2025)
- 59,340 people
- By 2030
- 56,838 · -4.2%
- By 2040
- 51,098 · -13.9%
- By 2050
- 45,080 · -24.0%
- By 2075
- 32,648 · -45.0%
- By 2100
- 22,266 · -62.5%
Race, ethnicity, and origin ACS 2023
- Neighborhood character
- Predominantly White (90%)
- Race & ethnicity
- White 90% Two or more races 5% Black 2% Asian 2% Hispanic / Latino 1%
- Common ancestry
- Romanian 9% Lithuanian 4% Italian 3%
- Foreign-born
- 4% · Canada, China
- Languages at home
- 92% English-only · French/Haitian/Cajun 2% Other Asian/Pacific 1% Spanish 1%
Political lean MEDSL · Herkimer
- 2024 margin
- Solid R (+36.4) · D 31.8% · R 68.2%
- 2008→2024 swing
- -27.1pp toward R · 2008: -9.3pp · 2024: -36.4pp
- All cycles
- 2024: R+36.4 2020: R+30.5 2016: R+34.5 2012: R+8.4 2008: R+9.3
Not yet ingested
- Civics
- —
Market trends
- HPI YoY
- ▲ 26.43%
- Current HPI
- 324.4601
- Rent YoY
- —
- Metro
- —
- State GDP YoY
- ▲ 2.60%
- F500 in state
- 92
Industry mix (Fortune 500 HQ in NY)
| Industry | F500 HQs | Revenue |
|---|---|---|
| Financial Services | 10 | $950B |
|
||
| Consumer Goods | 9 | $162B |
|
||
| Insurance | 4 | $225B |
|
||
| Telecommunications | 2 | $144B |
|
||
| Pharmaceuticals | 2 | $112B |
|
||
| Media / Entertainment | 2 | $69B |
|
||
Price history
+299.7% since first listed9 events — show timeline
- 2026-04-08 Listed $139,900 CNYIS
- 2026-01-02 Listing Removed — CNYIS
- 2025-11-24 Price Changed $134,900 CNYIS
- 2025-11-04 Price Changed $139,900 CNYIS
- 2025-09-22 Price Changed $149,900 CNYIS
- 2025-08-20 Listed $159,900 CNYIS
- 2018-06-18 Sold (Public Records) $36,000 Public Records
- 2016-10-04 Listing Removed — CNYIS
- 2016-04-26 Listed $35,000 CNYIS
Property tax history
+1.4%/yrLatest (2025): $2,218 · +3.4% YoY. Source: county tax records.
Cash-flow waterfall
monthlySold comps — $/sqft
last 12 mo · ≤1 miLoading sold comps…