 🏷️ Likely Rental
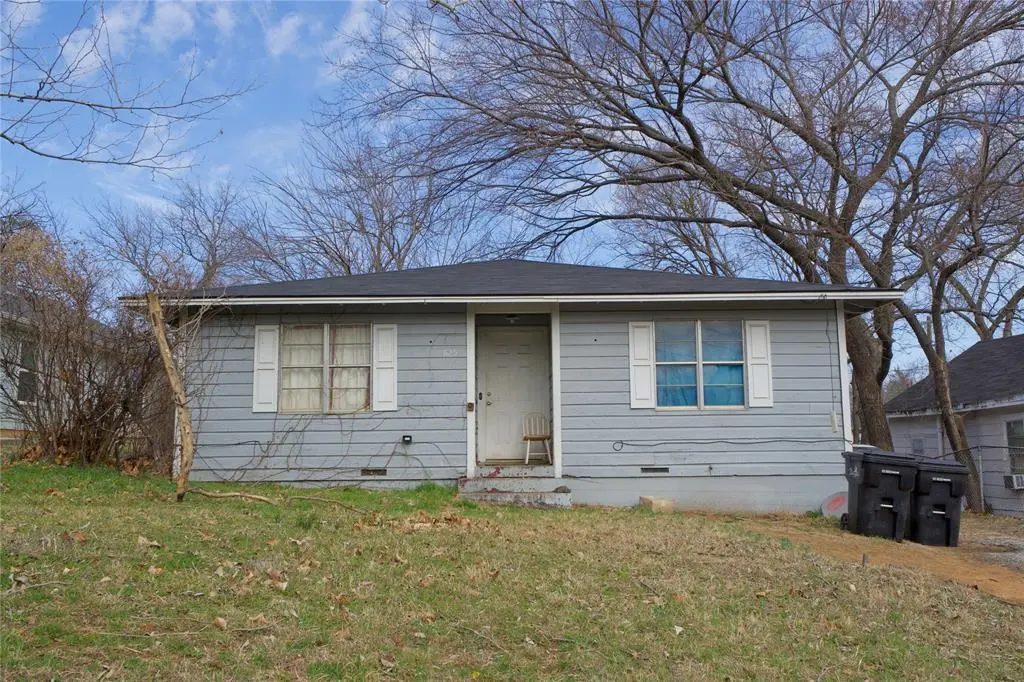
625 Main · Denison, TX
Flood risk 1/10 · Minimal
- FEMA flood zone
- X (unshaded)
- Chance of flooding over 30 yrs
- 0.0%
- Est. flood insurance / yr
- $507 – $1,088
Fire risk 5/10 · Moderate
- Est. fire insurance / yr
- $1,222 – $2,270
Heat risk 6/10 · Moderate
- Hot days now (above 109°F)
- 7 days/yr
- Hot days in 30 yrs
- 21 days/yr
Wind risk 4/10 · Minor
- Chance of severe wind over 30 yrs
- 17.0%
Air-quality risk 3/10 · Minor
- Unhealthy air days now
- 3 days/yr
- Unhealthy air days in 30 yrs
- 3 days/yr
Risk factors via First Street. Map © Google.
Why this score? — see what drove the B grade
The composite is a weighted blend of 9 inputs, each scored 0–100. Each bar is that input's sub-score; the figure is the points it added to the 100-point composite (weight × sub-score).
- Cash flow +27.4/30.0
- ARV discount +15.0/15.0
- DSCR +9.6/10.0
- 1% rule +7.5/10.0
- Schools +3.7/10.0
- Livability +3.7/5.0
- Rent growth +2.5/5.0
- Condition / age +2.5/5.0
- Appreciation +0.0/10.0
$129,000
🖨 Deal sheet (PDF) 📄 Offer letter ✓ Due diligence
Listing remarks MLS
Investment opportunity in the growing community of Denison, Texas. This 4-bedroom, 1-bath home at 625 E Main St is currently tenant-occupied with renters paying $1,100 per month, offering immediate rental income for investors looking to expand their portfolio. Located just minutes from downtown Denison, the property provides convenient access to local shops, restaurants, schools, and major highways. Denison continues to attract attention for its historic charm, strong sense of community, and proximity to Lake Texoma, making it a popular destination for both residents and visitors. Whether you're looking for a steady rental property or a project with future potential, this property offers an affordable entry point into the Denison market. Seller is also selling 1429 S Elm in Sherman with the mls number 21198367 AND the duplex at 1422 E Lamar. Feel free to make an offer for all three!
Key facts
- Tenant occupied
- Convenient access
- Schools
Tags
Neighborhood map
What this means for you Summary
Snapshot
- This is a 4-bed/1.0-bath single-family listed at $129k.
Deal economics
- At list price, monthly cash flow is $377 ($5k/yr) — positive.
- The deal already cash-flows at list — no discount required.
- Meets the 1% rule at list price ($2k rent vs $129k).
- Recommended offer: $117k (9.0% below list) — sets the bar for market timing.
- Cap rate 9.8% vs local median 3.8% in Denison — top-decile yield for the area; either an underpriced asset or a hidden risk that comps aren't pricing in. Stress-test before assuming the spread holds.
Location & tenants
- Location reads 73/100 on livability (#221 in TX) — a middle-class / working-renter tenant base. Strengths: cost of living A+, housing A+, crime A; Watch: health & safety D+, amenities F, commute F.
- Denison ISD (urban): math 43% / reading 44% proficiency, ranked #315 of 826 in TX (top 38%) — families likely to look elsewhere, expect single-tenant / working-renter base with shorter leases.
- Zoned schools: Terrell El (math 52% / reading 47%, grade D, #865 of 4,322 statewide, top 21%, 350 students, 76% FRL); Henry Scott Middle (math 36% / reading 48%, grade D-, #572 of 1,662 statewide, top 36%, 749 students, 66% FRL); Denison H S (math 53% / reading 53%, grade C-, #437 of 1,632 statewide, top 27%, 1,310 students, 58% FRL).
- Market conditions: 168 active listings in the ZIP; 40 comparable units currently listed for rent nearby; rentals lingering (median 45d on market — plan ~5-8 weeks vacancy on turnover, expect pricing pressure); 75% of comp listings sitting > 30 days — soft ceiling on asking rent; solid renter incomes; 2,272 units permitted in Grayson County in 2024 (750 in 5+ unit buildings).
Forward outlook
- Local home prices are declining (-3.0%/yr); year-one equity from $892 of loan paydown is wiped out by about $4k of value loss. Plan a longer hold.
- Grayson County population projected at +12% by 2050 — modest demand growth; plan on rents tracking national, not racing it.
- At projected returns (-3.0% appreciation + 3.0% rent growth), your $36k cash investment doubles in ~10 years — after that, you're playing with house money.
Negotiation context
- It's been on market 104 days — a 9% lower offer ($117k) is reasonable based on typical stale-listing flexibility.
- 3 sale attempts since 11y ago; this cycle's ask has dropped $10k (7%) from the opening price — seller is motivated, your offer sets the floor, not the list.
Risks & watch-outs
- Watch-outs: built in 1955 — expect roof / HVAC / electrical / plumbing capex.
- Climate carrying-cost: moderate wildfire risk; extreme-heat days projected 7→21/yr by 2055 (HVAC capex compounding) — expect insurance premiums to compound above CPI over the hold.
Questions for the listing agent
- It's been on market 104 days. Have you received any prior offers? Is the seller open to a 9% concession, seller financing, or rate buy-down credit?
- Built in 1955 — when were the roof, HVAC, electrical panel, plumbing, and water heater last replaced?
- Why hasn't it sold? Are there any deal-killer items the seller is aware of (foundation, flood, title, zoning, code violations)?
- Is there a deadline driving the sale (1031 exchange, divorce, estate, relocation)? That informs how much negotiation room exists.
- Schools are D-rated, which usually means shorter tenancies and higher turnover. Who's the typical renter profile here, and what's been the actual vacancy rate?
- What's the average days-on-market for RENTAL listings here right now (not sales)? A rising rental-DOM trend means longer vacancies and softer asking-rent achievability than the comps imply.
- What's the recent tenant-quality profile in this submarket — average credit score on applications, eviction rate, late-payment / NSF rate, and stable-employment percentage? A property-management company in the area should have these aggregated.
- How much new for-sale + rental construction is in the pipeline within 1–3 miles? Heavy new supply typically softens prices + rents 12–24 months out; constrained supply supports both.
Investment metrics
- 1% rule
- 1.25% ✓
- Cap rate
- 9.80%
- Cash-on-cash
- 12.51%
- DSCR
- 1.56
- GRM
- 6.7
CMA / ARV
- ARV (median comp)
- $225,958
- List price
- $129,000
- Delta
- -42.91%
- Verdict
- UNDERPRICED
- Comps
- 20 within 1.0 mi
Show comp detail 12 sales within ~0.75 mi
| Address | Dist | Beds/Ba | Sqft | Sold | Price | $/sf | Match |
|---|---|---|---|---|---|---|---|
| 729 N 9th Ave | 0.50mi | 4/2.0 | 1,514 (+5%) | 2mo | $295,000 | $195 | 63 |
| 730 E Walker St | 0.39mi | 3/2.0 (-1) | 1,514 (+5%) | 10mo | $251,000 | $166 | 56 |
| 318 E Chestnut St | 0.34mi | 3/2.0 (-1) | 1,337 (-7%) | 10mo | $179,000 | $134 | 55 |
| 909 E Sears St | 0.35mi | 3/2.0 (-1) | 1,245 (-14%) | 2mo | $197,500 | $159 | 51 |
| 114 W Morton St | 0.65mi | 3/2.0 (-1) | 1,544 (+7%) | 1mo | $259,900 | $168 | 48 |
| 425 E Munson St | 0.59mi | 3/2.0 (-1) | 1,344 (-7%) | 7mo | $258,000 | $192 | 46 |
| 530 E Day St | 0.53mi | 3/2.0 (-1) | 1,320 (-8%) | 10mo | $224,999 | $170 | 44 |
| 410 N Houston Ave | 0.59mi | 3/2.0 (-1) | 1,271 (-12%) | 3mo | $226,400 | $178 | 41 |
| 117 W Morton St | 0.68mi | 3/2.0 (-1) | 1,598 (+11%) | 6mo | $289,000 | $181 | 36 |
| 713 E Texas St | 0.71mi | 3/2.0 (-1) | 1,314 (-9%) | 12mo | $225,000 | $171 | 34 |
| 117 W Sears St | 0.65mi | 3/2.0 (-1) | 1,228 (-15%) | 4mo | $225,000 | $183 | 32 |
| 631 E Texas St | 0.71mi | 3/2.0 (-1) | 1,300 (-10%) | 12mo | $240,000 | $185 | 32 |
Match score weights: distance 35% · size 25% · config 20% · recency 20%. Top-matched comps best support the ARV.
Projected returns pro-forma
-3.0% appreciation · 3.0% rent growth · sell at horizon
- IRR
- 2.2%
- Equity multiple
- 1.09×
- Total profit
- $3,111
- Equity at exit
- $19,234
- IRR
- 11.8%
- Equity multiple
- 1.93×
- Total profit
- $33,713
- Equity at exit
- $11,154
Cash invested: $36,120 (down + closing). Projections, not guarantees.
Landlord ↔ Tenant lean methodology
- Overall (STATE)
- 87 Strongly Landlord-Friendly
- State Texas
- 87 Strongly Landlord-Friendly · R+5
- County
- — inherits STATE
- City
- — inherits STATE
ZIP-level market 75021
- Home prices YoY
- -17.3%
- Active inventory
- 168
- Price-to-rent
- 6.7×
Monthly cashflow live
- Estimated rent
- $1,615 high interval (Pro) →
- Mortgage (P&I)
- −$676
- Tax from tax record
- −$169 /mo · $2,032/yr
- Insurance
- −$54
- HOA
- −$0
- Vacancy / Maint / Mgmt
- −$339
- Net cashflow
- $377
Break-even live
Sensitivity live
| Price | -10% $450 | -5% $413 | +0% $377 | +5% $340 | +10% $304 |
|---|---|---|---|---|---|
| Rent | -10% $249 | -5% $313 | +0% $377 | +5% $440 | +10% $504 |
| Rate | -1.0pp $442 | -0.5pp $409 | base $377 | +0.5pp $343 | +1.0pp $309 |
UW: 25.0% down · 7.5% · 30yr · 1.5% tax · 5.0% vac · 8.0% maint · 8.0% mgmt
Financing live
Cash to close
- Down payment
- $32,250
- Closing costs
- $3,870
- Reserves months
- —
- Total cash needed
- —
Loan-product check · same deal, 3 products live
Conventional
25% down · 7.5% · 30yr
- Down + closing
- —
- Monthly P&I
- —
- Monthly cashflow
- —
- DSCR
- —
- Eligible?
- —
Personal DTI + credit; lowest rate.
DSCR
20% down · 8.5% · 30yr
- Down + closing
- —
- Monthly P&I
- —
- Monthly cashflow
- —
- DSCR
- —
- Eligible?
- —
No personal income docs; deal must DSCR.
Hard money
10% down · 12.0% · 12mo
- Down + closing
- —
- Monthly P&I
- —
- Monthly cashflow
- —
- DSCR
- —
- Eligible?
- —
Short-term bridge; refi at stabilization.
Rent comps 40 comps
| Address | Beds | Baths | Sqft | Rent | $/sqft | DOM | Units | Dist |
|---|---|---|---|---|---|---|---|---|
| 500 E Main St Denison, TX | 3.0 | 2.0 | 1216 | $1,425 | $1.17 | 45d | 1 | 0.16mi |
| 430 E Woodard St Denison, TX | 3.0 | 2.0 | 1263 | $1,590 | $1.26 | 45d | 1 | 0.18mi |
| 519 E Gandy St Denison, TX | 3.0 | 2.0 | 1132 | $1,299 | $1.15 | 46d | 1 | 0.18mi |
| 537 E Sears St Denison, TX | 3.0 | 2.0 | 1146 | $1,599 | $1.40 | 22d | 1 | 0.24mi |
| 713 E Sears St Denison, TX | 3.0 | 2.0 | 1230 | $1,475 | $1.20 | 22d | 1 | 0.25mi |
| 521 E Sears St Denison, TX | 4.0 | 2.0 | 1401 | $1,650 | $1.18 | 45d | 1 | 0.25mi |
| 327-329 E Nelson St #329 Denison, TX | 3.0 | 2.0 | 1382 | $1,625 | $1.18 | 45d | 1 | 0.42mi |
| 313 E Nelson St Denison, TX | 3.0 | 2.0 | 1279 | $1,625 | $1.27 | 22d | 1 | 0.46mi |
| 520 E Day St Denison, TX | 3.0 | 1.0 | 1072 | $1,225 | $1.14 | 22d | 1 | 0.51mi |
| 809 S Travis Ave Denison, TX | 3.0 | 2.0 | 1490 | $1,595 | $1.07 | 45d | 1 | 0.58mi |
| 212 E Walker St Denison, TX | 3.0 | 2.0 | 1260 | $1,695 | $1.35 | 45d | 1 | 0.58mi |
| 131 E Bond St Denison, TX | 3.0 | 2.5 | 1192 | $1,250 | $1.05 | 45d | 1 | 0.59mi |
| 514 N Rusk Ave Unit 516 Denison, TX | 3.0 | 2.0 | 1173 | $1,375 | $1.17 | 22d | 1 | 0.77mi |
| 224 W Bond St Denison, TX | 3.0 | 2.5 | 1294 | $1,375 | $1.06 | 45d | 1 | 0.77mi |
| 226 W Bond St Unit 224 Denison, TX | 3.0 | 2.5 | 1294 | $1,375 | $1.06 | 45d | 1 | 0.78mi |
| 514 N Rusk Ave Denison, TX | 3.0 | 2.0 | 1173 | $1,450 | $1.24 | 45d | 1 | 0.78mi |
| 517 E Heron St Denison, TX | 3.0 | 2.0 | 1232 | $1,550 | $1.26 | 45d | 1 | 0.82mi |
| 320 W Bond St Denison, TX | 3.0 | 2.0 | 1278 | $1,500 | $1.17 | 46d | 1 | 0.85mi |
| 1309 S 5th Ave Unit 1311 Denison, TX | 3.0 | 2.5 | 1224 | $1,350 | $1.10 | 45d | 1 | 0.87mi |
| 1309 S 5th Ave #1309 Denison, TX | 3.0 | 2.5 | 1224 | $1,325 | $1.08 | 45d | 1 | 0.87mi |
| 1309 S 5th Ave Denison, TX | 3.0 | 2.5 | 1224 | $1,375 | $1.12 | 45d | 1 | 0.88mi |
| 411 S Fannin Ave #411 Denison, TX | 3.0 | 2.5 | 1322 | $1,450 | $1.10 | 22d | 1 | 0.94mi |
| 404 W Day St Denison, TX | 3.0 | 2.0 | 1057 | $1,500 | $1.42 | 22d | 1 | 0.97mi |
| 410 S Mirick Ave Denison, TX | 3.0 | 2.0 | 1100 | $1,300 | $1.18 | 45d | 1 | 1.00mi |
| 523 E Hanna St Denison, TX | 3.0 | 2.0 | 1344 | $1,595 | $1.19 | 45d | 1 | 1.02mi |
| 401 W Elm St Denison, TX | 3.0 | 2.5 | 1506 | $1,850 | $1.23 | 45d | 1 | 1.02mi |
| 610 W Owing St Denison, TX | 3.0 | 2.0 | 1108 | $1,395 | $1.26 | 45d | 1 | 1.04mi |
| 705 E Hanna St Denison, TX | 3.0 | 2.0 | 1314 | $1,600 | $1.22 | 45d | 1 | 1.05mi |
| 527 W Walker St Denison, TX | 3.0 | 2.0 | 1300 | $1,675 | $1.29 | 45d | 1 | 1.08mi |
| 108 W Acheson St Denison, TX | 3.0 | 2.0 | 1056 | $1,550 | $1.47 | 45d | 1 | 1.16mi |
| 613 W Elm St Unit 613 Denison, TX | 3.0 | 2.0 | 1375 | $1,525 | $1.11 | 46d | 1 | 1.19mi |
| 731 W Morton St Denison, TX | 3.0 | 2.0 | 1298 | $1,500 | $1.16 | 45d | 1 | 1.19mi |
| 731 W Bond St Denison, TX | 3.0 | 2.0 | 1297 | $1,595 | $1.23 | 22d | 1 | 1.21mi |
| 1730 S Center St Denison, TX | 4.0 | 1.5 | 1700 | $1,500 | $0.88 | 45d | 1 | 1.22mi |
| 900 W Chestnut St Denison, TX | 3.0 | 2.0 | 1742 | $1,695 | $0.97 | 45d | 1 | 1.26mi |
| 727 W Johnson St Unit A Denison, TX | 3.0 | 2.5 | 1238 | $1,450 | $1.17 | 45d | 1 | 1.27mi |
| 1004 W Gandy St Denison, TX | 3.0 | 1.0 | 1250 | $1,299 | $1.04 | 22d | 1 | 1.37mi |
| 921 W Day St Denison, TX | 3.0 | 2.0 | 1212 | $1,500 | $1.24 | 45d | 1 | 1.39mi |
| 1921 Ave a Denison, TX | 4.0 | 3.0 | 1700 | $1,995 | $1.17 | 45d | 1 | 1.45mi |
| 1022 W Shepherd St #1022 Denison, TX | 3.0 | 2.5 | 1322 | $1,450 | $1.10 | 22d | 1 | 1.46mi |
Listing history 29 events
-
2026-06-22days on market $129,000 Active 104 DOM
-
2026-06-19days on market $129,000 Active 102 DOM
-
2026-06-18days on market $129,000 Active 101 DOM
-
2026-06-17days on market $129,000 Active 100 DOM
-
2026-06-16days on market $129,000 Active 99 DOM
-
2026-06-15days on market $129,000 Active 98 DOM
-
2026-06-14days on market $129,000 Active 96 DOM
-
2026-06-13days on market $129,000 Active 95 DOM
-
2026-06-10days on market $129,000 Active 93 DOM
-
2026-06-09days on market $129,000 Active 92 DOM
-
2026-06-08days on market $129,000 Active 91 DOM
-
2026-06-07days on market $129,000 Active 90 DOM
-
2026-06-05days on market $129,000 Active 87 DOM
-
2026-06-03days on market $129,000 Active 86 DOM
-
2026-06-02days on market $129,000 Active 85 DOM
-
2026-06-01days on market $129,000 Active 84 DOM
-
2026-05-31days on market $129,000 Active 83 DOM
-
2026-05-30days on market $129,000 Active 82 DOM
-
2026-05-19price $129,000 898-char remark
Show marketing remark (898 chars)
Investment opportunity in the growing community of Denison, Texas. This 4-bedroom, 1-bath home at 625 E Main St is currently tenant-occupied with renters paying $1,100 per month, offering immediate rental income for investors looking to expand their portfolio. Located just minutes from downtown Denison, the property provides convenient access to local shops, restaurants, schools, and major highways. Denison continues to attract attention for its historic charm, strong sense of community, and proximity to Lake Texoma, making it a popular destination for both residents and visitors. Whether you're looking for a steady rental property or a project with future potential, this property offers an affordable entry point into the Denison market. Seller is also selling 1429 S Elm in Sherman with the mls number 21198367 AND the duplex at 1422 E Lamar. Feel free to make an offer for all three!
-
2026-03-07$139,000 Active 898-char remark
Show marketing remark (898 chars)
Investment opportunity in the growing community of Denison, Texas. This 4-bedroom, 1-bath home at 625 E Main St is currently tenant-occupied with renters paying $1,100 per month, offering immediate rental income for investors looking to expand their portfolio. Located just minutes from downtown Denison, the property provides convenient access to local shops, restaurants, schools, and major highways. Denison continues to attract attention for its historic charm, strong sense of community, and proximity to Lake Texoma, making it a popular destination for both residents and visitors. Whether you're looking for a steady rental property or a project with future potential, this property offers an affordable entry point into the Denison market. Seller is also selling 1429 S Elm in Sherman with the mls number 21198367 AND the duplex at 1422 E Lamar. Feel free to make an offer for all three!
-
2024-08-27historical
-
2024-05-27$140,000 Active
-
2021-10-06soldstatus
-
2018-08-22soldstatus
-
2016-02-03soldstatus Sold
-
2015-11-14status Pending
-
2015-10-27$21,000 Active
-
2005-02-02soldstatus
-
2004-03-24soldstatus
ⓘ Source: listings_history table (triggers on properties + properties_extension) + one-shot
backfill from property_details.listing_events for pre-trigger history.
Tax reassessment forecast TX · Resets to sale price
- Current annual tax
- $2,032 · $169/mo
- Projected year-2 tax
- $2,361 · $197/mo
- Expected delta
- +$328/yr (+$27/mo · 16.2%)
ⓘ Screening estimate from a state-policy table — verify with the county assessor before closing.
Climate risk First Street
- Flood 1/10 Low FEMA zone X (unshaded) · 0% chance over 30 yrs
- Wildfire 5/10 Major
- Heat 6/10 Major 7 d/yr ≥109°F today · 21 d/yr by 30 yrs out
- Wind 4/10 Moderate 17% chance of damaging wind over 30 yrs
- Air quality 3/10 Moderate 3 unhealthy d/yr today · 3 by 30 yrs out
Nearby sold comps map
Loading sold comps map…
Walkable amenities ~0.75 mi
Loading nearby amenities…
Taxation est. · year 1
- Rental income
- $19,385
- − Mortgage interest
- −$7,226
- − Property taxes
- −$2,032
- − Insurance
- −$645
- − Repairs & maintenance
- −$1,551
- − Management
- −$1,551
- − Depreciation
- −$3,753
- Taxable income
- $2,628
- Est. tax owed @ 24.0%
- −$631
- After-tax cash flow
- $3,889/yr
For passive investors: Depreciation is non-cash, so a rental often shows a tax loss while cash-flowing — sheltering income. Rental losses are passive: they offset passive income freely, and up to $25,000/yr can offset ordinary (W-2) income if you actively participate and your MAGI is under $100k (phasing out to $0 by $150k); unused losses carry forward. On sale, claimed depreciation is recaptured at up to 25%, and gains may owe capital-gains tax (a 1031 exchange can defer both). Figures are a year-1 estimate at your 24.0% rate — not tax advice; consult a CPA.
Schools (NCES district)
- District
- Denison ISD
- NCES district ID
- 4816710
- Math proficiency
- 43% ▼ -7.00%
- Reading proficiency
- 44% ▼ -3.00%
- Median HH income
- $41,650
- Composite
- 36.6/100
- National rank
- #4629
- State rank
- #315 of 826 in TX
Livability — Denison
- Score
- 73/100
- State rank
- #221
- US rank
- #5428
Category grades
Schools grade is shown separately in the Schools card above.
Census & demographics
- Census place
- Denison, TX
- County
- Grayson County · 108,053 people
- City population
- 34,008
- Metro
- Sherman-Denison, TX
- Population (ZIP)
- 9,173
- Household income
- $83,067
- Rent vs Own
- Severe rent burden
- 124.0
Population outlook (Grayson County) Hauer SSP2
- Today (2025)
- 134,540 people
- By 2030
- 138,653 · +3.1%
- By 2040
- 145,958 · +8.5%
- By 2050
- 151,218 · +12.4%
- By 2075
- 161,802 · +20.3%
- By 2100
- 159,036 · +18.2%
Race, ethnicity, and origin ACS 2023
- Neighborhood character
- Predominantly White (81%)
- Race & ethnicity
- White 81% Hispanic / Latino 11% Two or more races 9% Black 2% Asian 1%
- Hispanic origin (detail)
- Mexican 10%
- Common ancestry
- Iranian 3% Italian 2% Lithuanian 1%
- Foreign-born
- 5% · Canada
- Languages at home
- 91% English-only · Spanish 8% Other Indo-European 1%
Political lean MEDSL · Grayson
- 2024 margin
- Solid R (+54.3) · D 22.5% · R 76.7%
- 2008→2024 swing
- -16.4pp toward R · 2008: -37.9pp · 2024: -54.3pp
- All cycles
- 2024: R+54.3 2020: R+49.9 2016: R+53.1 2012: R+48.0 2008: R+37.9
Not yet ingested
- Civics
- —
Market trends
- HPI YoY
- ▼ -59.91%
- Current HPI
- 285.7502
- Rent YoY
- —
- Metro
- Sherman-Denison, TX
- State GDP YoY
- ▲ 3.95%
- F500 in state
- 110
Industry mix (Fortune 500 HQ in TX)
| Industry | F500 HQs | Revenue |
|---|---|---|
| Energy | 16 | $1,198B |
|
||
| Technology | 5 | $198B |
|
||
| Engineering / Construction | 4 | $72B |
|
||
| Energy Services | 3 | $60B |
|
||
| Utilities | 3 | $41B |
|
||
| Healthcare | 2 | $330B |
|
||
Price history
+514.3% since first listed11 events — show timeline
- 2026-05-19 Price Changed $129,000 NTREIS
- 2026-03-07 Listed $139,000 NTREIS
- 2024-08-27 Listing Removed — NTREIS
- 2024-05-27 Listed $140,000 NTREIS
- 2021-10-06 Sold (Public Records) — Public Records
- 2018-08-22 Sold (Public Records) — Public Records
- 2016-02-03 Sold (MLS) — NTREIS
- 2015-11-14 Pending — NTREIS
- 2015-10-27 Listed $21,000 NTREIS
- 2005-02-02 Sold (Public Records) — Public Records
- 2004-03-24 Sold (Public Records) — Public Records
Property tax history
+4.7%/yrLatest (2025): $2,032 · +1.3% YoY. Source: county tax records.
Cash-flow waterfall
monthlySold comps — $/sqft
last 12 mo · ≤1 miLoading sold comps…