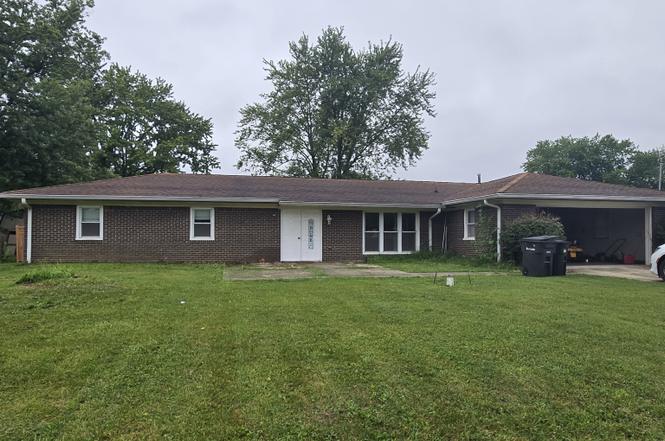
3598 N State Road 9 · Greenfield, IN
Flood risk No data
- FEMA flood zone
- —
- Chance of flooding over 30 yrs
- —
- Est. flood insurance / yr
- —
Fire risk No data
- Est. fire insurance / yr
- —
Heat risk No data
- Hot days now (above threshold)
- —
- Hot days in 30 yrs
- —
Wind risk No data
- Chance of severe wind over 30 yrs
- —
Air-quality risk No data
- Unhealthy air days now
- —
- Unhealthy air days in 30 yrs
- —
Risk factors via First Street. Map © Google.
Why this score? — see what drove the D grade
The composite is a weighted blend of 9 inputs, each scored 0–100. Each bar is that input's sub-score; the figure is the points it added to the 100-point composite (weight × sub-score).
- Cash flow +13.2/30.0
- ARV discount +6.8/15.0
- DSCR +4.0/10.0
- Schools +4.0/10.0
- Livability +3.7/5.0
- Rent growth +3.2/5.0
- 1% rule +2.9/10.0
- Condition / age +2.5/5.0
- Appreciation +0.0/10.0
$219,900
🖨 Deal sheet 📄 Offer letter ✓ Due diligence
Listing remarks MLS
Great 3 bedroom 2 bath house in popular Cranberry addition. 2 car attached garage. Big privacy fenced backyard.
Key facts
- Private outdoor area
- Fenced backyard
- Fireplace
Tags
Property features AI
Finance
- Other: Property type listed as residential
Exterior
- Parking: Attached concrete garage with 2 parking spaces
- Utilities: Septic system; Private water supply; Cable available; Natural gas available
- Home design: Single-family residence; One level
- Construction: Brick construction; Slab foundation
- Exterior features: Patio; Porch; Privacy fence; Corner lot with mature trees; Exterior is handicap accessible; Property has a view
Interior
- Kitchen: Electric oven; Dishwasher; Garbage disposal
- Bedrooms: 3 bedrooms on the main level; Primary bedroom with walk-in closet
- Bathrooms: 2 full bathrooms on the main level; Primary bathroom with full shower stall
- Heating & cooling: Forced air heating (natural gas); Central air conditioning
- Interior features: Breakfast bar; Painted woodwork; Living room designated as formal; Laundry located in the garage; Wood-burning masonry fireplace in the living room; Smoke alarm
- Laundry & utility: Electric water heater; Laundry in garage
Neighborhood map
What this means for you Summary
Snapshot
- This is a 3-bed/2.0-bath single-family listed at $220k.
Deal economics
- At list price, monthly cash flow is $-4 ($-46/yr) — negative.
- To cash-flow at today's rent, offer at most $219k (0.3% below list).
- To meet the 1% rule (rent ≥ 1% of price), the offer needs to be $174k (20.9% below list).
- Recommended offer: $174k (20.9% below list) — sets the bar for 1% rule.
- Cap rate 6.3% vs local median 4.4% in Greenfield — top-decile yield for the area; either an underpriced asset or a hidden risk that comps aren't pricing in. Stress-test before assuming the spread holds.
Location & tenants
- Location reads 73/100 on livability (#88 in IN) — a middle-class / working-renter tenant base. Strengths: cost of living A+, housing A+, schools B; Watch: amenities F, commute F.
- Greenfield-Central Community Schools (other): math 47% / reading 45% proficiency, ranked #83 of 301 in IN (top 28%) — families likely to look elsewhere, expect single-tenant / working-renter base with shorter leases.
- Market conditions: Rents rising (+2.9%/yr); 481 active listings in the ZIP; 12 comparable units currently listed for rent nearby; rentals leasing fast (median 5d on market — plan ~1-2 weeks tenant-placement turnaround); solid renter incomes; 1,091 units permitted in Hancock County in 2024 (0 in 5+ unit buildings).
Forward outlook
- Local home prices are declining (-3.0%/yr); year-one equity from $2k of loan paydown is wiped out by about $7k of value loss. Plan a longer hold.
- Hancock County population projected at +7% by 2050 — modest demand growth; plan on rents tracking national, not racing it.
Negotiation context
- It's been on market 194 days — a 12% lower offer ($194k) is reasonable based on typical stale-listing flexibility.
- 13 sale attempts since 24y ago; this cycle's ask has dropped $30k (12%) from the opening price — seller is motivated, your offer sets the floor, not the list.
Questions for the listing agent
- What do current leases actually rent for vs. the listed asking? Can we see a recent rent roll and the last 12 months of T-12 income?
- It's been on market 194 days. Have you received any prior offers? Is the seller open to a 21% concession, seller financing, or rate buy-down credit?
- Built in 1978 — when were the roof, HVAC, electrical panel, plumbing, and water heater last replaced?
- Why hasn't it sold? Are there any deal-killer items the seller is aware of (foundation, flood, title, zoning, code violations)?
- Is there a deadline driving the sale (1031 exchange, divorce, estate, relocation)? That informs how much negotiation room exists.
- Schools are B-rated — typically a magnet for longer-tenancy family renters. What's the average tenant stay here, and is there a school-zone premium baked into asking?
- The area grade is low — what's the realistic commute time and amenity access for the typical tenant pool here? Any planned neighborhood developments (good or bad) we should know about?
- What's the average days-on-market for RENTAL listings here right now (not sales)? A rising rental-DOM trend means longer vacancies and softer asking-rent achievability than the comps imply.
- What's the recent tenant-quality profile in this submarket — average credit score on applications, eviction rate, late-payment / NSF rate, and stable-employment percentage? A property-management company in the area should have these aggregated.
- How much new for-sale + rental construction is in the pipeline within 1–3 miles? Heavy new supply typically softens prices + rents 12–24 months out; constrained supply supports both.
Investment metrics
- 1% rule
- 0.79% ✗
- Cap rate
- 6.27%
- Cash-on-cash
- -0.07%
- DSCR
- 1.00
- GRM
- 10.5
CMA / ARV
- ARV (on-the-fly)
- $216,576
- Comps found
- 12
Show comp detail 12 sales within ~0.75 mi
| Address | Dist | Beds/Ba | Sqft | Sold | Price | $/sf | Match |
|---|---|---|---|---|---|---|---|
| 3904 N State Road 9 | 0.00mi | 3/1.5 | 1,635 (+6%) | 3mo | $250,000 | $153 | 85 |
| 3809 N State Road 9 | 0.00mi | 3/1.5 | 1,404 (-9%) | 7mo | $225,000 | $160 | 78 |
| 238 Walnut St | 0.23mi | 3/2.0 | 1,637 (+7%) | 6mo | $230,000 | $141 | 73 |
| 328 Grant St | 0.27mi | 2/1.0 (-1) | 1,574 (+2%) | 8mo | $221,000 | $140 | 68 |
| 17 Center St | 0.40mi | 3/1.0 | 1,476 (-4%) | 4mo | $184,000 | $125 | 67 |
| 419 W Osage St | 0.42mi | 3/2.0 | 1,400 (-9%) | 7mo | $162,000 | $116 | 59 |
| 239 Walnut St | 0.22mi | 4/1.0 (+1) | 1,338 (-13%) | 0mo | $130,000 | $97 | 59 |
| 104 Forest Ave | 0.36mi | 3/1.0 | 1,353 (-12%) | 7mo | $195,000 | $144 | 53 |
| 217 Tague St | 0.46mi | 4/2.0 (+1) | 1,753 (+14%) | 5mo | $225,000 | $128 | 46 |
| 530 S State St | 0.42mi | 2/1.0 (-1) | 1,728 (+12%) | 7mo | $182,000 | $105 | 45 |
| 857 Walnut St | 0.65mi | 3/2.0 | 1,317 (-14%) | 8mo | $233,000 | $177 | 39 |
| 811 N Noble St | 0.69mi | 3/1.0 | 1,351 (-12%) | 8mo | $215,000 | $159 | 37 |
Match score weights: distance 35% · size 25% · config 20% · recency 20%. Top-matched comps best support the ARV.
Projected returns pro-forma
-3.0% appreciation · 2.88% rent growth · sell at horizon
- IRR
- -16.6%
- Equity multiple
- 0.41×
- Total profit
- $-36,146
- Equity at exit
- $32,788
- IRR
- -8.6%
- Equity multiple
- 0.47×
- Total profit
- $-32,893
- Equity at exit
- $19,013
Cash invested: $61,572 (down + closing). Projections, not guarantees.
Landlord ↔ Tenant lean methodology
- Overall (STATE)
- 90 Strongly Landlord-Friendly
- State Indiana
- 90 Strongly Landlord-Friendly · R+11
- County
- — inherits STATE
- City
- — inherits STATE
ZIP-level market 46140
- Rents YoY
- 2.9%
- Active inventory
- 481
- Price-to-rent
- 10.5×
Monthly cashflow live
- Estimated rent
- $1,740 high interval (Pro) →
- Mortgage (P&I)
- −$1,153
- Tax from tax record
- −$134 /mo · $1,606/yr
- Insurance
- −$92
- HOA
- −$0
- Vacancy / Maint / Mgmt
- −$365
- Net cashflow
- $-4
Break-even live
UW: 25.0% down · 7.5% · 30yr · 1.5% tax · 5.0% vac · 8.0% maint · 8.0% mgmt
Financing live
Cash to close
- Down payment
- $54,975
- Closing costs
- $6,597
- Reserves months
- —
- Total cash needed
- —
Loan-product check · same deal, 3 products live
Conventional
25% down · 7.5% · 30yr
- Down + closing
- —
- Monthly P&I
- —
- Monthly cashflow
- —
- DSCR
- —
- Eligible?
- —
Personal DTI + credit; lowest rate.
DSCR
20% down · 8.5% · 30yr
- Down + closing
- —
- Monthly P&I
- —
- Monthly cashflow
- —
- DSCR
- —
- Eligible?
- —
No personal income docs; deal must DSCR.
Hard money
10% down · 12.0% · 12mo
- Down + closing
- —
- Monthly P&I
- —
- Monthly cashflow
- —
- DSCR
- —
- Eligible?
- —
Short-term bridge; refi at stabilization.
Rent comps 12 comps
| Address | Beds | Baths | Sqft | Rent | $/sqft | DOM | Units | Dist |
|---|---|---|---|---|---|---|---|---|
| 220 Walker St Greenfield, IN | 3.0 | 1.0 | 1101 | $1,400 | $1.27 | 4d | 1 | 0.38mi |
| 550 Wood St Greenfield, IN | 2.0 | 1.0 | 1162 | $1,200 | $1.03 | 4d | 1 | 0.46mi |
| 22 Wilson St Greenfield, IN | 2.0 | 1.0 | 2200 | $925 | $0.42 | 3d | 1 | 0.47mi |
| 821 W 7th St Greenfield, IN | 2.0 | 2.0 | 1234 | $1,700 | $1.38 | 23d | 1 | 0.66mi |
| 713 Cattail Dr Greenfield, IN | 3.0 | 2.0 | 1498 | $2,045 | $1.37 | 3d | 1 | 0.74mi |
| 1027 E Fourth St Greenfield, IN | 3.0 | 2.0 | 1430 | $1,700 | $1.19 | 23d | 1 | 0.80mi |
| 1014 E Seventh St Greenfield, IN | 3.0 | 1.0 | 1192 | $1,400 | $1.17 | 4d | 1 | 0.87mi |
| 876 Marsh Aster Dr Greenfield, IN | 4.0 | 2.0 | 1771 | $2,245 | $1.27 | 10d | 1 | 0.93mi |
| 968 Lotus Dr Greenfield, IN | 3.0–5.0 | 2.0–3.0 | 2049 | $2,045 | $1.00 | 1d | 8 | 0.96mi |
| 210 Flagstone Dr Greenfield, IN | 1.0–3.0 | 1.0–2.5 | 1084 | $2,254 | $2.08 | 1d | 17 | 1.06mi |
| 917 E McKenzie Rd Greenfield, IN | 1.0–2.0 | 1.0–1.5 | 918 | $1,199 | $1.31 | 1d | 4 | 1.14mi |
| 1439 Coachlite Dr Unit Coachlite Greenfield, IN | 3.0 | 1.5 | 1147 | $1,495 | $1.30 | 23d | 1 | 1.24mi |
Listing history 50 events
-
2026-06-18days on market $219,900 Active 194 DOM
-
2026-06-17days on market $219,900 Active 193 DOM
-
2026-06-16days on market $219,900 Active 192 DOM
-
2026-06-15days on market $219,900 Active 191 DOM
-
2026-06-13days on market $219,900 Active 189 DOM
-
2026-06-13days on market $219,900 Active 188 DOM
-
2026-06-09days on market $219,900 Active 185 DOM
-
2026-06-08days on market $219,900 Active 184 DOM
-
2026-06-07days on market $219,900 Active 183 DOM
-
2026-06-05days on market $219,900 Active 180 DOM
-
2026-06-03days on market $219,900 Active 179 DOM
-
2026-06-02days on market $219,900 Active 178 DOM
-
2026-06-01days on market $219,900 Active 177 DOM
-
2026-05-31days on market $219,900 Active 176 DOM
-
2026-03-06price $219,900
-
2026-02-16status Active
-
2026-01-12status Pending
-
2025-12-12price $224,900
-
2025-12-03status Active
-
2025-10-22status Pending
-
2025-10-15status Active
-
2025-08-25status Pending
-
2025-08-14price $239,900
-
2025-08-08price $244,900
-
2025-07-31$249,900 Active
-
2023-12-05soldstatus $240,000 Closed 111-char remark
Show marketing remark (111 chars)
Great 3 bedroom 2 bath house in popular Cranberry addition. 2 car attached garage. Big privacy fenced backyard.
-
2023-11-03status Pending 111-char remark
Show marketing remark (111 chars)
Great 3 bedroom 2 bath house in popular Cranberry addition. 2 car attached garage. Big privacy fenced backyard.
-
2023-10-31price $250,000 111-char remark
Show marketing remark (111 chars)
Great 3 bedroom 2 bath house in popular Cranberry addition. 2 car attached garage. Big privacy fenced backyard.
-
2023-10-07$255,000 Active 111-char remark
Show marketing remark (111 chars)
Great 3 bedroom 2 bath house in popular Cranberry addition. 2 car attached garage. Big privacy fenced backyard.
-
2022-10-27historical
-
2022-08-09price $255,000
-
2022-06-28price $259,977
-
2022-05-17price $264,977
-
2022-05-10status Active
-
2022-05-01status Pending
-
2022-04-27$269,977 Active
-
2021-10-27soldstatus $245,000 Closed
-
2021-10-27historical
-
2021-08-11$239,977
-
2017-11-07soldstatus $118,500 Sold
-
2017-10-12status Pending
-
2017-10-03status Active
-
2017-09-21status Pending
-
2017-08-02price $139,900
-
2017-07-10$144,900 Active
-
2013-11-06historical
-
2013-11-06soldstatus $88,000
-
2013-05-02$95,000
-
2006-06-12historical
-
2005-12-13$149,500
ⓘ Source: listings_history table (triggers on properties + properties_extension) + one-shot
backfill from property_details.listing_events for pre-trigger history.
Tax reassessment forecast IN · Partial reset (capped growth)
- Current annual tax
- $1,606 · $134/mo
- Projected year-2 tax
- $1,737 · $145/mo
- Expected delta
- +$132/yr (+$11/mo · 8.2%)
ⓘ Screening estimate from a state-policy table — verify with the county assessor before closing.
Nearby sold comps map
Loading sold comps map…
Walkable amenities ~0.75 mi
Loading nearby amenities…
Taxation est. · year 1
- Rental income
- $20,883
- − Mortgage interest
- −$12,318
- − Property taxes
- −$1,606
- − Insurance
- −$1,100
- − Repairs & maintenance
- −$1,671
- − Management
- −$1,671
- − Depreciation
- −$6,397
- Taxable loss
- −$3,878
- Est. tax savings @ 24.0%
- +$931
- After-tax cash flow
- $885/yr
For passive investors: Depreciation is non-cash, so a rental often shows a tax loss while cash-flowing — sheltering income. Rental losses are passive: they offset passive income freely, and up to $25,000/yr can offset ordinary (W-2) income if you actively participate and your MAGI is under $100k (phasing out to $0 by $150k); unused losses carry forward. On sale, claimed depreciation is recaptured at up to 25%, and gains may owe capital-gains tax (a 1031 exchange can defer both). Figures are a year-1 estimate at your 24.0% rate — not tax advice; consult a CPA.
Schools (NCES district)
- District
- Greenfield-Central Community Schools
- NCES district ID
- 1804050
- Math proficiency
- 47% ▼ -12.00%
- Reading proficiency
- 45% ▼ -11.00%
- Median HH income
- $55,533
- Composite
- 40.01/100
- National rank
- #3827
- State rank
- #83 of 301 in IN
Livability — Greenfield
- Score
- 73/100
- State rank
- #88
- US rank
- #5094
Category grades
Schools grade is shown separately in the Schools card above.
Census & demographics
- Census place
- Greenfield, IN
- County
- Hancock County · 59,521 people
- City population
- 43,511
- Metro
- Indianapolis-Carmel-Anderson, IN
- Population (ZIP)
- 43,511
- Household income
- $83,056
- Rent vs Own
- Severe rent burden
- 795.0
Population outlook (Hancock County) Hauer SSP2
- Today (2025)
- 77,820 people
- By 2030
- 79,914 · +2.7%
- By 2040
- 82,734 · +6.3%
- By 2050
- 83,348 · +7.1%
- By 2075
- 82,439 · +5.9%
- By 2100
- 74,181 · -4.7%
Race, ethnicity, and origin ACS 2023
- Neighborhood character
- Predominantly White (92%)
- Race & ethnicity
- White 92% Two or more races 5% Hispanic / Latino 3% Black 1%
- Common ancestry
- Italian 3% Lithuanian 3% Slovak 1%
- Foreign-born
- 3% · Canada
- Languages at home
- 96% English-only · Spanish 2% Other Indo-European 1%
Political lean MEDSL · Hancock
- 2024 margin
- Solid R (+33.7) · D 32.2% · R 65.9% · Other 1.9%
- 2008→2024 swing
- -4.1pp toward R · 2008: -29.6pp · 2024: -33.7pp
- All cycles
- 2024: R+33.7 2020: R+37.5 2016: R+44.8 2012: R+41.0 2008: R+29.6
Not yet ingested
- Civics
- —
Market trends
- HPI YoY
- ▼ -131.67%
- Current HPI
- 225.0367
- Rent YoY
- ▲ 2.88%
- Metro
- Indianapolis-Carmel-Anderson, IN
- State GDP YoY
- ▲ 2.90%
- F500 in state
- 18
Industry mix (Fortune 500 HQ in IN)
| Industry | F500 HQs | Revenue |
|---|---|---|
| Industrial Machinery | 2 | $37B |
|
||
| Healthcare | 1 | $177B |
|
||
| Pharmaceuticals | 1 | $45B |
|
||
| Metals / Steel | 1 | $18B |
|
||
| Agriculture | 1 | $17B |
|
||
| Packaging | 1 | $12B |
|
||
Price history
+83.4% since first listed38 events — show timeline
- 2026-03-06 Price Changed $219,900 MIBOR as Distributed by MLS Grid
- 2026-02-16 Relisted — MIBOR as Distributed by MLS Grid
- 2026-01-12 Pending — MIBOR as Distributed by MLS Grid
- 2025-12-12 Price Changed $224,900 MIBOR as Distributed by MLS Grid
- 2025-12-03 Relisted — MIBOR as Distributed by MLS Grid
- 2025-10-22 Pending — MIBOR as Distributed by MLS Grid
- 2025-10-15 Relisted — MIBOR as Distributed by MLS Grid
- 2025-08-25 Pending — MIBOR as Distributed by MLS Grid
- 2025-08-14 Price Changed $239,900 MIBOR as Distributed by MLS Grid
- 2025-08-08 Price Changed $244,900 MIBOR as Distributed by MLS Grid
- 2025-07-31 Listed $249,900 MIBOR as Distributed by MLS Grid
- 2023-12-05 Sold (MLS) $240,000 MIBOR as Distributed by MLS Grid
- 2023-11-03 Pending — MIBOR as Distributed by MLS Grid
- 2023-10-31 Price Changed $250,000 MIBOR as Distributed by MLS Grid
- 2023-10-07 Listed $255,000 MIBOR as Distributed by MLS Grid
- 2022-10-27 Listing Removed — MIBOR as Distributed by MLS Grid
- 2022-08-09 Price Changed $255,000 MIBOR as Distributed by MLS Grid
- 2022-06-28 Price Changed $259,977 MIBOR as Distributed by MLS Grid
- 2022-05-17 Price Changed $264,977 MIBOR as Distributed by MLS Grid
- 2022-05-10 Relisted — MIBOR as Distributed by MLS Grid
- 2022-05-01 Pending — MIBOR as Distributed by MLS Grid
- 2022-04-27 Listed $269,977 MIBOR as Distributed by MLS Grid
- 2021-10-27 Listing Removed — MIBOR as Distributed by MLS Grid
- 2021-10-27 Sold (MLS) $245,000 MIBOR as Distributed by MLS Grid
- 2021-08-11 Listed $239,977 MIBOR as Distributed by MLS Grid
- 2017-11-07 Sold (MLS) $118,500 MIBOR as Distributed by MLS Grid
- 2017-10-12 Pending — MIBOR as Distributed by MLS Grid
- 2017-10-03 Relisted — MIBOR as Distributed by MLS Grid
- 2017-09-21 Pending — MIBOR as Distributed by MLS Grid
- 2017-08-02 Price Changed $139,900 MIBOR as Distributed by MLS Grid
- 2017-07-10 Listed $144,900 MIBOR as Distributed by MLS Grid
- 2013-11-06 Listing Removed — MIBOR as Distributed by MLS Grid
- 2013-11-06 Sold (MLS) $88,000 MIBOR as Distributed by MLS Grid
- 2013-05-02 Listed $95,000 MIBOR as Distributed by MLS Grid
- 2006-06-12 Listing Removed — MIBOR as Distributed by MLS Grid
- 2005-12-13 Listed $149,500 MIBOR as Distributed by MLS Grid
- 2003-03-22 Listing Removed — MIBOR as Distributed by MLS Grid
- 2002-09-25 Listed $119,900 MIBOR as Distributed by MLS Grid
Property tax history
+6.4%/yrLatest (2025): $1,606 · -6.1% YoY. Source: county tax records.
Cash-flow waterfall
monthlySold comps — $/sqft
last 12 mo · ≤1 miLoading sold comps…