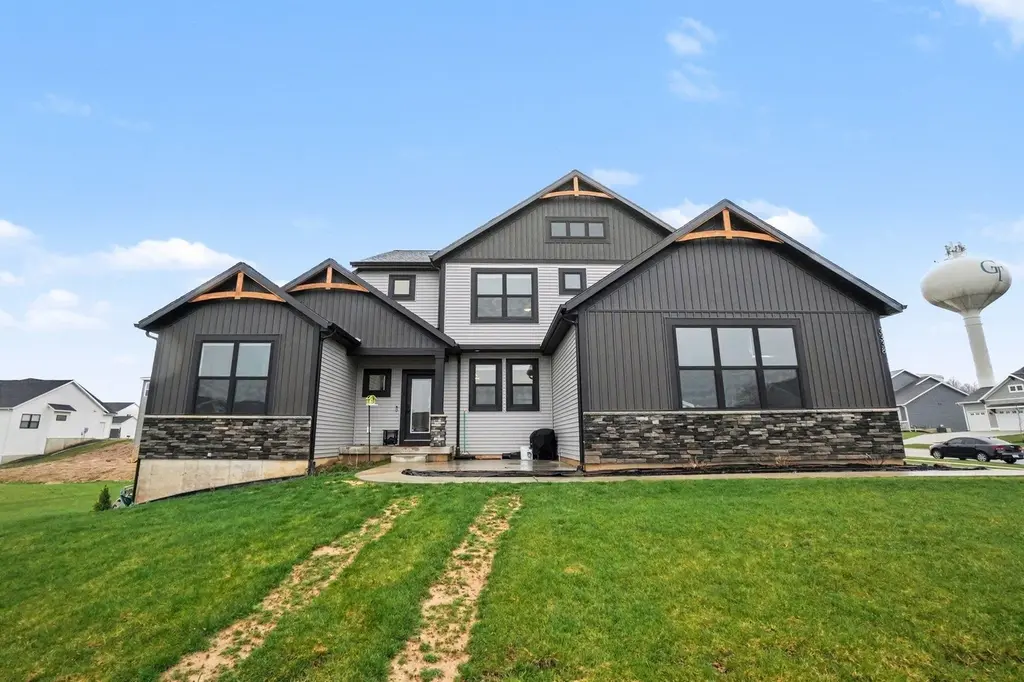
3338 Eagle Peak Dr · Georgetown, MI
Flood risk No data
- FEMA flood zone
- —
- Chance of flooding over 30 yrs
- —
- Est. flood insurance / yr
- —
Fire risk No data
- Est. fire insurance / yr
- —
Heat risk No data
- Hot days now (above threshold)
- —
- Hot days in 30 yrs
- —
Wind risk No data
- Chance of severe wind over 30 yrs
- —
Air-quality risk No data
- Unhealthy air days now
- —
- Unhealthy air days in 30 yrs
- —
Risk factors via First Street. Map © Google.
Why this score? — see what drove the D grade
The composite is a weighted blend of 9 inputs, each scored 0–100. Each bar is that input's sub-score; the figure is the points it added to the 100-point composite (weight × sub-score).
- Cash flow +17.8/30.0
- DSCR +5.6/10.0
- Schools +5.5/10.0
- Condition / age +4.0/5.0
- 1% rule +3.6/10.0
- Rent growth +2.5/5.0
- Livability +2.5/5.0
- ARV discount +0.5/15.0
- Appreciation +0.0/10.0
$699,900
🖨 Deal sheet (PDF) 📄 Offer letter ✓ Due diligence
Listing remarks MLS
Built in 2024, this home has been thoughtfully designed with custom upgrades and modifications throughout. It offers over 3,000 sq ft of finished space, a 3-stall garage, and sits on a 0.42-acre corner lot in a quiet cul-de-sac within the highly desirable Hudsonville School District. The layout is open and functional, with a two-story living space and balcony overlook from upstairs that brings in natural light and keeps the home feeling connected. The kitchen features a large island with seating and a butlers pantry for added storage and prep space. The main floor is set up for everyday ease, with a spacious primary bedroom and main floor laundry. Upstairs, youll find three additional bedrooms and a full bath, along with an open view to the main level below. The finished lower level is designed for entertaining, complete with a theater room (or additional bedroom space depending on use), full bathroom, and a large flex space. Outside, everything is already done-landscaping, underground irrigation, and multiple outdoor living options. Located in the Eagle Ridge neighborhood in Georgetown Township, this move-in ready home offers space, layout, and features that are hard to find
Key facts
- Theater room
- Butlers pantry
- Custom built
Tags
Neighborhood map
What this means for you Summary
Snapshot
- This is a 5-bed/3.5-bath single-family listed at $700k. Condition is rated good.
Deal economics
- At list price, monthly cash flow is $577 ($7k/yr) — positive.
- The deal already cash-flows at list — no discount required.
- To meet the 1% rule (rent ≥ 1% of price), the offer needs to be $600k (14.3% below list).
- Recommended offer: $600k (14.3% below list) — sets the bar for 1% rule.
Location & tenants
- Location reads: area grade D — affects rentability + tenant quality, not the cash-flow math above.
- Hudsonville Public School District (suburban): math 55% / reading 70% proficiency, ranked #32 of 540 in MI (top 6%) — acceptable for families but not a draw, mixed tenant base, ~2y average lease; only 15% free/reduced lunch — higher-income household profile.
- Zoned schools: Georgetown Elementary School (math 67% / reading 74%, grade A-, #70 of 1,397 statewide, top 5%, 581 students, 10% FRL); Baldwin Street Middle School (math 48% / reading 73%, grade B+, #51 of 493 statewide, top 11%, 844 students, 13% FRL); Hudsonville High School (math 52% / reading 68%, grade C+, #73 of 713 statewide, top 11%, 1,513 students, 12% FRL) — zoned schools at 11% FRL track the district average.
- Market conditions: 143 active listings in the ZIP; 1 comparable units currently listed for rent nearby; 1,237 units permitted in Ottawa County in 2024 (443 in 5+ unit buildings).
Forward outlook
- Local home prices are declining (-3.0%/yr); year-one equity from $5k of loan paydown is wiped out by about $21k of value loss. Plan a longer hold.
- Ottawa County population projected at +24% by 2050 — long-run rental-demand tailwind backs the buy-and-hold thesis.
Negotiation context
- It's been on market 49 days — a 3% lower offer ($679k) is reasonable based on typical stale-listing flexibility.
- 3 sale attempts since 2y ago with the ask held roughly flat each time — persistent listings suggest the price (not the market) is what's stuck; bring a comps-based counter.
Questions for the listing agent
- It's been on market 49 days. Have you received any prior offers? Is the seller open to a 14% concession, seller financing, or rate buy-down credit?
- Is there a deadline driving the sale (1031 exchange, divorce, estate, relocation)? That informs how much negotiation room exists.
- The area grade is low — what's the realistic commute time and amenity access for the typical tenant pool here? Any planned neighborhood developments (good or bad) we should know about?
- What's the average days-on-market for RENTAL listings here right now (not sales)? A rising rental-DOM trend means longer vacancies and softer asking-rent achievability than the comps imply.
- What's the recent tenant-quality profile in this submarket — average credit score on applications, eviction rate, late-payment / NSF rate, and stable-employment percentage? A property-management company in the area should have these aggregated.
- How much new for-sale + rental construction is in the pipeline within 1–3 miles? Heavy new supply typically softens prices + rents 12–24 months out; constrained supply supports both.
Investment metrics
- 1% rule
- 0.86% ✗
- Cap rate
- 7.28%
- Cash-on-cash
- 3.53%
- DSCR
- 1.16
- GRM
- 9.7
CMA / ARV
- ARV (median comp)
- $605,698
- List price
- $699,900
- Delta
- 15.55%
- Verdict
- OVERPRICED
- Comps
- 20 within 1.0 mi
Show comp detail 12 sales within ~0.75 mi
| Address | Dist | Beds/Ba | Sqft | Sold | Price | $/sf | Match |
|---|---|---|---|---|---|---|---|
| 3361 Box Elder Dr | 0.30mi | 5/3.5 | 3,452 (+1%) | 1mo | $700,000 | $203 | 83 |
| 3158 Park South Dr | 0.28mi | 5/3.0 | 3,384 (-1%) | 7mo | $540,000 | $160 | 78 |
| 8531 Twin Lakes Dr | 0.38mi | 5/4.0 | 3,384 (-1%) | 4mo | $535,000 | $158 | 76 |
| 3107 Park West Ct | 0.39mi | 5/3.5 | 3,479 (+2%) | 9mo | $530,000 | $152 | 71 |
| 8254 Eagle Peak Dr | 0.05mi | 4/2.5 (-1) | 3,221 (-6%) | 12mo | $614,900 | $191 | 70 |
| 3055 Twin Lakes Dr | 0.36mi | 4/3.5 (-1) | 3,398 (-0%) | 12mo | $610,000 | $180 | 68 |
| 8262 Hunting Ct | 0.49mi | 5/3.5 | 3,321 (-3%) | 13mo | $550,000 | $166 | 62 |
| 8285 Bauerridge Ave | 0.04mi | 4/3.0 (-1) | 2,898 (-15%) | 6mo | $599,900 | $207 | 61 |
| 8232 Park West Dr | 0.25mi | 4/3.5 (-1) | 3,828 (+12%) | 4mo | $675,000 | $176 | 60 |
| 8102 Park West Dr | 0.36mi | 6/3.5 (+1) | 3,683 (+8%) | 8mo | $550,000 | $149 | 58 |
| 7924 Park Ridge Dr SW | 0.54mi | 4/3.5 (-1) | 3,066 (-10%) | 1mo | $509,000 | $166 | 52 |
| 8852 Abbington Dr | 0.69mi | 5/3.5 | 3,196 (-6%) | 13mo | $538,000 | $168 | 47 |
Match score weights: distance 35% · size 25% · config 20% · recency 20%. Top-matched comps best support the ARV.
Projected returns pro-forma
-3.0% appreciation · 3.0% rent growth · sell at horizon
- IRR
- -10.8%
- Equity multiple
- 0.61×
- Total profit
- $-76,997
- Equity at exit
- $104,357
- IRR
- -1.6%
- Equity multiple
- 0.89×
- Total profit
- $-21,054
- Equity at exit
- $60,515
Cash invested: $195,972 (down + closing). Projections, not guarantees.
Landlord ↔ Tenant lean methodology
- Overall (STATE)
- 62 Landlord-Friendly
- State Michigan
- 62 Landlord-Friendly · EVEN
- County
- — inherits STATE
- City
- — inherits STATE
ZIP-level market 49428
- Active inventory
- 143
- Price-to-rent
- 9.7×
Monthly cashflow live
- Estimated rent
- $6,000 medium interval (Pro) →
- Mortgage (P&I)
- −$3,670
- Tax from tax record
- −$201 /mo · $2,414/yr
- Insurance
- −$292
- HOA
- −$0
- Vacancy / Maint / Mgmt
- −$1,260
- Net cashflow
- $577
Break-even live
Sensitivity live
| Price | -10% $973 | -5% $775 | +0% $577 | +5% $379 | +10% $181 |
|---|---|---|---|---|---|
| Rent | -10% $103 | -5% $340 | +0% $577 | +5% $814 | +10% $1,051 |
| Rate | -1.0pp $929 | -0.5pp $755 | base $577 | +0.5pp $395 | +1.0pp $211 |
UW: 25.0% down · 7.5% · 30yr · 1.5% tax · 5.0% vac · 8.0% maint · 8.0% mgmt
Financing live
Cash to close
- Down payment
- $174,975
- Closing costs
- $20,997
- Reserves months
- —
- Total cash needed
- —
Loan-product check · same deal, 3 products live
Conventional
25% down · 7.5% · 30yr
- Down + closing
- —
- Monthly P&I
- —
- Monthly cashflow
- —
- DSCR
- —
- Eligible?
- —
Personal DTI + credit; lowest rate.
DSCR
20% down · 8.5% · 30yr
- Down + closing
- —
- Monthly P&I
- —
- Monthly cashflow
- —
- DSCR
- —
- Eligible?
- —
No personal income docs; deal must DSCR.
Hard money
10% down · 12.0% · 12mo
- Down + closing
- —
- Monthly P&I
- —
- Monthly cashflow
- —
- DSCR
- —
- Eligible?
- —
Short-term bridge; refi at stabilization.
Rent comps 1 comps
| Address | Beds | Baths | Sqft | Rent | $/sqft | DOM | Units | Dist |
|---|---|---|---|---|---|---|---|---|
| 7269 Yellowstone Dr Hudsonville, MI | 4.0 | 3.0 | 2566 | $6,000 | $2.34 | 16d | 1 | 1.41mi |
Listing history 13 events
-
2026-06-01days on market $699,900 Active 49 DOM
-
2026-05-31days on market $699,900 Active 48 DOM
-
2026-04-13$699,900 Active 1195-char remark
Show marketing remark (1195 chars)
Built in 2024, this home has been thoughtfully designed with custom upgrades and modifications throughout. It offers over 3,000 sq ft of finished space, a 3-stall garage, and sits on a 0.42-acre corner lot in a quiet cul-de-sac within the highly desirable Hudsonville School District. The layout is open and functional, with a two-story living space and balcony overlook from upstairs that brings in natural light and keeps the home feeling connected. The kitchen features a large island with seating and a butlers pantry for added storage and prep space. The main floor is set up for everyday ease, with a spacious primary bedroom and main floor laundry. Upstairs, youll find three additional bedrooms and a full bath, along with an open view to the main level below. The finished lower level is designed for entertaining, complete with a theater room (or additional bedroom space depending on use), full bathroom, and a large flex space. Outside, everything is already done-landscaping, underground irrigation, and multiple outdoor living options. Located in the Eagle Ridge neighborhood in Georgetown Township, this move-in ready home offers space, layout, and features that are hard to find
-
2024-06-27status Pending 21-char remark
Show marketing remark (21 chars)
Sold before broadcast
-
2024-06-27status Pending
Show marketing remark (21 chars)
Sold before broadcast
-
2024-06-27historical
Show marketing remark (21 chars)
Sold before broadcast
-
2024-06-27soldstatus $627,735 Sold 21-char remark
Show marketing remark (21 chars)
Sold before broadcast
-
2024-06-27soldstatus $627,735 Sold
Show marketing remark (21 chars)
Sold before broadcast
-
2024-06-25status Pending
Show marketing remark (21 chars)
Sold before broadcast
-
2024-06-25historical 21-char remark
Show marketing remark (21 chars)
Sold before broadcast
-
2024-06-25$627,735 21-char remark
Show marketing remark (21 chars)
Sold before broadcast
-
2024-06-25historical 21-char remark
Show marketing remark (21 chars)
Sold before broadcast
-
2024-06-25$627,735 Active
Show marketing remark (21 chars)
Sold before broadcast
ⓘ Source: listings_history table (triggers on properties + properties_extension) + one-shot
backfill from property_details.listing_events for pre-trigger history.
Tax reassessment forecast MI · Partial reset (capped growth)
- Current annual tax
- $2,414 · $201/mo
- Projected year-2 tax
- $6,596 · $550/mo
- Expected delta
- +$4,182/yr (+$349/mo · 173.2%)
ⓘ Screening estimate from a state-policy table — verify with the county assessor before closing.
Nearby sold comps map
Loading sold comps map…
Walkable amenities ~0.75 mi
Loading nearby amenities…
Taxation est. · year 1
- Rental income
- $72,000
- − Mortgage interest
- −$39,205
- − Property taxes
- −$2,414
- − Insurance
- −$3,500
- − Repairs & maintenance
- −$5,760
- − Management
- −$5,760
- − Depreciation
- −$20,361
- Taxable loss
- −$5,000
- Est. tax savings @ 24.0%
- +$1,200
- After-tax cash flow
- $8,122/yr
For passive investors: Depreciation is non-cash, so a rental often shows a tax loss while cash-flowing — sheltering income. Rental losses are passive: they offset passive income freely, and up to $25,000/yr can offset ordinary (W-2) income if you actively participate and your MAGI is under $100k (phasing out to $0 by $150k); unused losses carry forward. On sale, claimed depreciation is recaptured at up to 25%, and gains may owe capital-gains tax (a 1031 exchange can defer both). Figures are a year-1 estimate at your 24.0% rate — not tax advice; consult a CPA.
Condition & rehab AI · 12 photos
This home is in excellent condition with modern upgrades and a spacious layout, making it a great investment opportunity.
Value-add opportunities
- Both landscaping and curb appeal — enhances curb appeal and adds value
- Both smart home integration — increases home's marketability and convenience
- Both smart thermostat — improves energy efficiency and comfort
Renovation cost estimate screening
Value-add ROI direction
- Both landscaping and curb appeal — enhances curb appeal and adds value ↑
- Both smart home integration — increases home's marketability and convenience ↑
- Both smart thermostat — improves energy efficiency and comfort ↑
ⓘ Cost ranges are severity-bucket heuristics (US national rule-of-thumb). Get contractor quotes + a written scope before underwriting a rehab budget.
Schools (NCES district)
- District
- Hudsonville Public School District
- NCES district ID
- 2618840
- Math proficiency
- 55% ▼ -10.00%
- Reading proficiency
- 70% ▼ -4.00%
- Median HH income
- $69,784
- Composite
- 54.98/100
- National rank
- #1301
- State rank
- #32 of 540 in MI
Livability — Georgetown
No livability data for this city. (Only ~50 U.S. cities are tracked.)
Census & demographics
- Population (ZIP)
- 28,090
Population outlook (Ottawa County) Hauer SSP2
- Today (2025)
- 313,561 people
- By 2030
- 330,027 · +5.3%
- By 2040
- 361,118 · +15.2%
- By 2050
- 388,414 · +23.9%
- By 2075
- 452,175 · +44.2%
- By 2100
- 473,041 · +50.9%
Race, ethnicity, and origin ACS 2023
- Neighborhood character
- Predominantly White (91%)
- Race & ethnicity
- White 91% Hispanic / Latino 4% Two or more races 3% Asian 1%
- Common ancestry
- Iranian 37% Romanian 8% Lithuanian 3%
- Foreign-born
- 2% · Canada, China, South Korea
- Languages at home
- 97% English-only · Spanish 2%
Political lean MEDSL · Ottawa
- 2024 margin
- Strong R (+20.4) · D 39.0% · R 59.5% · Other 1.5%
- 2008→2024 swing
- +3.4pp toward D · 2008: -23.9pp · 2024: -20.4pp
- All cycles
- 2024: R+20.4 2020: R+21.5 2016: R+30.4 2012: R+34.2 2008: R+23.9
Not yet ingested
- Civics
- —
Market trends
- HPI YoY
- ▼ -234.19%
- Current HPI
- 264.7304
- Rent YoY
- —
- Metro
- —
- State GDP YoY
- ▲ 1.37%
- F500 in state
- 28
Industry mix (Fortune 500 HQ in MI)
| Industry | F500 HQs | Revenue |
|---|---|---|
| Automotive Parts | 3 | $48B |
|
||
| Automotive | 2 | $372B |
|
||
| Chemicals | 1 | $45B |
|
||
| Automotive Retail | 1 | $29B |
|
||
| Healthcare / Medical Devices | 1 | $23B |
|
||
| Automotive Technology | 1 | $20B |
|
||
Price history
+11.5% since first listed11 events — show timeline
- 2026-04-13 Listed $699,900 REALCOMP
- 2024-06-27 Pending — REALCOMP
- 2024-06-27 Pending — SW Michigan MLS
- 2024-06-27 Listing Removed — SW Michigan MLS
- 2024-06-27 Sold (MLS) $627,735 SW Michigan MLS
- 2024-06-27 Sold (MLS) $627,735 REALCOMP
- 2024-06-25 Pending — SW Michigan MLS
- 2024-06-25 Listed $627,735 SW Michigan MLS
- 2024-06-25 Listing Removed — REALCOMP
- 2024-06-25 Listed $627,735 REALCOMP
- 2024-06-25 Listing Removed — REALCOMP
Property tax history
+1514.3%/yrLatest (2024): $2,414 · +1514.3% YoY. Source: county tax records.
Cash-flow waterfall
monthlySold comps — $/sqft
last 12 mo · ≤1 miLoading sold comps…