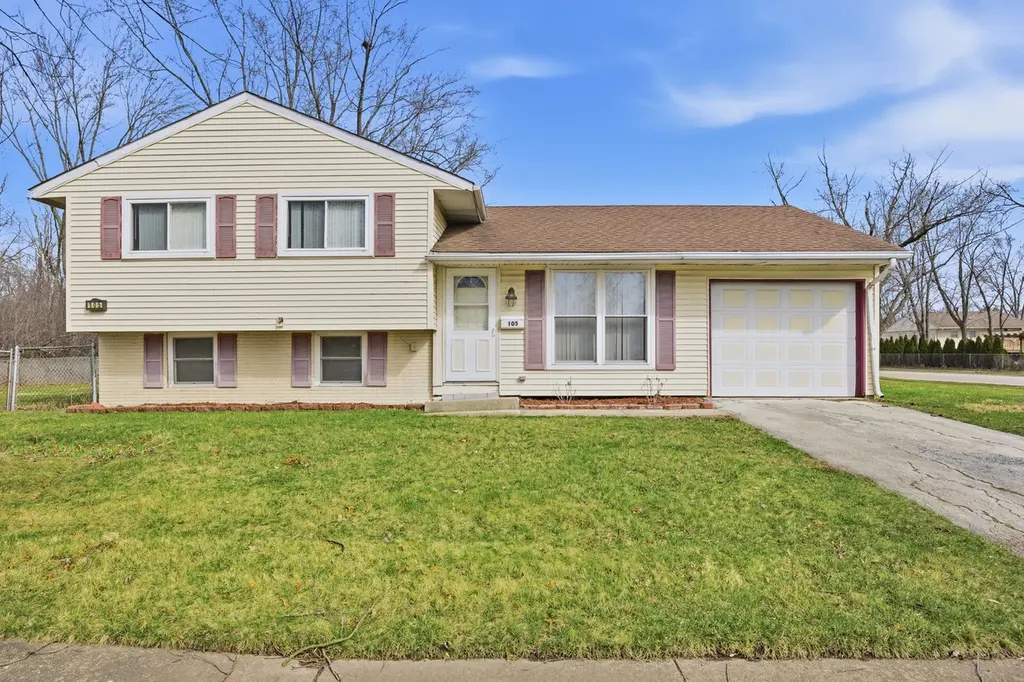
105 E Center St · Glenwood, IL
Flood risk 1/10 · Minimal
- FEMA flood zone
- X (unshaded)
- Chance of flooding over 30 yrs
- 0.0%
- Est. flood insurance / yr
- $507 – $1,088
Fire risk 3/10 · Minor
- Est. fire insurance / yr
- $804 – $1,492
Heat risk 3/10 · Minor
- Hot days now (above 101°F)
- 7 days/yr
- Hot days in 30 yrs
- 15 days/yr
Wind risk 2/10 · Minimal
- Chance of severe wind over 30 yrs
- —
Air-quality risk 2/10 · Minimal
- Unhealthy air days now
- 2 days/yr
- Unhealthy air days in 30 yrs
- 2 days/yr
Risk factors via First Street. Map © Google.
Why this score? — see what drove the B- grade
The composite is a weighted blend of 9 inputs, each scored 0–100. Each bar is that input's sub-score; the figure is the points it added to the 100-point composite (weight × sub-score).
- Cash flow +30.0/30.0
- ARV discount +10.1/15.0
- 1% rule +10.0/10.0
- DSCR +10.0/10.0
- Livability +3.3/5.0
- Rent growth +2.5/5.0
- Condition / age +2.5/5.0
- Schools +0.7/10.0
- Appreciation +0.0/10.0
$160,000
🖨 Deal sheet 📄 Offer letter ✓ Due diligence
Listing remarks
THIS HOME HAS GONE THROUGH A GLOWUP! FRESH PAINT THROUGHOUT THE INTERIOR. NEW PHOTOS TO COME! Welcome to this charming 3 bed/ 1.5 bath home in Glenwood. Upon entering, the cozy Living Room invites you in and opens up to an ample eat-in kitchen. All 3 bedrooms are located on the second floor. The primary bedroom has had a half-bath added! The full bath has been recently updated for you! The family room, located on the lower level, is centered around a beautiful wood-burning fireplace! Perfect for gatherings and entertaining. Newer roof (8 years) new heat thermostat. The sellers have removed a lot of wallpaper!
Key facts
- Half-bath added
- Newer roof
- Eat-in kitchen
Tags
Property features AI
Finance
- Other: Living area sourced from assessor; Parcel number available
- Financial info: Special service area: No
- HOA & community: No master association fee required
Exterior
- Parking: Attached garage (1 garage space, 1 total parking space)
- Utilities: Public water; Public sewer
- Home design: Detached single-family home; Split-level design; Fee simple ownership; Built before 1978 (home is 51–60 years old); Entry facing information not provided
- Construction: Vinyl siding with frame construction; Not rebuilt or rehabilitated
- Exterior features: Corner property location; Lot less than 0.25 acre
Interior
- Kitchen: Kitchen on the main level (about 15 x 11)
- Bedrooms: Three bedrooms total; Master bedroom on the second level (with a half bath); Two additional bedrooms on the second level (each about 12 x 10)
- Bathrooms: One full bathroom; One half bathroom
- Heating & cooling: Natural gas forced air heating; Window air conditioning units
- Interior features: Six total rooms; Crawl space basement; One fireplace in the family room
- Laundry & utility: Laundry room
Neighborhood map
What this means for you Summary
Snapshot
- This is a 3-bed/1.0-bath single-family listed at $160k.
Deal economics
- At list price, monthly cash flow is $674 ($8k/yr) — positive.
- The deal already cash-flows at list — no discount required.
- Meets the 1% rule at list price ($2k rent vs $160k).
- Recommended offer: $150k (6.0% below list) — sets the bar for market timing.
- Cap rate 11.4% vs local median 8.0% in Glenwood — top-decile yield for the area; either an underpriced asset or a hidden risk that comps aren't pricing in. Stress-test before assuming the spread holds.
Location & tenants
- Location reads 66/100 on livability (#545 in IL) — a middle-class / working-renter tenant base. Strengths: cost of living A+, housing A+, employment B; Watch: health & safety D+, schools F, amenities F.
- Bloom Twp Hsd 206 (suburban): math 8% / reading 9% proficiency, ranked #591 of 620 in IL (top 95%) — low school quality limits family demand, transient renter base, plan for 1-2y turnover.
- Market conditions: 53 active listings in the ZIP; 6,272 units permitted in Cook County in 2024 (4,658 in 5+ unit buildings).
Forward outlook
- Local home prices are declining (-3.0%/yr); year-one equity from $1k of loan paydown is wiped out by about $5k of value loss. Plan a longer hold.
- At projected returns (-3.0% appreciation + 3.0% rent growth), your $45k cash investment doubles in ~7 years — after that, you're playing with house money.
Negotiation context
- It's been on market 85 days — a 6% lower offer ($150k) is reasonable based on typical stale-listing flexibility.
Questions for the listing agent
- It's been on market 85 days. Have you received any prior offers? Is the seller open to a 6% concession, seller financing, or rate buy-down credit?
- Built in 1971 — when were the roof, HVAC, electrical panel, plumbing, and water heater last replaced?
- Why hasn't it sold? Are there any deal-killer items the seller is aware of (foundation, flood, title, zoning, code violations)?
- Is there a deadline driving the sale (1031 exchange, divorce, estate, relocation)? That informs how much negotiation room exists.
- Schools are F-rated, which usually means shorter tenancies and higher turnover. Who's the typical renter profile here, and what's been the actual vacancy rate?
- What's the average days-on-market for RENTAL listings here right now (not sales)? A rising rental-DOM trend means longer vacancies and softer asking-rent achievability than the comps imply.
- What's the recent tenant-quality profile in this submarket — average credit score on applications, eviction rate, late-payment / NSF rate, and stable-employment percentage? A property-management company in the area should have these aggregated.
- How much new for-sale + rental construction is in the pipeline within 1–3 miles? Heavy new supply typically softens prices + rents 12–24 months out; constrained supply supports both.
Investment metrics
- 1% rule
- 1.50% ✓
- Cap rate
- 11.35%
- Cash-on-cash
- 18.06%
- DSCR
- 1.80
- GRM
- 5.5
CMA / ARV
- ARV (on-the-fly)
- $169,990
- Comps found
- 12
Show comp detail 12 sales within ~0.75 mi
| Address | Dist | Beds/Ba | Sqft | Sold | Price | $/sf | Match |
|---|---|---|---|---|---|---|---|
| 43 N Oak Ln | 0.13mi | 3/1.0 | 950 (-0%) | 5mo | $162,000 | $171 | 89 |
| 208 E Mulberry Dr | 0.15mi | 3/1.0 | 975 (+2%) | 11mo | $162,500 | $167 | 80 |
| 113 N Rebecca St | 0.26mi | 3/1.5 | 964 (+1%) | 6mo | $182,500 | $189 | 80 |
| 126 N Cedar Ln | 0.17mi | 3/1.0 | 950 (-0%) | 19mo | $178,000 | $187 | 75 |
| 139 N Wabash Ave | 0.37mi | 3/1.0 | 950 (-0%) | 20mo | $166,900 | $176 | 66 |
| 39 N Elm Ln | 0.16mi | 3/1.0 | 1,035 (+8%) | 18mo | $160,000 | $155 | 63 |
| 34 S Chestnut Ct | 0.30mi | 3/1.5 | 1,067 (+12%) | 2mo | $189,900 | $178 | 63 |
| 337 E Rose St | 0.35mi | 4/1.5 (+1) | 993 (+4%) | 10mo | $200,000 | $201 | 62 |
| 117 S Willow Ln | 0.44mi | 3/2.0 | 941 (-2%) | 18mo | $150,000 | $159 | 58 |
| 301 E Maple Dr | 0.32mi | 3/1.5 | 1,067 (+12%) | 13mo | $206,000 | $193 | 53 |
| 330 E Tulip Dr | 0.33mi | 3/1.5 | 1,067 (+12%) | 17mo | $205,000 | $192 | 49 |
| 101 N Walnut Ln | 0.58mi | 4/1.5 (+1) | 1,084 (+14%) | 16mo | $138,000 | $127 | 30 |
Match score weights: distance 35% · size 25% · config 20% · recency 20%. Top-matched comps best support the ARV.
Projected returns pro-forma
-3.0% appreciation · 3.0% rent growth · sell at horizon
- IRR
- 9.7%
- Equity multiple
- 1.38×
- Total profit
- $17,132
- Equity at exit
- $23,857
- IRR
- 18.9%
- Equity multiple
- 2.58×
- Total profit
- $70,666
- Equity at exit
- $13,834
Cash invested: $44,800 (down + closing). Projections, not guarantees.
Landlord ↔ Tenant lean methodology
- Overall (STATE)
- 43 Moderately Tenant-Leaning
- State Illinois
- 43 Moderately Tenant-Leaning · D+7
- County
- — inherits STATE
- City
- — inherits STATE
ZIP-level market 60425
- Home prices YoY
- -10.6%
- Active inventory
- 53
- Price-to-rent
- 5.5×
Monthly cashflow live
- Estimated rent
- $2,403 medium interval (Pro) →
- Mortgage (P&I)
- −$839
- Tax from tax record
- −$318 /mo · $3,816/yr
- Insurance
- −$67
- HOA
- −$0
- Vacancy / Maint / Mgmt
- −$505
- Net cashflow
- $674
Break-even live
UW: 25.0% down · 7.5% · 30yr · 1.5% tax · 5.0% vac · 8.0% maint · 8.0% mgmt
Financing live
Cash to close
- Down payment
- $40,000
- Closing costs
- $4,800
- Reserves months
- —
- Total cash needed
- —
Loan-product check · same deal, 3 products live
Conventional
25% down · 7.5% · 30yr
- Down + closing
- —
- Monthly P&I
- —
- Monthly cashflow
- —
- DSCR
- —
- Eligible?
- —
Personal DTI + credit; lowest rate.
DSCR
20% down · 8.5% · 30yr
- Down + closing
- —
- Monthly P&I
- —
- Monthly cashflow
- —
- DSCR
- —
- Eligible?
- —
No personal income docs; deal must DSCR.
Hard money
10% down · 12.0% · 12mo
- Down + closing
- —
- Monthly P&I
- —
- Monthly cashflow
- —
- DSCR
- —
- Eligible?
- —
Short-term bridge; refi at stabilization.
Listing history 17 events
-
2026-06-18days on market $160,000 Active 85 DOM
-
2026-06-17days on market $160,000 Active 84 DOM
-
2026-06-16days on market $160,000 Active 83 DOM
-
2026-06-15price $160,000 Active 82 DOM
-
2026-06-15days on market $170,000 Active 82 DOM
-
2026-06-13days on market $170,000 Active 80 DOM
-
2026-06-13days on market $170,000 Active 79 DOM
-
2026-06-09days on market $170,000 Active 76 DOM
-
2026-06-08days on market $170,000 Active 75 DOM
-
2026-06-07days on market $170,000 Active 74 DOM
-
2026-06-04days on market $170,000 Active 71 DOM
-
2026-06-03days on market $170,000 Active 70 DOM
-
2026-06-02days on market $170,000 Active 69 DOM
-
2026-06-01days on market $170,000 Active 68 DOM
-
2026-05-31days on market $170,000 Active 67 DOM
-
2026-05-08price $170,000
-
2026-03-25$180,000 Active
ⓘ Source: listings_history table (triggers on properties + properties_extension) + one-shot
backfill from property_details.listing_events for pre-trigger history.
Tax reassessment forecast IL · Partial reset (capped growth)
- Current annual tax
- $3,816 · $318/mo
- Projected year-2 tax
- $3,816 · $318/mo
- Expected delta
- $0/yr ($0/mo · 0.0%)
ⓘ Screening estimate from a state-policy table — verify with the county assessor before closing.
Climate risk First Street
- Flood 1/10 Low FEMA zone X (unshaded) · 0% chance over 30 yrs
- Wildfire 3/10 Moderate
- Heat 3/10 Moderate 7 d/yr ≥101°F today · 15 d/yr by 30 yrs out
- Wind 2/10 Low
- Air quality 2/10 Low 2 unhealthy d/yr today · 2 by 30 yrs out
Nearby sold comps map
Loading sold comps map…
Walkable amenities ~0.75 mi
Loading nearby amenities…
Taxation est. · year 1
- Rental income
- $28,831
- − Mortgage interest
- −$8,962
- − Property taxes
- −$3,816
- − Insurance
- −$800
- − Repairs & maintenance
- −$2,307
- − Management
- −$2,307
- − Depreciation
- −$4,655
- Taxable income
- $5,986
- Est. tax owed @ 24.0%
- −$1,437
- After-tax cash flow
- $6,656/yr
For passive investors: Depreciation is non-cash, so a rental often shows a tax loss while cash-flowing — sheltering income. Rental losses are passive: they offset passive income freely, and up to $25,000/yr can offset ordinary (W-2) income if you actively participate and your MAGI is under $100k (phasing out to $0 by $150k); unused losses carry forward. On sale, claimed depreciation is recaptured at up to 25%, and gains may owe capital-gains tax (a 1031 exchange can defer both). Figures are a year-1 estimate at your 24.0% rate — not tax advice; consult a CPA.
Schools (NCES district)
- District
- Bloom Twp Hsd 206
- NCES district ID
- 1706420
- Math proficiency
- 8% ▼ -3.00%
- Reading proficiency
- 9% ▼ -8.00%
- Median HH income
- $39,795
- Composite
- 7.4/100
- National rank
- #9952
- State rank
- #591 of 620 in IL
Livability — Glenwood
- Score
- 66/100
- State rank
- #545
- US rank
- #11292
Category grades
Schools grade is shown separately in the Schools card above.
Census & demographics
- Census place
- Glenwood, IL
- City population
- 8,730
- Population (ZIP)
- 8,730
Population outlook (Cook County) Hauer SSP2
- Today (2025)
- 5,347,519 people
- By 2030
- 5,357,703 · +0.2%
- By 2040
- 5,324,924 · -0.4%
- By 2050
- 5,230,762 · -2.2%
- By 2075
- 4,785,735 · -10.5%
- By 2100
- 4,188,836 · -21.7%
Race, ethnicity, and origin ACS 2023
- Neighborhood character
- Predominantly Black (68%)
- Race & ethnicity
- Black 68% White 22% Hispanic / Latino 6% Two or more races 4%
- Hispanic origin (detail)
- Mexican 5%
- Common ancestry
- Romanian 3% Iranian 1% Lithuanian 1%
- Foreign-born
- 3% · Canada
- Languages at home
- 95% English-only · Spanish 4%
Political lean MEDSL · Cook
- 2024 margin
- Solid D (+42.0) · D 70.4% · R 28.4% · Other 1.2%
- 2008→2024 swing
- -11.4pp toward R · 2008: 53.4pp · 2024: 42.0pp
- All cycles
- 2024: D+42.0 2020: D+50.3 2016: D+53.0 2012: D+49.4 2008: D+53.4
Not yet ingested
- Civics
- —
Market trends
- HPI YoY
- ▼ -37.24%
- Current HPI
- 314.1777
- Rent YoY
- —
- Metro
- —
- State GDP YoY
- ▲ 1.59%
- F500 in state
- 60
Industry mix (Fortune 500 HQ in IL)
| Industry | F500 HQs | Revenue |
|---|---|---|
| Insurance | 4 | $201B |
|
||
| Consumer Goods | 4 | $87B |
|
||
| Industrial Machinery | 3 | $64B |
|
||
| Healthcare | 2 | $55B |
|
||
| Retail / Pharmacy | 1 | $148B |
|
||
| Agriculture / Food | 1 | $86B |
|
||
Price history
-5.6% since first listed2 events — show timeline
- 2026-05-08 Price Changed $170,000 MRED as Distributed by MLS Grid
- 2026-03-25 Listed $180,000 MRED as Distributed by MLS Grid
Property tax history
+4.9%/yrLatest (2023): $3,816 · +170.4% YoY. Source: county tax records.
Cash-flow waterfall
monthlySold comps — $/sqft
last 12 mo · ≤1 miLoading sold comps…