2464 N Maple Ave · Decatur, IL
Flood risk 1/10 · Minimal
- FEMA flood zone
- X (unshaded)
- Chance of flooding over 30 yrs
- 0.0%
- Est. flood insurance / yr
- $473 – $860
Fire risk 1/10 · Minimal
- Est. fire insurance / yr
- $804 – $1,492
Heat risk 3/10 · Minor
- Hot days now (above 105°F)
- 7 days/yr
- Hot days in 30 yrs
- 19 days/yr
Wind risk 2/10 · Minimal
- Chance of severe wind over 30 yrs
- 2.0%
Air-quality risk 2/10 · Minimal
- Unhealthy air days now
- 1 days/yr
- Unhealthy air days in 30 yrs
- 1 days/yr
Risk factors via First Street. Map © Google.
Why this score? — see what drove the B grade
The composite is a weighted blend of 9 inputs, each scored 0–100. Each bar is that input's sub-score; the figure is the points it added to the 100-point composite (weight × sub-score).
- Cash flow +28.3/30.0
- ARV discount +12.5/15.0
- DSCR +10.0/10.0
- 1% rule +8.4/10.0
- Appreciation +3.9/10.0
- Livability +3.0/5.0
- Rent growth +2.5/5.0
- Condition / age +2.5/5.0
- Schools +0.4/10.0
$85,000
🖨 Deal sheet 📄 Offer letter ✓ Due diligence
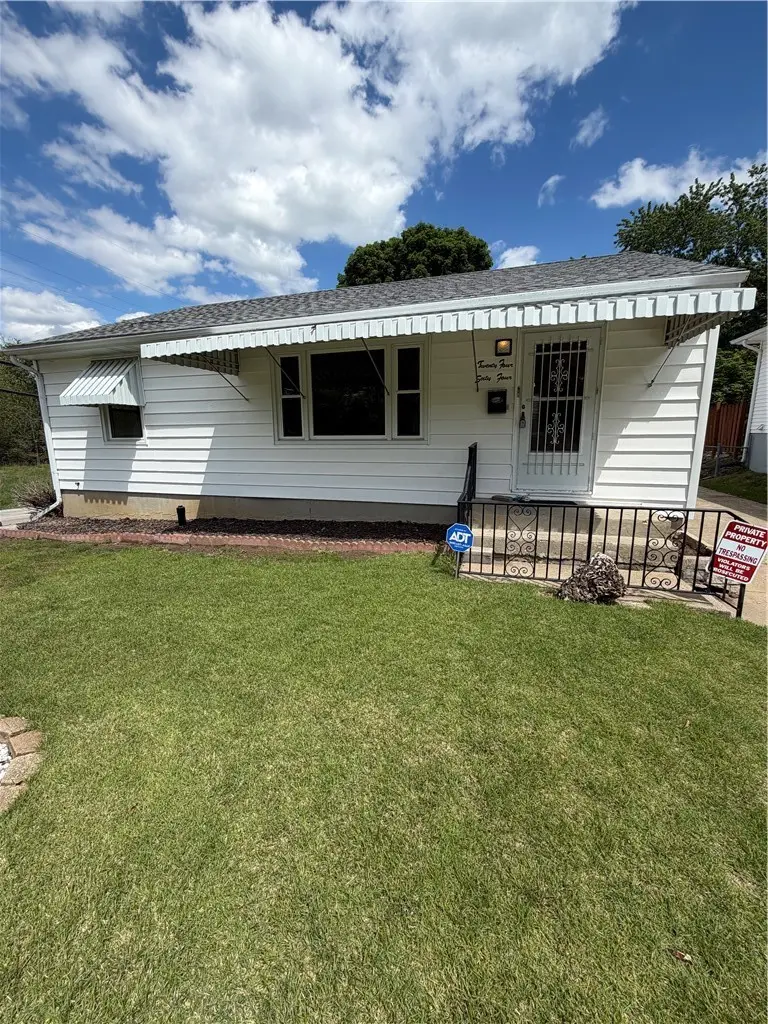
Listing remarks
This cute, corner lot, 3 bed 2 bath, near north property is ready for its next chapter! This property has hardwood floors in the living room and bedrooms, fenced in yard, a 1.5 detached garage with plenty of storage and an additional shed. Newer windows throughout Enjoy your morning in the covered patio. Quiet established neighborhood near DMH. Schedule a showing today!
Key facts
- 6,875 sq ft lot
- Garage
- Built 1957
Property features AI
Exterior
- Parking: Detached garage (1 car)
- Utilities: Public water; Public sewer
- Home design: Single family residence; One level
- Construction: Vinyl siding; Shingle roof; Built as one-story with finished lower level
- Exterior features: Fenced yard; Concrete road access; Shed(s)
Interior
- Kitchen: Oven; Range; Refrigerator
- Bathrooms: 2 full bathrooms
- Heating & cooling: Forced air heating; Central air conditioning
- Interior features: Finished full basement; 7 total rooms
- Laundry & utility: Gas water heater
Neighborhood map
What this means for you Summary
Snapshot
- This is a 3-bed/1.0-bath single-family listed at $85k.
Deal economics
- At list price, monthly cash flow is $273 ($3k/yr) — positive.
- The deal already cash-flows at list — no discount required.
- Meets the 1% rule at list price ($1k rent vs $85k).
- Recommended offer: $82k (3.0% below list) — sets the bar for market timing.
- Cap rate 10.1% vs local median 7.0% in Decatur — top-decile yield for the area; either an underpriced asset or a hidden risk that comps aren't pricing in. Stress-test before assuming the spread holds.
Location & tenants
- Location reads 59/100 on livability (#1,076 in IL) — a working-class tenant base; expect higher turnover. Strengths: cost of living A+, housing A+; Watch: schools F, crime F, amenities F.
- Decatur SD 61 (urban): math 3% / reading 6% proficiency, ranked #605 of 620 in IL (top 98%) — low school quality limits family demand, transient renter base, plan for 1-2y turnover; 73% free/reduced lunch — lower-income household profile, screen leases tightly.
- Market conditions: 135 active listings in the ZIP; 10 comparable units currently listed for rent nearby; rentals lingering (median 44d on market — plan ~5-8 weeks vacancy on turnover, expect pricing pressure); 90% of comp listings sitting > 30 days — soft ceiling on asking rent; 63 units permitted in Macon County in 2024 (0 in 5+ unit buildings).
Forward outlook
- Local home prices are declining (-2.2%/yr); year-one equity from $588 of loan paydown is wiped out by about $2k of value loss. Plan a longer hold.
- Macon County population projected at -24% by 2050 — secular population decline; favor cash flow + early exit over multi-decade hold.
- At projected returns (-2.2% appreciation + 3.0% rent growth), your $24k cash investment doubles in ~8 years — after that, you're playing with house money.
Negotiation context
- It's been on market 43 days — a 3% lower offer ($82k) is reasonable based on typical stale-listing flexibility.
Risks & watch-outs
- Watch-outs: built in 1957 — expect roof / HVAC / electrical / plumbing capex.
Questions for the listing agent
- It's been on market 43 days. Have you received any prior offers? Is the seller open to a 3% concession, seller financing, or rate buy-down credit?
- Built in 1957 — when were the roof, HVAC, electrical panel, plumbing, and water heater last replaced?
- Is there a deadline driving the sale (1031 exchange, divorce, estate, relocation)? That informs how much negotiation room exists.
- Schools are F-rated, which usually means shorter tenancies and higher turnover. Who's the typical renter profile here, and what's been the actual vacancy rate?
- Crime grade is F in this area — have there been break-ins, vandalism, or insurance claims at this property in the last 3 years? What carrier currently insures it and at what premium?
- What's the average days-on-market for RENTAL listings here right now (not sales)? A rising rental-DOM trend means longer vacancies and softer asking-rent achievability than the comps imply.
- What's the recent tenant-quality profile in this submarket — average credit score on applications, eviction rate, late-payment / NSF rate, and stable-employment percentage? A property-management company in the area should have these aggregated.
- How much new for-sale + rental construction is in the pipeline within 1–3 miles? Heavy new supply typically softens prices + rents 12–24 months out; constrained supply supports both.
Investment metrics
- 1% rule
- 1.34% ✓
- Cap rate
- 10.15%
- Cash-on-cash
- 13.77%
- DSCR
- 1.61
- GRM
- 6.2
CMA / ARV
- ARV (median comp)
- $95,702
- List price
- $85,000
- Delta
- -11.18%
- Verdict
- UNDERPRICED
- Comps
- 20 within 1.0 mi
Show comp detail 12 sales within ~0.75 mi
| Address | Dist | Beds/Ba | Sqft | Sold | Price | $/sf | Match |
|---|---|---|---|---|---|---|---|
| 18 Maple Ct | 0.22mi | 2/1.5 (-1) | 1,040 (+3%) | 1mo | $105,000 | $101 | 77 |
| 777 W Harper Ave | 0.34mi | 2/1.0 (-1) | 1,003 (-0%) | 2mo | $88,000 | $88 | 77 |
| 67 Maple Ct | 0.19mi | 2/1.0 (-1) | 952 (-6%) | 1mo | $64,500 | $68 | 76 |
| 377 Burtschi Ct | 0.53mi | 3/1.0 | 1,001 (-1%) | 3mo | $25,000 | $25 | 72 |
| 17 West Dr | 0.74mi | 2/1.0 (-1) | 1,008 (0%) | 4mo | $40,000 | $40 | 57 |
| 36 N Lynette Dr | 0.74mi | 3/1.0 | 1,056 (+5%) | 2mo | $142,000 | $134 | 56 |
| 1915 Monroe St | 0.52mi | 2/1.0 (-1) | 1,064 (+6%) | 7mo | $47,500 | $45 | 55 |
| 2148 N Graceland Ave | 0.34mi | 2/1.0 (-1) | 864 (-14%) | 3mo | $37,000 | $43 | 53 |
| 2238 Water St | 0.65mi | 3/1.0 | 924 (-8%) | 5mo | $77,500 | $84 | 52 |
| 685 W Division St | 0.73mi | 2/1.5 (-1) | 1,000 (-1%) | 12mo | $30,000 | $30 | 47 |
| 1920 Gebhart Ct | 0.54mi | 2/1.0 (-1) | 873 (-13%) | 4mo | $52,000 | $60 | 44 |
| 933 W Division St | 0.75mi | 3/1.0 | 1,134 (+12%) | 7mo | $46,500 | $41 | 38 |
Match score weights: distance 35% · size 25% · config 20% · recency 20%. Top-matched comps best support the ARV.
Projected returns pro-forma
-2.21% appreciation · 3.0% rent growth · sell at horizon
- IRR
- 6.6%
- Equity multiple
- 1.27×
- Total profit
- $6,481
- Equity at exit
- $15,680
- IRR
- 14.7%
- Equity multiple
- 2.29×
- Total profit
- $30,691
- Equity at exit
- $12,619
Cash invested: $23,800 (down + closing). Projections, not guarantees.
Landlord ↔ Tenant lean methodology
- Overall (STATE)
- 43 Moderately Tenant-Leaning
- State Illinois
- 43 Moderately Tenant-Leaning · D+7
- County
- — inherits STATE
- City
- — inherits STATE
ZIP-level market 62526
- Home prices YoY
- -1.2%
- Active inventory
- 135
- Price-to-rent
- 6.2×
Monthly cashflow live
- Estimated rent
- $1,137 high interval (Pro) →
- Mortgage (P&I)
- −$446
- Tax from tax record
- −$144 /mo · $1,729/yr
- Insurance
- −$35
- HOA
- −$0
- Vacancy / Maint / Mgmt
- −$239
- Net cashflow
- $273
Break-even live
UW: 25.0% down · 7.5% · 30yr · 1.5% tax · 5.0% vac · 8.0% maint · 8.0% mgmt
Financing live
Cash to close
- Down payment
- $21,250
- Closing costs
- $2,550
- Reserves months
- —
- Total cash needed
- —
Loan-product check · same deal, 3 products live
Conventional
25% down · 7.5% · 30yr
- Down + closing
- —
- Monthly P&I
- —
- Monthly cashflow
- —
- DSCR
- —
- Eligible?
- —
Personal DTI + credit; lowest rate.
DSCR
20% down · 8.5% · 30yr
- Down + closing
- —
- Monthly P&I
- —
- Monthly cashflow
- —
- DSCR
- —
- Eligible?
- —
No personal income docs; deal must DSCR.
Hard money
10% down · 12.0% · 12mo
- Down + closing
- —
- Monthly P&I
- —
- Monthly cashflow
- —
- DSCR
- —
- Eligible?
- —
Short-term bridge; refi at stabilization.
Rent comps 10 comps
| Address | Beds | Baths | Sqft | Rent | $/sqft | DOM | Units | Dist |
|---|---|---|---|---|---|---|---|---|
| 2148 N Graceland Ave Decatur, IL | 2.0 | 1.0 | 864 | $1,195 | $1.38 | 43d | 1 | 0.33mi |
| 1908 N Union St Decatur, IL | 2.0 | 1.0 | 704 | $899 | $1.28 | 43d | 1 | 0.64mi |
| 644 W Division St Decatur, IL | 3.0 | 2.0 | 1365 | $1,200 | $0.88 | 43d | 1 | 0.70mi |
| 510 E Pierson Ave Decatur, IL | 3.0 | 1.0 | 895 | $1,200 | $1.34 | 43d | 1 | 0.81mi |
| 1311 N Walnut Grove Ave Decatur, IL | 2.0 | 1.0 | 781 | $1,100 | $1.41 | 43d | 1 | 1.00mi |
| 1245 N Union St Decatur, IL | 3.0 | 2.0 | 1111 | $995 | $0.90 | 43d | 1 | 1.07mi |
| 1345 N Fairview Ave Decatur, IL | 3.0 | 1.0 | 785 | $985 | $1.25 | 43d | 1 | 1.14mi |
| 927 E Harrison Ave Decatur, IL | 2.0 | 1.0 | 720 | $675 | $0.94 | 20d | 1 | 1.17mi |
| 1045 N Monroe St Decatur, IL | 3.0 | 2.0 | 1094 | $1,000 | $0.91 | 43d | 1 | 1.19mi |
| 853 N College St Decatur, IL | 2.0 | 1.0 | 936 | $925 | $0.99 | 43d | 1 | 1.37mi |
Listing history 17 events
-
2026-06-19days on market $85,000 Active 43 DOM
-
2026-06-18days on market $85,000 Active 42 DOM
-
2026-06-17days on market $85,000 Active 41 DOM
-
2026-06-16days on market $85,000 Active 40 DOM
-
2026-06-15days on market $85,000 Active 39 DOM
-
2026-06-14days on market $85,000 Active 37 DOM
-
2026-06-13pricedays on market $85,000 Active 36 DOM
-
2026-06-10days on market $87,500 Active 34 DOM
-
2026-06-09days on market $87,500 Active 33 DOM
-
2026-06-08days on market $87,500 Active 32 DOM
-
2026-06-07days on market $87,500 Active 31 DOM
-
2026-06-05days on market $87,500 Active 28 DOM
-
2026-06-02days on market $87,500 Active 26 DOM
-
2026-06-01days on market $87,500 Active 25 DOM
-
2026-05-31days on market $87,500 Active 24 DOM
-
2026-05-30days on market $87,500 Active 23 DOM
-
2026-05-07$89,999 Active 372-char remark
ⓘ Source: listings_history table (triggers on properties + properties_extension) + one-shot
backfill from property_details.listing_events for pre-trigger history.
Tax reassessment forecast IL · Partial reset (capped growth)
- Current annual tax
- $1,729 · $144/mo
- Projected year-2 tax
- $1,829 · $152/mo
- Expected delta
- +$100/yr (+$8/mo · 5.8%)
ⓘ Screening estimate from a state-policy table — verify with the county assessor before closing.
Climate risk First Street
- Flood 1/10 Low FEMA zone X (unshaded) · 0% chance over 30 yrs
- Wildfire 1/10 Low
- Heat 3/10 Moderate 7 d/yr ≥105°F today · 19 d/yr by 30 yrs out
- Wind 2/10 Low 2% chance of damaging wind over 30 yrs
- Air quality 2/10 Low 1 unhealthy d/yr today · 1 by 30 yrs out
Nearby sold comps map
Loading sold comps map…
Walkable amenities ~0.75 mi
Loading nearby amenities…
Taxation est. · year 1
- Rental income
- $13,645
- − Mortgage interest
- −$4,761
- − Property taxes
- −$1,729
- − Insurance
- −$425
- − Repairs & maintenance
- −$1,092
- − Management
- −$1,092
- − Depreciation
- −$2,473
- Taxable income
- $2,073
- Est. tax owed @ 24.0%
- −$498
- After-tax cash flow
- $2,779/yr
For passive investors: Depreciation is non-cash, so a rental often shows a tax loss while cash-flowing — sheltering income. Rental losses are passive: they offset passive income freely, and up to $25,000/yr can offset ordinary (W-2) income if you actively participate and your MAGI is under $100k (phasing out to $0 by $150k); unused losses carry forward. On sale, claimed depreciation is recaptured at up to 25%, and gains may owe capital-gains tax (a 1031 exchange can defer both). Figures are a year-1 estimate at your 24.0% rate — not tax advice; consult a CPA.
Schools (NCES district)
- District
- Decatur SD 61
- NCES district ID
- 1711850
- Math proficiency
- 3% ▼ -4.00%
- Reading proficiency
- 6% ▼ -6.00%
- Median HH income
- $38,864
- Composite
- 3.99/100
- National rank
- #10059
- State rank
- #605 of 620 in IL
Livability — Decatur
- Score
- 59/100
- State rank
- #1076
- US rank
- #20533
Category grades
Schools grade is shown separately in the Schools card above.
Census & demographics
- Census place
- Decatur, IL
- County
- Macon County · 78,333 people
- City population
- 78,333
- Metro
- Decatur, IL
- Population (ZIP)
- 30,483
- Household income
- $49,062
- Rent vs Own
- Severe rent burden
- 1041.0
Population outlook (Macon County) Hauer SSP2
- Today (2025)
- 99,568 people
- By 2030
- 94,973 · -4.6%
- By 2040
- 85,250 · -14.4%
- By 2050
- 75,920 · -23.8%
- By 2075
- 55,962 · -43.8%
- By 2100
- 36,468 · -63.4%
Race, ethnicity, and origin ACS 2023
- Neighborhood character
- Predominantly White (68%)
- Race & ethnicity
- White 68% Black 22% Two or more races 6% Hispanic / Latino 3% Asian 2%
- Common ancestry
- Lithuanian 2% Italian 2% Slovak 2%
- Foreign-born
- 4% · Canada
- Languages at home
- 95% English-only · Spanish 2% Other Indo-European 1%
Political lean MEDSL · Macon
- 2024 margin
- R (+18.9) · D 39.8% · R 58.7% · Other 1.4%
- 2008→2024 swing
- -20.0pp toward R · 2008: 1.1pp · 2024: -18.9pp
- All cycles
- 2024: R+18.9 2020: R+17.7 2016: R+18.1 2012: R+5.2 2008: D+1.1
Not yet ingested
- Civics
- —
Market trends
- HPI YoY
- ▼ -2.21%
- Current HPI
- 182.871
- Rent YoY
- —
- Metro
- Decatur, IL
- State GDP YoY
- ▲ 1.59%
- F500 in state
- 60
Industry mix (Fortune 500 HQ in IL)
| Industry | F500 HQs | Revenue |
|---|---|---|
| Insurance | 4 | $201B |
|
||
| Consumer Goods | 4 | $87B |
|
||
| Industrial Machinery | 3 | $64B |
|
||
| Healthcare | 2 | $55B |
|
||
| Retail / Pharmacy | 1 | $148B |
|
||
| Agriculture / Food | 1 | $86B |
|
||
Price history
-5.6% since first listed3 events — show timeline
- 2026-06-12 Price Changed $85,000 CIBR
- 2026-05-28 Price Changed $87,500 CIBR
- 2026-05-07 Listed $89,999 CIBR
Property tax history
+2.6%/yrLatest (2024): $1,729 · +2.1% YoY. Source: county tax records.
Cash-flow waterfall
monthlySold comps — $/sqft
last 12 mo · ≤1 miLoading sold comps…