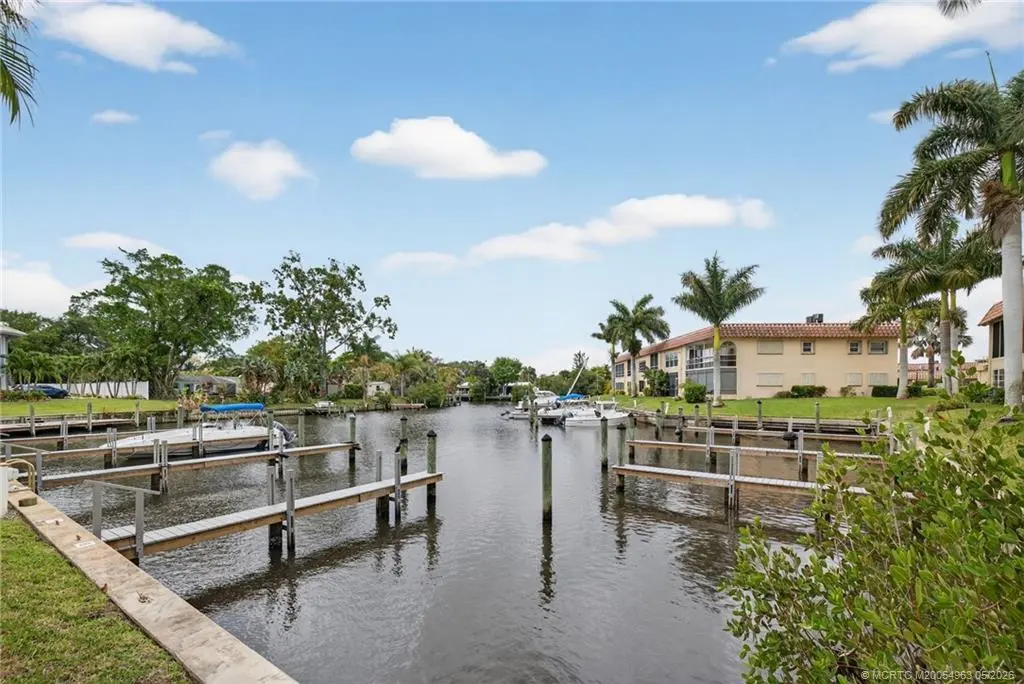
2600 S Kanner Hwy Unit A5 · Stuart, FL
Flood risk 6/10 · Moderate
- FEMA flood zone
- X (shaded)
- Chance of flooding over 30 yrs
- 0.72%
- Est. flood insurance / yr
- $507 – $1,088
Fire risk 1/10 · Minimal
- Est. fire insurance / yr
- $947 – $1,759
Heat risk 10/10 · Severe
- Hot days now (above 106°F)
- 7 days/yr
- Hot days in 30 yrs
- 22 days/yr
Wind risk 10/10 · Severe
- Chance of severe wind over 30 yrs
- 99.0%
Air-quality risk 2/10 · Minimal
- Unhealthy air days now
- 1 days/yr
- Unhealthy air days in 30 yrs
- 1 days/yr
Risk factors via First Street. Map © Google.
Why this score? — see what drove the C grade
The composite is a weighted blend of 9 inputs, each scored 0–100. Each bar is that input's sub-score; the figure is the points it added to the 100-point composite (weight × sub-score).
- Cash flow +22.4/30.0
- 1% rule +7.6/10.0
- ARV discount +7.5/15.0
- DSCR +7.2/10.0
- Schools +4.5/10.0
- Livability +4.2/5.0
- Condition / age +2.5/5.0
- Rent growth +2.3/5.0
- Appreciation +0.0/10.0
$165,000
🖨 Deal sheet 📄 Offer letter ✓ Due diligence
Listing remarks
PRICED BELOW MARKET VALUE. Live the Florida life in this FIRST FLOOR waterfront condo! This 2/2 has ample living space, an open kitchen, two full bathrooms and nicely sized bedrooms. It is just waiting for you to come put your personal touch on it and make it your Florida home! De La Bahia is an active 55+ community with a clubhouse, pool, social activities and a boating lifestyle! An amazing value, the condo fee includes common areas, roofs, exterior maintenance, amenities, cable, water/sewer and trash. It is also located near plenty of dining and shopping (many in walking distance) and a short drive to the beaches. If you've been dreaming of Florida, this is for you!
Key facts
- Dining and shopping
- Clubhouse
- Active 55+ community
Tags
Property features AI
Finance
- Financial info: Pets allowed with limits on number and size
- HOA & community: Homeowners association with a monthly fee; Association fee covers management, common areas, cable TV, insurance, grounds maintenance, structure maintenance, parking, recreation facilities, reserve fund, road maintenance, sewer, trash, and water; Community features include barbecue, boat facilities, billiard room, bicycle storage, clubhouse, dock, library, non-gated access, park, pool, shuffleboard, and marina; Senior community; 12 units in the community
Exterior
- Parking: Assigned parking; Guest parking
- Utilities: Cable available; Public water connected; Public sewer connected
- Home design: 2-story property; Resale
- Construction: Block and concrete construction; Built-up / tar and gravel roof
- Exterior features: Community pool; Canal access; Ocean access; Waterfront; Has a view; Private road frontage
Interior
- Kitchen: Dishwasher; Electric range; Microwave; Refrigerator
- Bathrooms: 2 full bathrooms
- Heating & cooling: Central heating (electric, individual controls); Central air conditioning (electric)
- Interior features: Unfurnished; Separate shower; Walk-in closet(s)
- Laundry & utility: Washer; Dryer
Neighborhood map
What this means for you Summary
Snapshot
- This is a 2-bed/1.5-bath condo listed at $165k.
Deal economics
- At list price, monthly cash flow is $274 ($3k/yr) — positive.
- The deal already cash-flows at list — no discount required.
- Meets the 1% rule at list price ($2k rent vs $165k).
- Recommended offer: $160k (3.0% below list) — sets the bar for market timing.
- Cap rate 8.3% vs local median 4.1% in Stuart — top-decile yield for the area; either an underpriced asset or a hidden risk that comps aren't pricing in. Stress-test before assuming the spread holds.
Location & tenants
- Location reads 84/100 on livability (#39 in FL, #790 nationally) — a professional / high-income tenant draw. Strengths: commute A+, housing A+, health & safety A+; Watch: crime C-, employment C-, amenities D.
- Martin (suburban): math 52% / reading 53% proficiency, ranked #24 of 73 in FL (top 33%) — acceptable for families but not a draw, mixed tenant base, ~2y average lease.
- Market conditions: Rents soft (-0.7%/yr); 256 active listings in the ZIP; 32 comparable units currently listed for rent nearby; rentals at typical pace (median 24d on market — plan ~3-4 weeks tenant-placement turnaround); 737 units permitted in Martin County in 2024 (167 in 5+ unit buildings).
- This rent runs 40% of the median local income ($63k/yr) — at the standard rent-burdened threshold; future hikes will face affordability resistance.
Forward outlook
- Local home prices are declining (-3.0%/yr); year-one equity from $1k of loan paydown is wiped out by about $5k of value loss. Plan a longer hold.
- Martin County population projected at +19% by 2050 — long-run rental-demand tailwind backs the buy-and-hold thesis.
Negotiation context
- It's been on market 59 days — a 3% lower offer ($160k) is reasonable based on typical stale-listing flexibility.
- 8 sale attempts since 28y ago; this cycle's ask has dropped $25k (13%) from the opening price — seller is motivated, your offer sets the floor, not the list.
- Current owner paid $68k; list at $165k implies a 143% gain — meaningful room to come down on a strong offer.
Risks & watch-outs
- Climate carrying-cost: major flood risk; severe wind risk, 99% chance of damaging wind over 30y; extreme-heat days projected 7→22/yr by 2055 (HVAC capex compounding) — expect insurance premiums to compound above CPI over the hold.
Questions for the listing agent
- It's been on market 59 days. Have you received any prior offers? Is the seller open to a 3% concession, seller financing, or rate buy-down credit?
- Built in 1972 — when were the roof, HVAC, electrical panel, plumbing, and water heater last replaced?
- What does the HOA fee cover, when was the last increase, and are there any pending special assessments or reserve-fund shortfalls?
- Any open or pending special assessments — roof, HVAC, plumbing, elevator, façade? What's the per-unit balance and payoff schedule, and is the seller paying it off at close or rolling it to the buyer?
- Is there a deadline driving the sale (1031 exchange, divorce, estate, relocation)? That informs how much negotiation room exists.
- Schools are A-rated — typically a magnet for longer-tenancy family renters. What's the average tenant stay here, and is there a school-zone premium baked into asking?
- What's the average days-on-market for RENTAL listings here right now (not sales)? A rising rental-DOM trend means longer vacancies and softer asking-rent achievability than the comps imply.
- What's the recent tenant-quality profile in this submarket — average credit score on applications, eviction rate, late-payment / NSF rate, and stable-employment percentage? A property-management company in the area should have these aggregated.
- How much new apartment / multifamily construction is in the pipeline within 1–3 miles? Heavy new supply (>2% of stock underway) typically softens rents 12–24 months out; light construction supports rent growth.
Investment metrics
- 1% rule
- 1.26% ✓
- Cap rate
- 8.29%
- Cash-on-cash
- 7.12%
- DSCR
- 1.32
- GRM
- 6.6
CMA / ARV
No comps found within radius.
Projected returns pro-forma
-3.0% appreciation · 0.0% rent growth · sell at horizon
- IRR
- -9.3%
- Equity multiple
- 0.67×
- Total profit
- $-15,208
- Equity at exit
- $24,602
- IRR
- -5.4%
- Equity multiple
- 0.71×
- Total profit
- $-13,623
- Equity at exit
- $14,266
Cash invested: $46,200 (down + closing). Projections, not guarantees.
Landlord ↔ Tenant lean methodology
- Overall (STATE)
- 87 Strongly Landlord-Friendly
- State Florida
- 87 Strongly Landlord-Friendly · R+3
- County
- — inherits STATE
- City
- — inherits STATE
ZIP-level market 34994
- Home prices YoY
- -27.1%
- Rents YoY
- -0.7%
- Active inventory
- 256
- Price-to-rent
- 6.6×
Monthly cashflow live
- Estimated rent
- $2,079 high interval (Pro) →
- Mortgage (P&I)
- −$865
- Tax from tax record
- −$44 /mo · $534/yr
- Insurance
- −$69
- HOA
- −$390
- Vacancy / Maint / Mgmt
- −$437
- Net cashflow
- $274
Break-even live
UW: 25.0% down · 7.5% · 30yr · 1.5% tax · 5.0% vac · 8.0% maint · 8.0% mgmt
Financing live
Cash to close
- Down payment
- $41,250
- Closing costs
- $4,950
- Reserves months
- —
- Total cash needed
- —
Loan-product check · same deal, 3 products live
Conventional
25% down · 7.5% · 30yr
- Down + closing
- —
- Monthly P&I
- —
- Monthly cashflow
- —
- DSCR
- —
- Eligible?
- —
Personal DTI + credit; lowest rate.
DSCR
20% down · 8.5% · 30yr
- Down + closing
- —
- Monthly P&I
- —
- Monthly cashflow
- —
- DSCR
- —
- Eligible?
- —
No personal income docs; deal must DSCR.
Hard money
10% down · 12.0% · 12mo
- Down + closing
- —
- Monthly P&I
- —
- Monthly cashflow
- —
- DSCR
- —
- Eligible?
- —
Short-term bridge; refi at stabilization.
Rent comps 32 comps
| Address | Beds | Baths | Sqft | Rent | $/sqft | DOM | Units | Dist |
|---|---|---|---|---|---|---|---|---|
| 2600 S Kanner Hwy Stuart, FL | 1.0–2.0 | 1.5–2.0 | 890 | $1,950 | $2.19 | 14d | 3 | 0.08mi |
| 1950 SW Palm City Rd Stuart, FL | 2.0 | 2.0 | 1031 | $3,150 | $3.05 | 23d | 3 | 0.44mi |
| 1950 SW Palm City Rd Unit 4-4205 Stuart, FL | 2.0 | 2.0 | 938 | $2,400 | $2.56 | 14d | 1 | 0.45mi |
| 1900 S Kanner Hwy Unit 2-203 Stuart, FL | 2.0 | 2.0 | 1086 | $1,800 | $1.66 | 14d | 1 | 0.57mi |
| 2819 SW Cornell Ave Palm City, FL | 2.0 | 1.5 | 1060 | $2,150 | $2.03 | 21d | 1 | 0.59mi |
| 400 SE Central Pkwy Stuart, FL | 1.0–2.0 | 1.0–2.0 | 918 | $2,640 | $2.87 | 14d | 16 | 0.80mi |
| 544 SW 35th St Palm City, FL | 2.0 | 1.0 | 850 | $1,850 | $2.18 | 23d | 1 | 0.85mi |
| 664 SW 35th St Unit 6 Palm City, FL | 2.0 | 1.5 | 900 | $1,850 | $2.06 | 14d | 1 | 0.88mi |
| 664 SW 35th St Apt 3 Palm City, FL | 2.0 | 1.5 | 900 | $1,775 | $1.97 | 14d | 1 | 0.89mi |
| 801 SE Central Pkwy #7 Stuart, FL | 2.0 | 2.0 | 1046 | $2,150 | $2.06 | 14d | 1 | 0.93mi |
| 3375 SW Mapp Rd Unit 204 Palm City, FL | 3.0 | 2.0 | 1067 | $2,300 | $2.16 | 23d | 1 | 1.07mi |
| 3800 S Kanner Hwy Stuart, FL | 3.0 | 1.0–2.0 | 970 | $2,604 | $2.68 | 14d | 21 | 1.08mi |
| 2124 SE Edler Dr Stuart, FL | 2.0 | 2.0 | 876 | $1,800 | $2.05 | 23d | 1 | 1.13mi |
| 2118 SE Edler Dr Unit B Stuart, FL | 2.0 | 2.0 | 876 | $1,995 | $2.28 | 23d | 1 | 1.14mi |
| 1485 SW Silver Pine Way Unit 107 B-2 Palm City, FL | 1.0 | 1.0 | 830 | $1,650 | $1.99 | 23d | 1 | 1.14mi |
| 2104 SE Edler Dr Stuart, FL | 1.0 | 1.0 | 726 | $1,500 | $2.07 | 23d | 1 | 1.15mi |
| 950 S Kanner Hwy Stuart, FL | 1.0–2.0 | 1.0–2.0 | 850 | $2,000 | $2.35 | 14d | 4 | 1.16mi |
| 950 S Kanner Hwy Stuart, FL | 1.0–2.0 | 1.0–2.5 | 1062 | $2,000 | $1.88 | 23d | 5 | 1.16mi |
| 950 S Kanner Hwy Stuart, FL | 2.0 | 2.0 | 1019 | $1,888 | $1.85 | 21d | 3 | 1.16mi |
| 3031 SE Aster Ln Unit 608 Stuart, FL | 2.0 | 2.0 | 1019 | $1,870 | $1.84 | 23d | 1 | 1.20mi |
| 3151 SE Aster Ln #1306 Stuart, FL | 2.0 | 2.0 | 1034 | $1,800 | $1.74 | 23d | 1 | 1.21mi |
| 1215 SE Glenwood Dr Stuart, FL | 2.0 | 2.0 | 1089 | $1,859 | $1.71 | 14d | 10 | 1.21mi |
| 1605 SW Silver Pine Way Unit F2 Palm City, FL | 2.0 | 2.0 | 1111 | $2,000 | $1.80 | 23d | 1 | 1.27mi |
| 1290 SE Parkview Pl Unit A2 Stuart, FL | 2.0 | 2.0 | 1021 | $1,800 | $1.76 | 21d | 1 | 1.28mi |
| 3302 SE Aster Ln Stuart, FL | 2.0 | 2.0 | 888 | $1,900 | $2.14 | 23d | 1 | 1.33mi |
| 2703 SW Matheson Ave Unit 116-G2 Palm City, FL | 1.0 | 1.0 | 842 | $1,400 | $1.66 | 23d | 1 | 1.43mi |
| 2703 SW Matheson Ave Unit 116- B1 Palm City, FL | 1.0 | 1.0 | 842 | $1,750 | $2.08 | 14d | 1 | 1.43mi |
| 801 SE Central Ave Stuart, FL | 3.0 | 1.0 | 899 | $2,300 | $2.56 | 14d | 1 | 1.47mi |
| 917 SE Nassau Ave Stuart, FL | 2.0 | 1.0 | 832 | $1,900 | $2.28 | 21d | 1 | 1.49mi |
| 917 SE Nassau Ave Stuart, FL | 2.0 | 1.0 | 832 | $3,800 | $4.57 | 23d | 1 | 1.49mi |
| 300 SW South River Dr #206 Stuart, FL | 2.0 | 2.0 | 1107 | $1,975 | $1.78 | 23d | 1 | 1.50mi |
| 301 SW South River Dr #104 Stuart, FL | 1.0 | 1.0 | 697 | $1,500 | $2.15 | 23d | 1 | 1.50mi |
HOA detail condo
- Monthly dues
- $390 · $4,680/yr
- Likely covers
- watersewertrashcableexterior maint.pool
- Assessments
- None detected in remarks — confirm with the listing agent.
Listing history 31 events
-
2026-05-31status $165,000 Pending 59 DOM
-
2026-05-14historical Active Under Contract
-
2026-05-12price $165,000
-
2026-04-28price $170,000
-
2026-04-15price $180,000
-
2026-03-25$190,000 Active
-
2026-03-20historical
-
2026-03-13price $204,900
-
2026-03-01$209,000 Active
-
2026-02-04historical
-
2025-11-01historical
-
2025-09-25price $217,900
-
2025-09-25price $217,900
-
2025-06-04price $219,900
-
2025-06-03price $219,900
-
2025-05-21price $225,000
-
2025-05-20price $225,000
-
2025-04-18$235,000 Active
-
2025-04-03$235,000 Active
-
2024-12-09historical
-
2024-10-30$245,000 Active
-
2024-10-23historical
-
2024-10-04$250,000 Active
-
2010-12-21historical
-
2010-07-19$122,000
-
2002-02-28soldstatus $68,000
-
2001-10-03soldstatus $57,000
-
1998-03-20soldstatus $59,000
-
1998-03-19soldstatus $59,000
-
1998-02-23$64,000
-
1996-08-08soldstatus $61,000
ⓘ Source: listings_history table (triggers on properties + properties_extension) + one-shot
backfill from property_details.listing_events for pre-trigger history.
Tax reassessment forecast FL · Resets to sale price
- Current annual tax
- $534 · $44/mo
- Projected year-2 tax
- $1,370 · $114/mo
- Expected delta
- +$836/yr (+$70/mo · 156.5%)
ⓘ Screening estimate from a state-policy table — verify with the county assessor before closing.
Climate risk First Street
- Flood 6/10 Major FEMA zone X (shaded) · 72% chance over 30 yrs
- Wildfire 1/10 Low
- Heat 10/10 Extreme 7 d/yr ≥106°F today · 22 d/yr by 30 yrs out
- Wind 10/10 Extreme 99% chance of damaging wind over 30 yrs
- Air quality 2/10 Low 1 unhealthy d/yr today · 1 by 30 yrs out
Nearby sold comps map
Loading sold comps map…
Walkable amenities ~0.75 mi
Loading nearby amenities…
Taxation est. · year 1
- Rental income
- $24,949
- − Mortgage interest
- −$9,243
- − Property taxes
- −$534
- − Insurance
- −$825
- − Repairs & maintenance
- −$1,996
- − Management
- −$1,996
- − HOA
- −$4,680
- − Depreciation
- −$4,800
- Taxable income
- $876
- Est. tax owed @ 24.0%
- −$210
- After-tax cash flow
- $3,078/yr
For passive investors: Depreciation is non-cash, so a rental often shows a tax loss while cash-flowing — sheltering income. Rental losses are passive: they offset passive income freely, and up to $25,000/yr can offset ordinary (W-2) income if you actively participate and your MAGI is under $100k (phasing out to $0 by $150k); unused losses carry forward. On sale, claimed depreciation is recaptured at up to 25%, and gains may owe capital-gains tax (a 1031 exchange can defer both). Figures are a year-1 estimate at your 24.0% rate — not tax advice; consult a CPA.
Schools (NCES district)
- District
- Martin
- NCES district ID
- 1201290
- Math proficiency
- 52% ▼ -14.00%
- Reading proficiency
- 53% ▼ -4.00%
- Median HH income
- $52,482
- Composite
- 45.1/100
- National rank
- #2690
- State rank
- #24 of 73 in FL
Livability — Stuart
- Score
- 84/100
- State rank
- #39
- US rank
- #790
Category grades
Schools grade is shown separately in the Schools card above.
Census & demographics
- County
- Martin County · 165,223 people
- City population
- 65,812
- Metro
- Port St. Lucie, FL
- Population (ZIP)
- 18,737
- Household income
- $62,533
- Rent vs Own
- Severe rent burden
- 1408.0
Population outlook (Martin County) Hauer SSP2
- Today (2025)
- 172,383 people
- By 2030
- 180,192 · +4.5%
- By 2040
- 194,114 · +12.6%
- By 2050
- 204,992 · +18.9%
- By 2075
- 229,641 · +33.2%
- By 2100
- 232,146 · +34.7%
Race, ethnicity, and origin ACS 2023
- Neighborhood character
- Majority White (65%)
- Race & ethnicity
- White 65% Hispanic / Latino 21% Two or more races 12% Black 11%
- Hispanic origin (detail)
- Mexican 6% Puerto Rican 5% Cuban 1%
- Common ancestry
- Romanian 5% Lithuanian 3% Slovak 2%
- Foreign-born
- 12% · Canada
- Languages at home
- 80% English-only · Spanish 16% Russian/Polish/Slavic 2% Other Indo-European 1%
Political lean MEDSL · Martin
- 2024 margin
- Solid R (+31.1) · D 34.1% · R 65.2%
- 2008→2024 swing
- -17.5pp toward R · 2008: -13.6pp · 2024: -31.1pp
- All cycles
- 2024: R+31.1 2020: R+24.6 2016: R+26.9 2012: R+22.9 2008: R+13.6
Not yet ingested
- Civics
- —
Market trends
- HPI YoY
- ▼ -130.08%
- Current HPI
- 349.7061
- Rent YoY
- ▼ -0.69%
- Metro
- Port St. Lucie, FL
- State GDP YoY
- ▲ 3.28%
- F500 in state
- 36
Industry mix (Fortune 500 HQ in FL)
| Industry | F500 HQs | Revenue |
|---|---|---|
| Industrial Technology | 2 | $29B |
|
||
| Insurance | 2 | $17B |
|
||
| Retail | 1 | $60B |
|
||
| Technology Distribution | 1 | $58B |
|
||
| Homebuilding | 1 | $35B |
|
||
| Technology Manufacturing | 1 | $35B |
|
||
Price history
+170.5% since first listed30 events — show timeline
- 2026-05-14 Contingent — MCRTC
- 2026-05-12 Price Changed $165,000 MCRTC
- 2026-04-28 Price Changed $170,000 MCRTC
- 2026-04-15 Price Changed $180,000 MCRTC
- 2026-03-25 Listed $190,000 MCRTC
- 2026-03-20 Listing Removed — MCRTC
- 2026-03-13 Price Changed $204,900 MCRTC
- 2026-03-01 Listed $209,000 MCRTC
- 2026-02-04 Listing Removed — MCRTC
- 2025-11-01 Listing Removed — Beaches MLS
- 2025-09-25 Price Changed $217,900 Beaches MLS
- 2025-09-25 Price Changed $217,900 MCRTC
- 2025-06-04 Price Changed $219,900 Beaches MLS
- 2025-06-03 Price Changed $219,900 MCRTC
- 2025-05-21 Price Changed $225,000 Beaches MLS
- 2025-05-20 Price Changed $225,000 MCRTC
- 2025-04-18 Listed $235,000 Beaches MLS
- 2025-04-03 Listed $235,000 MCRTC
- 2024-12-09 Listing Removed — MCRTC
- 2024-10-30 Listed $245,000 MCRTC
- 2024-10-23 Listing Removed — MCRTC
- 2024-10-04 Listed $250,000 MCRTC
- 2010-12-21 Listing Removed — MCRTC
- 2010-07-19 Listed $122,000 MCRTC
- 2002-02-28 Sold (Public Records) $68,000 Public Records
- 2001-10-03 Sold (Public Records) $57,000 Public Records
- 1998-03-20 Sold (Public Records) $59,000 Public Records
- 1998-03-19 Sold (MLS) $59,000 MCRTC
- 1998-02-23 Listed $64,000 MCRTC
- 1996-08-08 Sold (Public Records) $61,000 Public Records
Property tax history
+0.5%/yrLatest (2025): $534 · -2.7% YoY. Source: county tax records.
Cash-flow waterfall
monthlySold comps — $/sqft
last 12 mo · ≤1 miLoading sold comps…