10548 Highway 21 S · Gordonville, AL
Flood risk 1/10 · Minimal
- FEMA flood zone
- X (unshaded)
- Chance of flooding over 30 yrs
- 0.0%
- Est. flood insurance / yr
- $473 – $860
Fire risk 5/10 · Moderate
- Est. fire insurance / yr
- $916 – $1,700
Heat risk 7/10 · Major
- Hot days now (above 107°F)
- 7 days/yr
- Hot days in 30 yrs
- 19 days/yr
Wind risk 8/10 · Major
- Chance of severe wind over 30 yrs
- 80.0%
Air-quality risk 2/10 · Minimal
- Unhealthy air days now
- 0 days/yr
- Unhealthy air days in 30 yrs
- 1 days/yr
Risk factors via First Street. Map © Google.
Why this score? — see what drove the C grade
The composite is a weighted blend of 9 inputs, each scored 0–100. Each bar is that input's sub-score; the figure is the points it added to the 100-point composite (weight × sub-score).
- Cash flow +20.6/30.0
- ARV discount +7.5/15.0
- DSCR +6.6/10.0
- Appreciation +5.9/10.0
- 1% rule +4.9/10.0
- Rent growth +2.5/5.0
- Livability +2.5/5.0
- Condition / age +2.5/5.0
- Schools +2.0/10.0
$115,000
🖨 Deal sheet 📄 Offer letter ✓ Due diligence
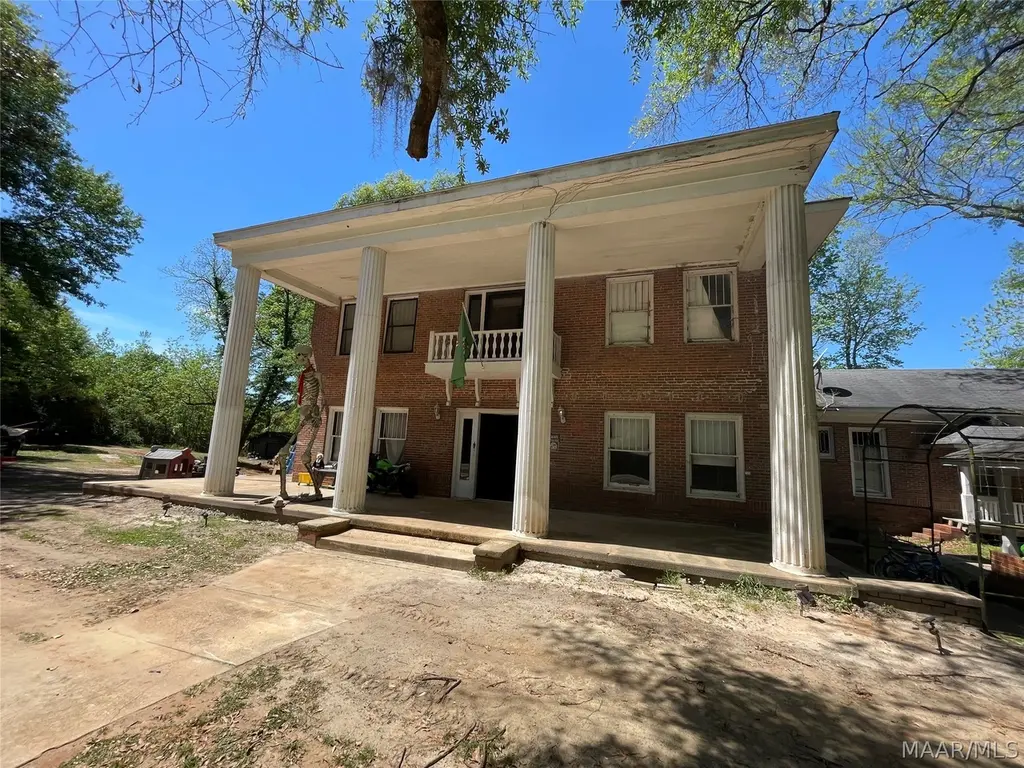
Listing remarks
Historic 4,500± sq. ft. home situated on approximately 1.9 acres in the quiet community of Fort Deposit, Alabama. This spacious property features 3.5 bathrooms, a formal dining room, foyer, washroom, and two large dens, offering plenty of room for comfortable living. Registered as a historic property in Lowndes County, this home is full of character and potential. While some repairs and updates are needed, the home is currently livable and presents an excellent opportunity for restoration or investment. Don't miss your chance to own a unique piece of Alabama history with endless possibilities.
Key facts
- Historic property
- Formal dining room
- Two large dens
Tags
Property features AI
Finance
- Other: Lot approximately 1.9 acres; Lot dimensions approximately 306 x 270 x 306 x 270; Located outside city limits; Paved road access
Exterior
- Parking: Driveway
- Utilities: Public water; Septic tank sewer; Cable available
- Home design: 2 stories; Brick and wood siding construction; Built per public records
- Construction: Brick and wood siding exterior
- Exterior features: Patio; Outdoor storage
Interior
- Flooring: Wood
- Bathrooms: 4 full bathrooms; 1 half bathroom
- Heating & cooling: Central heating (electric); Central air conditioning (electric)
- Interior features: Wood flooring; Masonry fireplaces (multiple)
- Laundry & utility: Washer hookup; Dryer hookup; Electric water heater
Neighborhood map
What this means for you Summary
Snapshot
- This is a 5-bed/3.0-bath single-family listed at $115k.
Deal economics
- At list price, monthly cash flow is $154 ($2k/yr) — positive.
- The deal already cash-flows at list — no discount required.
- To meet the 1% rule (rent ≥ 1% of price), the offer needs to be $114k (1.1% below list).
- Recommended offer: $113k (1.5% below list) — sets the bar for market timing.
Location & tenants
- Location reads 50/100 on livability (#523 in AL) — a working-class tenant base; expect higher turnover. Strengths: cost of living A+, housing A-; Watch: schools F, crime D-, amenities F.
- Lowndes County (rural): math 22% / reading 21% proficiency, ranked #124 of 133 in AL (top 93%) — low school quality limits family demand, transient renter base, plan for 1-2y turnover; 94% free/reduced lunch — lower-income household profile, screen leases tightly.
- Market conditions: 5 active listings in the ZIP.
Forward outlook
- In year one you build about $3k of equity ($795 loan paydown + $2k appreciation (1.9% local appreciation)).
- Lowndes County population projected at -35% by 2050 — secular population decline; favor cash flow + early exit over multi-decade hold.
- At projected returns (1.9% appreciation + 3.0% rent growth), your $32k cash investment doubles in ~6 years — after that, you're playing with house money.
Negotiation context
- It's been on market 18 days — a 2% lower offer ($113k) is reasonable based on typical stale-listing flexibility.
- 11 sale attempts since 18y ago; this cycle's ask has dropped $20k (15%) from the opening price — seller is motivated, your offer sets the floor, not the list.
- Current owner paid $100k; 15% above their basis — modest negotiation headroom, anchor on the comps not their cost.
Risks & watch-outs
- Watch-outs: built in 1914 — expect roof / HVAC / electrical / plumbing capex.
- Climate carrying-cost: severe wind risk, 80% chance of damaging wind over 30y; moderate wildfire risk; extreme-heat days projected 7→19/yr by 2055 (HVAC capex compounding) — expect insurance premiums to compound above CPI over the hold.
Questions for the listing agent
- Built in 1914 — when were the roof, HVAC, electrical panel, plumbing, and water heater last replaced?
- Is there a deadline driving the sale (1031 exchange, divorce, estate, relocation)? That informs how much negotiation room exists.
- Schools are F-rated, which usually means shorter tenancies and higher turnover. Who's the typical renter profile here, and what's been the actual vacancy rate?
- Crime grade is D in this area — have there been break-ins, vandalism, or insurance claims at this property in the last 3 years? What carrier currently insures it and at what premium?
- What's the average days-on-market for RENTAL listings here right now (not sales)? A rising rental-DOM trend means longer vacancies and softer asking-rent achievability than the comps imply.
- What's the recent tenant-quality profile in this submarket — average credit score on applications, eviction rate, late-payment / NSF rate, and stable-employment percentage? A property-management company in the area should have these aggregated.
- How much new for-sale + rental construction is in the pipeline within 1–3 miles? Heavy new supply typically softens prices + rents 12–24 months out; constrained supply supports both.
Investment metrics
- 1% rule
- 0.99% ✗
- Cap rate
- 7.90%
- Cash-on-cash
- 5.74%
- DSCR
- 1.26
- GRM
- 8.4
CMA / ARV
No comps found within radius.
Projected returns pro-forma
1.88% appreciation · 3.0% rent growth · sell at horizon
- IRR
- 9.8%
- Equity multiple
- 1.53×
- Total profit
- $16,980
- Equity at exit
- $44,618
- IRR
- 13.0%
- Equity multiple
- 2.72×
- Total profit
- $55,388
- Equity at exit
- $63,686
Cash invested: $32,200 (down + closing). Projections, not guarantees.
Landlord ↔ Tenant lean methodology
- Overall (STATE)
- 90 Strongly Landlord-Friendly
- State Alabama
- 90 Strongly Landlord-Friendly · R+15
- County
- — inherits STATE
- City
- — inherits STATE
ZIP-level market 36032
- Home prices YoY
- 1.5%
- Active inventory
- 5
- Price-to-rent
- 8.4×
Monthly cashflow live
- Estimated rent
- $1,137 medium interval (Pro) →
- Mortgage (P&I)
- −$603
- Tax from tax record
- −$93 /mo · $1,119/yr
- Insurance
- −$48
- HOA
- −$0
- Vacancy / Maint / Mgmt
- −$239
- Net cashflow
- $154
Break-even live
UW: 25.0% down · 7.5% · 30yr · 1.5% tax · 5.0% vac · 8.0% maint · 8.0% mgmt
Financing live
Cash to close
- Down payment
- $28,750
- Closing costs
- $3,450
- Reserves months
- —
- Total cash needed
- —
Loan-product check · same deal, 3 products live
Conventional
25% down · 7.5% · 30yr
- Down + closing
- —
- Monthly P&I
- —
- Monthly cashflow
- —
- DSCR
- —
- Eligible?
- —
Personal DTI + credit; lowest rate.
DSCR
20% down · 8.5% · 30yr
- Down + closing
- —
- Monthly P&I
- —
- Monthly cashflow
- —
- DSCR
- —
- Eligible?
- —
No personal income docs; deal must DSCR.
Hard money
10% down · 12.0% · 12mo
- Down + closing
- —
- Monthly P&I
- —
- Monthly cashflow
- —
- DSCR
- —
- Eligible?
- —
Short-term bridge; refi at stabilization.
Listing history 15 events
-
2026-06-18days on market $115,000 Active 18 DOM
-
2026-06-17days on market $115,000 Active 17 DOM
-
2026-06-16days on market $115,000 Active 16 DOM
-
2026-06-15price $115,000 Active 15 DOM
-
2026-06-15days on market $135,000 Active 15 DOM
-
2026-06-14days on market $135,000 Active 13 DOM
-
2026-06-13days on market $135,000 Active 12 DOM
-
2026-06-10days on market $135,000 Active 10 DOM
-
2026-06-09days on market $135,000 Active 9 DOM
-
2026-06-08days on market $135,000 Active 8 DOM
-
2026-06-07days on market $135,000 Active 7 DOM
-
2026-06-03days on market $135,000 Active 3 DOM
-
2026-06-03days on market $135,000 Active 2 DOM
-
2026-06-01remarks 600-char remark
-
2026-06-01$135,000 Active 1 DOM
ⓘ Source: listings_history table (triggers on properties + properties_extension) + one-shot
backfill from property_details.listing_events for pre-trigger history.
Tax reassessment forecast AL · Resets to sale price
- Current annual tax
- $1,119 · $93/mo
- Projected year-2 tax
- $1,119 · $93/mo
- Expected delta
- $0/yr ($0/mo · 0.0%)
ⓘ Screening estimate from a state-policy table — verify with the county assessor before closing.
Climate risk First Street
- Flood 1/10 Low FEMA zone X (unshaded) · 0% chance over 30 yrs
- Wildfire 5/10 Major
- Heat 7/10 Severe 7 d/yr ≥107°F today · 19 d/yr by 30 yrs out
- Wind 8/10 Severe 80% chance of damaging wind over 30 yrs
- Air quality 2/10 Low 0 unhealthy d/yr today · 1 by 30 yrs out
Nearby sold comps map
Loading sold comps map…
Walkable amenities ~0.75 mi
Loading nearby amenities…
Taxation est. · year 1
- Rental income
- $13,643
- − Mortgage interest
- −$6,442
- − Property taxes
- −$1,119
- − Insurance
- −$575
- − Repairs & maintenance
- −$1,091
- − Management
- −$1,091
- − Depreciation
- −$3,345
- Taxable loss
- −$21
- Est. tax savings @ 24.0%
- +$5
- After-tax cash flow
- $1,852/yr
For passive investors: Depreciation is non-cash, so a rental often shows a tax loss while cash-flowing — sheltering income. Rental losses are passive: they offset passive income freely, and up to $25,000/yr can offset ordinary (W-2) income if you actively participate and your MAGI is under $100k (phasing out to $0 by $150k); unused losses carry forward. On sale, claimed depreciation is recaptured at up to 25%, and gains may owe capital-gains tax (a 1031 exchange can defer both). Figures are a year-1 estimate at your 24.0% rate — not tax advice; consult a CPA.
Schools (NCES district)
- District
- Lowndes County
- NCES district ID
- 0102160
- Math proficiency
- 22% ▼ -1.00%
- Reading proficiency
- 21% ▲ 1.00%
- Median HH income
- $28,508
- Composite
- 20.29/100
- National rank
- #13821
- State rank
- #124 of 133 in AL
Livability — Gordonville
- Score
- 50/100
- State rank
- #523
- US rank
- #25499
Category grades
Schools grade is shown separately in the Schools card above.
Census & demographics
- Population (ZIP)
- 2,358
Population outlook (Lowndes County) Hauer SSP2
- Today (2025)
- 8,899 people
- By 2030
- 8,133 · -8.6%
- By 2040
- 6,789 · -23.7%
- By 2050
- 5,785 · -35.0%
- By 2075
- 4,745 · -46.7%
- By 2100
- 4,957 · -44.3%
Race, ethnicity, and origin ACS 2023
- Neighborhood character
- Predominantly Black (78%)
- Race & ethnicity
- Black 78% White 19% Native American 2% Two or more races 1%
- Common ancestry
- Hispanic 1%
- Foreign-born
- 0%
- Languages at home
- 98% English-only · Spanish 1%
Political lean MEDSL · Lowndes
- 2024 margin
- Solid D (+37.3) · D 68.4% · R 31.1%
- 2008→2024 swing
- -12.7pp toward R · 2008: 50.0pp · 2024: 37.3pp
- All cycles
- 2024: D+37.3 2020: D+45.9 2016: D+46.9 2012: D+53.1 2008: D+50.0
Not yet ingested
- Civics
- —
Market trends
- HPI YoY
- ▲ 1.88%
- Current HPI
- 129.6368
- Rent YoY
- —
- Metro
- —
- State GDP YoY
- ▲ 2.94%
- F500 in state
- 4
Industry mix (Fortune 500 HQ in AL)
| Industry | F500 HQs | Revenue |
|---|---|---|
| Financial Services | 1 | $8B |
|
||
| Healthcare | 1 | $5B |
|
||
Price history
-3.5% since first listed23 events — show timeline
- 2026-05-31 Listed $135,000 MAAR
- 2024-10-24 Contingent — MAAR
- 2024-10-18 Relisted — MAAR
- 2024-10-16 Relisted — CAOR
- 2024-09-16 Price Changed $135,000 MAAR
- 2024-09-16 Relisted — MAAR
- 2024-07-12 Contingent — CAOR
- 2024-07-12 Contingent — MAAR
- 2024-06-27 Relisted — CAOR
- 2024-06-27 Relisted — MAAR
- 2024-05-31 Contingent — CAOR
- 2024-05-31 Contingent — MAAR
- 2024-05-21 Listed $145,000 CAOR
- 2024-05-17 Listed $145,000 MAAR
- 2024-05-09 Price Changed $145,000 MAAR
- 2024-04-10 Price Changed $160,000 MAAR
- 2024-03-29 Price Changed $200,000 MAAR
- 2024-03-21 Price Changed $229,000 MAAR
- 2024-03-11 Listed $249,000 MAAR
- 2009-09-21 Sold (MLS) $100,000 MAAR
- 2009-03-31 Listed $114,900 MAAR
- 2008-04-10 Listed $249,000 MAAR
- 2001-02-15 Sold (Public Records) $139,900 Public Records
Property tax history
+4.2%/yrLatest (2025): $1,119 · +0.0% YoY. Source: county tax records.
Cash-flow waterfall
monthlySold comps — $/sqft
last 12 mo · ≤1 miLoading sold comps…