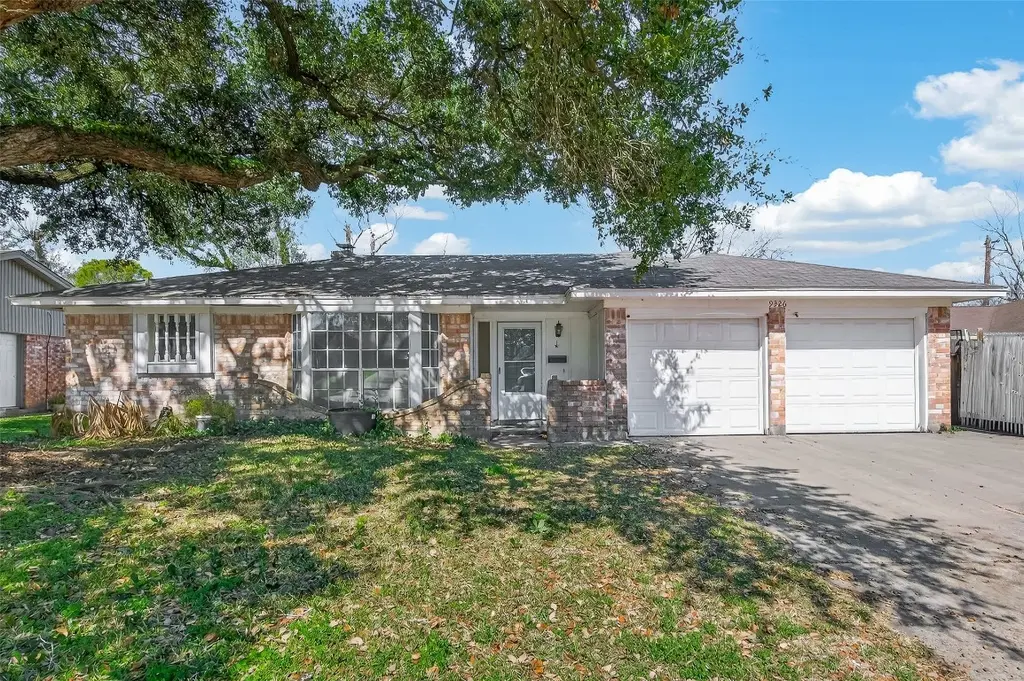
9326 Willow Meadow Dr · Houston, TX
Flood risk 4/10 · Minor
- FEMA flood zone
- X (shaded)
- Chance of flooding over 30 yrs
- 0.21%
- Est. flood insurance / yr
- $507 – $1,088
Fire risk 1/10 · Minimal
- Est. fire insurance / yr
- $1,222 – $2,270
Heat risk 9/10 · Severe
- Hot days now (above 110°F)
- 7 days/yr
- Hot days in 30 yrs
- 23 days/yr
Wind risk 9/10 · Severe
- Chance of severe wind over 30 yrs
- 99.0%
Air-quality risk 2/10 · Minimal
- Unhealthy air days now
- 2 days/yr
- Unhealthy air days in 30 yrs
- 2 days/yr
Risk factors via First Street. Map © Google.
Why this score? — see what drove the D grade
The composite is a weighted blend of 9 inputs, each scored 0–100. Each bar is that input's sub-score; the figure is the points it added to the 100-point composite (weight × sub-score).
- ARV discount +15.0/15.0
- Cash flow +6.2/30.0
- Appreciation +5.2/10.0
- Livability +3.7/5.0
- 1% rule +3.0/10.0
- Schools +2.7/10.0
- Rent growth +2.5/5.0
- Condition / age +2.5/5.0
- DSCR +0.5/10.0
$199,900
🖨 Deal sheet (PDF) 📄 Offer letter ✓ Due diligence
Listing remarks
One-story, 4-bedroom home offering a spacious layout and functional living areas. The living room connects to a formal dining space, providing a practical setup for everyday living and entertaining. Generously sized bedrooms offer flexibility for a variety of needs. The property needs updating and remodeling, making it a great opportunity for buyers looking to customize a home to their own style or for investors seeking their next project. Conveniently located near West Bellfort Street, grocery stores, and major highways including Hwy 69, making commuting and daily errands easy. The home also features a good-sized backyard and a 2-car garage, adding outdoor space and practical convenience.
Key facts
- Formal dining space
- Outdoor space
- Good-sized backyard
Tags
Property features AI
Finance
- HOA & community: Association: STERLING ASI; Association fee $400 annually
Exterior
- Parking: Attached garage; 2-car garage
- Utilities: Public water; Public sewer
- Home design: Residential property; Entry level on slab foundation
- Construction: Built in 1969; Brick and wood siding construction; Composition roof; Slab foundation
- Exterior features: Subdivision lot
Interior
- Bathrooms: Two full bathrooms
- Heating & cooling: Central heating (electric); Central air (electric)
- Interior features: Double vanity; Kitchen/family room combo; Tub with shower; One fireplace; Five total rooms
- Laundry & utility: Washer hookup; Electric dryer hookup
Neighborhood map
What this means for you Summary
Snapshot
- This is a 3-bed/2.0-bath single-family listed at $200k.
Deal economics
- At list price, monthly cash flow is $-367 ($-4k/yr) — negative.
- To cash-flow at today's rent, offer at most $135k (32.4% below list).
- To meet the 1% rule (rent ≥ 1% of price), the offer needs to be $160k (20.0% below list).
- Recommended offer: $135k (32.4% below list) — sets the bar for cash-flow.
- Cap rate 4.1% vs local median 3.2% in Houston — meaningfully above typical; check what's discounted (condition, days-on-market, listing class) to confirm the premium yield is real.
Location & tenants
- Location reads 74/100 on livability (#184 in TX, #4,771 nationally) — a middle-class / working-renter tenant base. Strengths: amenities A+, cost of living A+, housing A+; Watch: crime F.
- Houston ISD (urban): math 27% / reading 35% proficiency, ranked #593 of 826 in TX (top 72%) — families likely to look elsewhere, expect single-tenant / working-renter base with shorter leases; 71% free/reduced lunch — lower-income household profile, screen leases tightly.
- Zoned schools: Valley West El (math 27% / reading 37%, grade F, #2,268 of 4,322 statewide, top 55%, 653 students, 93% FRL); Welch Middle (math 11% / reading 21%, grade F, #1,543 of 1,662 statewide, top 94%, 645 students, 97% FRL); Sharpstown H S (math 7% / reading 23%, grade F, #1,507 of 1,632 statewide, top 93%, 1,855 students, 89% FRL) — zoned schools average 93% FRL vs 71% district-wide (22 pts higher); higher-poverty schools than district average — tighter screening recommended.
- Market conditions: 63 active listings in the ZIP; 11 comparable units currently listed for rent nearby; rentals at typical pace (median 26d on market — plan ~3-4 weeks tenant-placement turnaround); 45% of comp listings sitting > 30 days — soft ceiling on asking rent; 29,883 units permitted in Harris County in 2024 (8,621 in 5+ unit buildings).
Forward outlook
- In year one you build about $2k of equity ($1k loan paydown + $755 appreciation (0.4% local appreciation)).
- Harris County population projected at +47% by 2050 — long-run rental-demand tailwind backs the buy-and-hold thesis.
Negotiation context
- Only 9 days on market — expect competitive offers; lowballing is unlikely to land.
- 7 sale attempts since 24y ago with the ask held roughly flat each time — persistent listings suggest the price (not the market) is what's stuck; bring a comps-based counter.
Risks & watch-outs
- Watch-outs: property tax is 2.8% of price.
- Climate carrying-cost: severe wind risk, 99% chance of damaging wind over 30y; extreme-heat days projected 7→23/yr by 2055 (HVAC capex compounding) — expect insurance premiums to compound above CPI over the hold.
Questions for the listing agent
- What do current leases actually rent for vs. the listed asking? Can we see a recent rent roll and the last 12 months of T-12 income?
- Built in 1969 — when were the roof, HVAC, electrical panel, plumbing, and water heater last replaced?
- Property tax is high relative to price — has the assessment been appealed recently, and will the sale trigger a re-assessment?
- What does the HOA fee cover, when was the last increase, and are there any pending special assessments or reserve-fund shortfalls?
- Is there a deadline driving the sale (1031 exchange, divorce, estate, relocation)? That informs how much negotiation room exists.
- Schools are D-rated, which usually means shorter tenancies and higher turnover. Who's the typical renter profile here, and what's been the actual vacancy rate?
- Crime grade is F in this area — have there been break-ins, vandalism, or insurance claims at this property in the last 3 years? What carrier currently insures it and at what premium?
- The area grade is low — what's the realistic commute time and amenity access for the typical tenant pool here? Any planned neighborhood developments (good or bad) we should know about?
- What's the average days-on-market for RENTAL listings here right now (not sales)? A rising rental-DOM trend means longer vacancies and softer asking-rent achievability than the comps imply.
- What's the recent tenant-quality profile in this submarket — average credit score on applications, eviction rate, late-payment / NSF rate, and stable-employment percentage? A property-management company in the area should have these aggregated.
- How much new for-sale + rental construction is in the pipeline within 1–3 miles? Heavy new supply typically softens prices + rents 12–24 months out; constrained supply supports both.
Investment metrics
- 1% rule
- 0.80% ✗
- Cap rate
- 4.09%
- Cash-on-cash
- -7.87%
- DSCR
- 0.65
- GRM
- 10.4
CMA / ARV
- ARV (median comp)
- $257,979
- List price
- $199,900
- Delta
- -14.76%
- Verdict
- UNDERPRICED
- Comps
- 20 within 1.0 mi
Show comp detail 12 sales within ~0.75 mi
| Address | Dist | Beds/Ba | Sqft | Sold | Price | $/sf | Match |
|---|---|---|---|---|---|---|---|
| 9318 Twin Hills Dr | 0.07mi | 4/2.0 (+1) | 1,889 (-1%) | 7mo | $270,000 | $143 | 84 |
| 9403 Tooley Dr | 0.08mi | 3/2.0 | 1,830 (-4%) | 7mo | $310,000 | $169 | 83 |
| 9310 Vickijohn Dr | 0.32mi | 4/2.0 (+1) | 1,923 (+1%) | 3mo | $289,000 | $150 | 76 |
| 9219 Tooley Dr | 0.17mi | 4/2.0 (+1) | 2,048 (+7%) | 1mo | $249,900 | $122 | 74 |
| 9403 Rentur Dr | 0.19mi | 4/2.0 (+1) | 1,847 (-3%) | 10mo | $290,000 | $157 | 72 |
| 9410 Portal Dr | 0.43mi | 3/2.0 | 1,943 (+2%) | 6mo | $285,000 | $147 | 72 |
| 9115 Willow Meadow Dr | 0.26mi | 3/2.0 | 1,750 (-8%) | 5mo | $217,000 | $124 | 70 |
| 10606 Raydell Dr | 0.38mi | 4/2.0 (+1) | 1,848 (-3%) | 7mo | $278,000 | $150 | 66 |
| 9114 Spellman Rd | 0.63mi | 3/2.0 | 1,816 (-5%) | 0mo | $298,000 | $164 | 62 |
| 10623 Hoyte Dr | 0.57mi | 3/2.0 | 1,755 (-8%) | 3mo | $175,000 | $100 | 58 |
| 9431 Claridge Dr | 0.42mi | 4/2.0 (+1) | 2,084 (+9%) | 7mo | $265,000 | $127 | 54 |
| 9211 Benning Dr | 0.59mi | 4/2.0 (+1) | 2,079 (+9%) | 1mo | $255,000 | $123 | 52 |
Match score weights: distance 35% · size 25% · config 20% · recency 20%. Top-matched comps best support the ARV.
Projected returns pro-forma
0.38% appreciation · 3.0% rent growth · sell at horizon
- IRR
- -9.5%
- Equity multiple
- 0.54×
- Total profit
- $-25,468
- Equity at exit
- $61,847
- IRR
- -3.4%
- Equity multiple
- 0.62×
- Total profit
- $-21,223
- Equity at exit
- $77,448
Cash invested: $55,972 (down + closing). Projections, not guarantees.
Landlord ↔ Tenant lean methodology
- Overall (STATE)
- 87 Strongly Landlord-Friendly
- State Texas
- 87 Strongly Landlord-Friendly · R+5
- County
- — inherits STATE
- City
- — inherits STATE
ZIP-level market 77031
- Home prices YoY
- 0.2%
- Active inventory
- 63
- Price-to-rent
- 10.4×
Monthly cashflow live
- Estimated rent
- $1,600 high interval (Pro) →
- Mortgage (P&I)
- −$1,048
- Tax from tax record
- −$466 /mo · $5,596/yr
- Insurance
- −$83
- HOA
- −$33
- Vacancy / Maint / Mgmt
- −$336
- Net cashflow
- $-367
Break-even live
Sensitivity live
| Price | -10% $-254 | -5% $-310 | +0% $-367 | +5% $-424 | +10% $-480 |
|---|---|---|---|---|---|
| Rent | -10% $-493 | -5% $-430 | +0% $-367 | +5% $-304 | +10% $-241 |
| Rate | -1.0pp $-266 | -0.5pp $-316 | base $-367 | +0.5pp $-419 | +1.0pp $-471 |
UW: 25.0% down · 7.5% · 30yr · 1.5% tax · 5.0% vac · 8.0% maint · 8.0% mgmt
Financing live
Cash to close
- Down payment
- $49,975
- Closing costs
- $5,997
- Reserves months
- —
- Total cash needed
- —
Loan-product check · same deal, 3 products live
Conventional
25% down · 7.5% · 30yr
- Down + closing
- —
- Monthly P&I
- —
- Monthly cashflow
- —
- DSCR
- —
- Eligible?
- —
Personal DTI + credit; lowest rate.
DSCR
20% down · 8.5% · 30yr
- Down + closing
- —
- Monthly P&I
- —
- Monthly cashflow
- —
- DSCR
- —
- Eligible?
- —
No personal income docs; deal must DSCR.
Hard money
10% down · 12.0% · 12mo
- Down + closing
- —
- Monthly P&I
- —
- Monthly cashflow
- —
- DSCR
- —
- Eligible?
- —
Short-term bridge; refi at stabilization.
Rent comps 11 comps
| Address | Beds | Baths | Sqft | Rent | $/sqft | DOM | Units | Dist |
|---|---|---|---|---|---|---|---|---|
| 8901 Bissonnet St Unit 235 Houston, TX | 3.0 | 2.0 | 1250 | $1,150 | $0.92 | 45d | 1 | 0.78mi |
| 8888 Benning Dr Houston, TX | 3.0 | 3.0 | 1472 | $1,750 | $1.19 | 45d | 1 | 0.80mi |
| 8901 Bissonnet St Houston, TX | 1.0–3.0 | 1.0–2.0 | 962 | $1,179 | $1.22 | 1d | 17 | 0.90mi |
| 9350 Country Creek St Houston, TX | 3.0 | 2.0 | 1272 | $1,500 | $1.18 | 45d | 1 | 0.99mi |
| 10965 S Gessner Rd Unit 1110 Houston, TX | 2.0 | 2.0 | 1322 | $1,229 | $0.93 | 26d | 1 | 1.00mi |
| 10965 S Gessner Rd Houston, TX | 3.0 | 2.0 | 1647 | $1,464 | $0.89 | 45d | 1 | 1.01mi |
| 10965 S Gessner Rd Houston, TX | 2.0 | 2.0 | 1322 | $1,229 | $0.93 | 17d | 1 | 1.01mi |
| 10225 Bissonnet St Houston, TX | 1.0–2.0 | 1.0–2.5 | 992 | $1,480 | $1.49 | 0d | 45 | 1.06mi |
| 8115 Braesview Ln Houston, TX | 4.0 | 2.0 | 2272 | $2,500 | $1.10 | 45d | 1 | 1.28mi |
| 8978 Dawnridge Dr Houston, TX | 4.0 | 3.0 | 2160 | $2,100 | $0.97 | 0d | 1 | 1.29mi |
| 9343 Starfire Ln Houston, TX | 4.0 | 2.0 | 2520 | $2,150 | $0.85 | 9d | 1 | 1.41mi |
HOA detail
- Monthly dues
- $33 · $396/yr
Listing history 25 events
-
2026-06-18days on market $199,900 Active 9 DOM
-
2026-06-17days on market $199,900 Active 8 DOM
-
2026-06-16days on market $199,900 Active 7 DOM
-
2026-06-15days on market $199,900 Active 6 DOM
-
2026-06-13days on market $199,900 Active 4 DOM
-
2026-06-10pricedays on market $199,900 Active 1 DOM
-
2026-06-08days on market $219,900 Active 111 DOM
-
2026-06-07days on market $219,900 Active 110 DOM
-
2026-06-04days on market $219,900 Active 107 DOM
-
2026-06-01days on market $219,900 Active 104 DOM
-
2026-05-31days on market $219,900 Active 103 DOM
-
2026-03-31price $219,900 704-char remark
-
2026-02-17status Active 704-char remark
-
2026-02-17historical 704-char remark
-
2026-02-17$239,000 704-char remark
-
2004-08-06historical
-
2004-04-06$121,000
-
2004-03-08historical
-
2003-09-11$129,900
-
2003-07-16soldstatus
-
2003-06-09historical
-
2003-03-24$117,900
-
2003-03-24historical
-
2002-10-17$118,900
-
1989-01-01soldstatus
ⓘ Source: listings_history table (triggers on properties + properties_extension) + one-shot
backfill from property_details.listing_events for pre-trigger history.
Tax reassessment forecast TX · Resets to sale price
- Current annual tax
- $5,596 · $466/mo
- Projected year-2 tax
- $5,596 · $466/mo
- Expected delta
- $0/yr ($0/mo · 0.0%)
ⓘ Screening estimate from a state-policy table — verify with the county assessor before closing.
Climate risk First Street
- Flood 4/10 Moderate FEMA zone X (shaded) · 21% chance over 30 yrs
- Wildfire 1/10 Low
- Heat 9/10 Extreme 7 d/yr ≥110°F today · 23 d/yr by 30 yrs out
- Wind 9/10 Extreme 99% chance of damaging wind over 30 yrs
- Air quality 2/10 Low 2 unhealthy d/yr today · 2 by 30 yrs out
Nearby sold comps map
Loading sold comps map…
Walkable amenities ~0.75 mi
Loading nearby amenities…
Taxation est. · year 1
- Rental income
- $19,199
- − Mortgage interest
- −$11,198
- − Property taxes
- −$5,596
- − Insurance
- −$1,000
- − Repairs & maintenance
- −$1,536
- − Management
- −$1,536
- − HOA
- −$396
- − Depreciation
- −$5,815
- Taxable loss
- −$7,877
- Est. tax savings @ 24.0%
- +$1,890
- After-tax cash flow
- $-2,513/yr
For passive investors: Depreciation is non-cash, so a rental often shows a tax loss while cash-flowing — sheltering income. Rental losses are passive: they offset passive income freely, and up to $25,000/yr can offset ordinary (W-2) income if you actively participate and your MAGI is under $100k (phasing out to $0 by $150k); unused losses carry forward. On sale, claimed depreciation is recaptured at up to 25%, and gains may owe capital-gains tax (a 1031 exchange can defer both). Figures are a year-1 estimate at your 24.0% rate — not tax advice; consult a CPA.
Schools (NCES district)
- District
- Houston ISD
- NCES district ID
- 4823640
- Math proficiency
- 27% ▼ -18.00%
- Reading proficiency
- 35% ▼ -6.00%
- Median HH income
- $46,054
- Composite
- 26.63/100
- National rank
- #7173
- State rank
- #593 of 826 in TX
Livability — Houston
- Score
- 74/100
- State rank
- #184
- US rank
- #4771
Category grades
Schools grade is shown separately in the Schools card above.
Census & demographics
- Census place
- Houston, TX
- City population
- 3,226,434
- Population (ZIP)
- 15,740
Population outlook (Harris County) Hauer SSP2
- Today (2025)
- 5,571,493 people
- By 2030
- 6,089,821 · +9.3%
- By 2040
- 7,142,806 · +28.2%
- By 2050
- 8,185,864 · +46.9%
- By 2075
- 10,574,329 · +89.8%
- By 2100
- 12,109,958 · +117.4%
Race, ethnicity, and origin ACS 2023
- Neighborhood character
- Diverse neighborhood (Simpson 0.61)
- Race & ethnicity
- Hispanic / Latino 57% Two or more races 25% Black 20% White 14% Asian 7%
- Hispanic origin (detail)
- Mexican 27%
- Common ancestry
- Italian 1% Lithuanian 1%
- Foreign-born
- 42% · Canada, Jamaica, Vietnam
- Languages at home
- 42% English-only · Spanish 48% Vietnamese 2% Other Indo-European 2%
Political lean MEDSL · Harris
- 2024 margin
- Lean D (+5.5) · D 52.0% · R 46.4% · Other 1.6%
- 2008→2024 swing
- +3.9pp toward D · 2008: 1.6pp · 2024: 5.5pp
- All cycles
- 2024: D+5.5 2020: D+13.3 2016: D+12.4 2012: D+0.1 2008: D+1.6
Not yet ingested
- Civics
- —
Market trends
- HPI YoY
- ▲ 0.38%
- Current HPI
- 235.9144
- Rent YoY
- —
- Metro
- —
- State GDP YoY
- ▲ 3.95%
- F500 in state
- 110
Industry mix (Fortune 500 HQ in TX)
| Industry | F500 HQs | Revenue |
|---|---|---|
| Energy | 16 | $1,198B |
|
||
| Technology | 5 | $198B |
|
||
| Engineering / Construction | 4 | $72B |
|
||
| Energy Services | 3 | $60B |
|
||
| Utilities | 3 | $41B |
|
||
| Healthcare | 2 | $330B |
|
||
Price history
+68.1% since first listed17 events — show timeline
- 2026-06-18 Listing Removed — HARMLS
- 2026-06-09 Listing Removed — HARMLS
- 2026-06-09 Listed $199,900 HARMLS
- 2026-03-31 Price Changed $219,900 HARMLS
- 2026-02-17 Relisted — HARMLS
- 2026-02-17 Listing Removed — HARMLS
- 2026-02-17 Listed $239,000 HARMLS
- 2004-08-06 Listing Removed — HARMLS
- 2004-04-06 Listed $121,000 HARMLS
- 2004-03-08 Listing Removed — HARMLS
- 2003-09-11 Listed $129,900 HARMLS
- 2003-07-16 Sold (Public Records) — Public Records
- 2003-06-09 Listing Removed — HARMLS
- 2003-03-24 Listing Removed — HARMLS
- 2003-03-24 Listed $117,900 HARMLS
- 2002-10-17 Listed $118,900 HARMLS
- 1989-01-01 Sold (Public Records) — Public Records
Property tax history
+6.6%/yrLatest (2025): $5,596 · +1.5% YoY. Source: county tax records.
Cash-flow waterfall
monthlySold comps — $/sqft
last 12 mo · ≤1 miLoading sold comps…