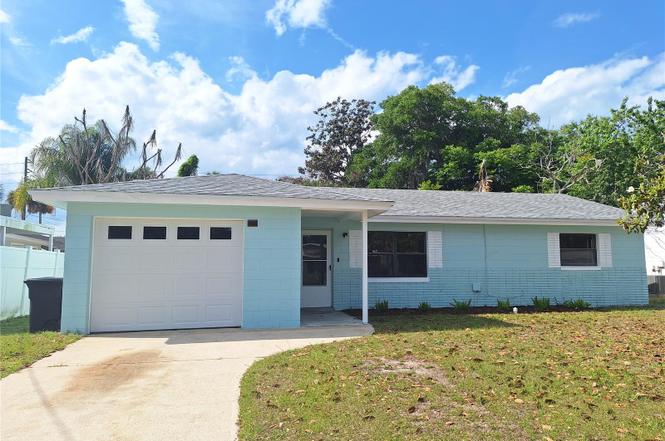
607 Edward St · New Smyrna Beach, FL
Flood risk 6/10 · Moderate
- FEMA flood zone
- X (unshaded)
- Chance of flooding over 30 yrs
- 0.54%
- Est. flood insurance / yr
- $507 – $1,088
Fire risk 4/10 · Minor
- Est. fire insurance / yr
- $947 – $1,759
Heat risk 10/10 · Severe
- Hot days now (above 105°F)
- 7 days/yr
- Hot days in 30 yrs
- 20 days/yr
Wind risk 10/10 · Severe
- Chance of severe wind over 30 yrs
- 99.0%
Air-quality risk 2/10 · Minimal
- Unhealthy air days now
- 1 days/yr
- Unhealthy air days in 30 yrs
- 1 days/yr
Risk factors via First Street. Map © Google.
Why this score? — see what drove the C- grade
The composite is a weighted blend of 9 inputs, each scored 0–100. Each bar is that input's sub-score; the figure is the points it added to the 100-point composite (weight × sub-score).
- Cash flow +18.7/30.0
- ARV discount +7.5/15.0
- DSCR +5.9/10.0
- 1% rule +4.9/10.0
- Rent growth +3.9/5.0
- Schools +3.9/10.0
- Livability +3.5/5.0
- Condition / age +2.5/5.0
- Appreciation +0.0/10.0
$249,000
🖨 Deal sheet (PDF) 📄 Offer letter ✓ Due diligence
Listing remarks
Under contract-accepting backup offers. Great Location in New Smyrna Beach, centrally located. Close to Historic Canal Street, Intracoastal Waterway, golf courses, restaurants, and just 3 miles to the Beach! Solid concrete block single family home, 3BR 1.5BA with 1 car garage. Tile floors thru out home except 1 Bedroom. Interior is freshly painted ceiling to floors. Kitchen has Plenty of room to add an island and/or expand. Sliding glass doors open to a Large 25'x12' covered rear porch off dining area that leads you to the spacious and mostly fenced private back yard. Brand new garage door installed and exterior fresh paint job.
Key facts
- 6,900 sq ft lot
- Garage
- Built 1973
Tags
Neighborhood map
What this means for you Summary
Snapshot
- This is a 3-bed/1.5-bath single-family listed at $249k.
Deal economics
- At list price, monthly cash flow is $248 ($3k/yr) — positive.
- The deal already cash-flows at list — no discount required.
- To meet the 1% rule (rent ≥ 1% of price), the offer needs to be $247k (0.7% below list).
- Recommended offer: $245k (1.5% below list) — sets the bar for market timing.
Location & tenants
- Location reads 69/100 on livability (#474 in FL) — a middle-class / working-renter tenant base. Strengths: crime A+, housing A+, employment B; Watch: amenities F, commute F, health & safety D-.
- Volusia (suburban): math 44% / reading 49% proficiency, ranked #47 of 73 in FL (top 64%) — families likely to look elsewhere, expect single-tenant / working-renter base with shorter leases.
- Zoned schools: Chisholm Elementary School (math 72% / reading 63%, grade B+, #435 of 2,144 statewide, top 21%, 491 students, 47% FRL); New Smyrna Beach Middle School (math 43% / reading 43%, grade D-, #331 of 571 statewide, top 59%, 1,037 students, 53% FRL); New Smyrna Beach High School (math 34% / reading 52%, grade F, #255 of 667 statewide, top 39%, 1,810 students, 41% FRL) — zoned schools at 47% FRL track the district average.
- Market conditions: Rents rising fast (+5.6%/yr); 607 active listings in the ZIP; 16 comparable units currently listed for rent nearby; rentals at typical pace (median 26d on market — plan ~3-4 weeks tenant-placement turnaround); solid renter incomes; 3,402 units permitted in Volusia County in 2024 (681 in 5+ unit buildings).
- This rent runs 39% of the median local income ($77k/yr) — at the standard rent-burdened threshold; future hikes will face affordability resistance.
Forward outlook
- Local home prices are declining (-3.0%/yr); year-one equity from $2k of loan paydown is wiped out by about $7k of value loss. Plan a longer hold.
- Volusia County population projected at +19% by 2050 — long-run rental-demand tailwind backs the buy-and-hold thesis.
Negotiation context
- It's been on market 30 days — a 2% lower offer ($245k) is reasonable based on typical stale-listing flexibility.
- Current owner paid $67k; list at $249k implies a 272% gain — meaningful room to come down on a strong offer.
Risks & watch-outs
- Climate carrying-cost: major flood risk; severe wind risk, 99% chance of damaging wind over 30y; extreme-heat days projected 7→20/yr by 2055 (HVAC capex compounding) — expect insurance premiums to compound above CPI over the hold.
Questions for the listing agent
- Built in 1973 — when were the roof, HVAC, electrical panel, plumbing, and water heater last replaced?
- Is there a deadline driving the sale (1031 exchange, divorce, estate, relocation)? That informs how much negotiation room exists.
- Schools are B-rated — typically a magnet for longer-tenancy family renters. What's the average tenant stay here, and is there a school-zone premium baked into asking?
- What's the average days-on-market for RENTAL listings here right now (not sales)? A rising rental-DOM trend means longer vacancies and softer asking-rent achievability than the comps imply.
- What's the recent tenant-quality profile in this submarket — average credit score on applications, eviction rate, late-payment / NSF rate, and stable-employment percentage? A property-management company in the area should have these aggregated.
- How much new for-sale + rental construction is in the pipeline within 1–3 miles? Heavy new supply typically softens prices + rents 12–24 months out; constrained supply supports both.
Investment metrics
- 1% rule
- 0.99% ✗
- Cap rate
- 7.49%
- Cash-on-cash
- 4.27%
- DSCR
- 1.19
- GRM
- 8.4
CMA / ARV
No comps found within radius.
Projected returns pro-forma
-3.0% appreciation · 5.6% rent growth · sell at horizon
- IRR
- -6.7%
- Equity multiple
- 0.74×
- Total profit
- $-17,878
- Equity at exit
- $37,127
- IRR
- 5.8%
- Equity multiple
- 1.48×
- Total profit
- $33,629
- Equity at exit
- $21,529
Cash invested: $69,720 (down + closing). Projections, not guarantees.
Landlord ↔ Tenant lean methodology
- Overall (STATE)
- 87 Strongly Landlord-Friendly
- State Florida
- 87 Strongly Landlord-Friendly · R+3
- County
- — inherits STATE
- City
- — inherits STATE
ZIP-level market 32168
- Home prices YoY
- -27.0%
- Rents YoY
- 5.6%
- Active inventory
- 607
- Price-to-rent
- 8.4×
Monthly cashflow live
- Estimated rent
- $2,473 high interval (Pro) →
- Mortgage (P&I)
- −$1,306
- Tax from tax record
- −$296 /mo · $3,554/yr
- Insurance
- −$104
- HOA
- −$0
- Lot rent
- −$0
- Vacancy / Maint / Mgmt
- −$519
- Net cashflow
- $248
Break-even live
Sensitivity live
| Price | -10% $389 | -5% $319 | +0% $248 | +5% $178 | +10% $107 |
|---|---|---|---|---|---|
| Rent | -10% $53 | -5% $150 | +0% $248 | +5% $346 | +10% $444 |
| Rate | -1.0pp $374 | -0.5pp $311 | base $248 | +0.5pp $184 | +1.0pp $118 |
UW: 25.0% down · 7.5% · 30yr · 1.5% tax · 5.0% vac · 8.0% maint · 8.0% mgmt
Financing live
Cash to close
- Down payment
- $62,250
- Closing costs
- $7,470
- Reserves months
- —
- Total cash needed
- —
Loan-product check · same deal, 3 products live
Conventional
25% down · 7.5% · 30yr
- Down + closing
- —
- Monthly P&I
- —
- Monthly cashflow
- —
- DSCR
- —
- Eligible?
- —
Personal DTI + credit; lowest rate.
DSCR
20% down · 8.5% · 30yr
- Down + closing
- —
- Monthly P&I
- —
- Monthly cashflow
- —
- DSCR
- —
- Eligible?
- —
No personal income docs; deal must DSCR.
Hard money
10% down · 12.0% · 12mo
- Down + closing
- —
- Monthly P&I
- —
- Monthly cashflow
- —
- DSCR
- —
- Eligible?
- —
Short-term bridge; refi at stabilization.
Rent comps 16 comps
| Address | Beds | Baths | Sqft | Rent | $/sqft | DOM | Units | Dist |
|---|---|---|---|---|---|---|---|---|
| 618 N Duss St New Smyrna Beach, FL | 3.0 | 2.0 | 1500 | $1,999 | $1.33 | 21d | 1 | 0.26mi |
| 1054 Claudia St New Smyrna Beach, FL | 2.0 | 2.0 | 1005 | $1,750 | $1.74 | 25d | 1 | 0.49mi |
| 907 Hamilton St New Smyrna Beach, FL | 3.0 | 2.0 | 1336 | $2,085 | $1.56 | 13d | 1 | 0.51mi |
| 2 Riverwalk Dr #202 New Smyrna Beach, FL | 2.0 | 2.0 | 1384 | $3,200 | $2.31 | 25d | 1 | 0.70mi |
| 159 Breezeway Ct #159 New Smyrna Beach, FL | 2.0 | 2.0 | 967 | $2,900 | $3.00 | 25d | 1 | 0.76mi |
| 7 Birdie Dr New Smyrna Beach, FL | 2.0 | 2.0 | 1046 | $2,600 | $2.49 | 25d | 1 | 0.93mi |
| 14 Birdie Dr New Smyrna Beach, FL | 2.0 | 2.0 | 1060 | $1,775 | $1.67 | 25d | 1 | 0.95mi |
| 315 North Cswy Unit C-304 New Smyrna Beach, FL | 2.0 | 2.0 | 1134 | $2,500 | $2.20 | 23d | 1 | 1.21mi |
| 315 N Causeway New Smyrna Beach, FL | 2.0 | 2.0 | 1073 | $2,300 | $2.14 | 25d | 2 | 1.23mi |
| 325 N Causeway New Smyrna Beach, FL | 2.0 | 2.0 | 1189 | $3,175 | $2.67 | 23d | 3 | 1.27mi |
| 462 Bouchelle Dr #201 New Smyrna Beach, FL | 2.0 | 2.0 | 1138 | $2,600 | $2.28 | 13d | 1 | 1.42mi |
| 527 Terriere Way New Smyrna Beach, FL | 3.0 | 2.0 | 1490 | $2,400 | $1.61 | 13d | 1 | 1.42mi |
| 466 Bouchelle Dr #305 New Smyrna Beach, FL | 2.0 | 2.0 | 1344 | $3,200 | $2.38 | 25d | 1 | 1.44mi |
| 458 Bouchelle Dr #101 New Smyrna Beach, FL | 2.0 | 2.0 | 1068 | $3,600 | $3.37 | 25d | 1 | 1.45mi |
| 468 Bouchelle Dr New Smyrna Beach, FL | 2.0 | 2.0 | 1072 | $2,400 | $2.24 | 25d | 1 | 1.47mi |
| 1801 Sugartree Cir New Smyrna Beach, FL | 1.0–2.0 | 1.0–2.0 | 720 | $1,825 | $2.53 | 25d | 1 | 1.47mi |
Listing history 4 events
-
2026-03-13status Pending
-
2026-02-11$249,000 Active
-
2000-03-01soldstatus $66,900
-
1976-04-01soldstatus $24,000
ⓘ Source: listings_history table (triggers on properties + properties_extension) + one-shot
backfill from property_details.listing_events for pre-trigger history.
Tax reassessment forecast FL · Resets to sale price
- Current annual tax
- $3,554 · $296/mo
- Projected year-2 tax
- $3,554 · $296/mo
- Expected delta
- $0/yr ($0/mo · 0.0%)
ⓘ Screening estimate from a state-policy table — verify with the county assessor before closing.
Climate risk First Street
- Flood 6/10 Major FEMA zone X (unshaded) · 54% chance over 30 yrs
- Wildfire 4/10 Moderate
- Heat 10/10 Extreme 7 d/yr ≥105°F today · 20 d/yr by 30 yrs out
- Wind 10/10 Extreme 99% chance of damaging wind over 30 yrs
- Air quality 2/10 Low 1 unhealthy d/yr today · 1 by 30 yrs out
Nearby sold comps map
Loading sold comps map…
Walkable amenities ~0.75 mi
Loading nearby amenities…
Taxation est. · year 1
- Rental income
- $29,679
- − Mortgage interest
- −$13,948
- − Property taxes
- −$3,554
- − Insurance
- −$1,245
- − Repairs & maintenance
- −$2,374
- − Management
- −$2,374
- − Depreciation
- −$7,244
- Taxable loss
- −$1,060
- Est. tax savings @ 24.0%
- +$254
- After-tax cash flow
- $3,232/yr
For passive investors: Depreciation is non-cash, so a rental often shows a tax loss while cash-flowing — sheltering income. Rental losses are passive: they offset passive income freely, and up to $25,000/yr can offset ordinary (W-2) income if you actively participate and your MAGI is under $100k (phasing out to $0 by $150k); unused losses carry forward. On sale, claimed depreciation is recaptured at up to 25%, and gains may owe capital-gains tax (a 1031 exchange can defer both). Figures are a year-1 estimate at your 24.0% rate — not tax advice; consult a CPA.
Schools (NCES district)
- District
- Volusia
- NCES district ID
- 1201920
- Math proficiency
- 44% ▼ -9.00%
- Reading proficiency
- 49% ▼ -3.00%
- Median HH income
- $42,946
- Composite
- 39.2/100
- National rank
- #4019
- State rank
- #47 of 73 in FL
Livability — New Smyrna Beach
- Score
- 69/100
- State rank
- #474
- US rank
- #8577
Category grades
Schools grade is shown separately in the Schools card above.
Census & demographics
- Census place
- New Smyrna Beach, FL
- County
- Volusia County · 556,871 people
- City population
- 42,039
- Metro
- Deltona-Daytona Beach-Ormond Beach, FL
- Population (ZIP)
- 31,847
- Household income
- $77,083
- Rent vs Own
- Severe rent burden
- 1139.0
Population outlook (Volusia County) Hauer SSP2
- Today (2025)
- 572,749 people
- By 2030
- 598,695 · +4.5%
- By 2040
- 644,880 · +12.6%
- By 2050
- 681,451 · +19.0%
- By 2075
- 759,957 · +32.7%
- By 2100
- 778,902 · +36.0%
Race, ethnicity, and origin ACS 2023
- Neighborhood character
- Predominantly White (85%)
- Race & ethnicity
- White 85% Hispanic / Latino 6% Black 5% Two or more races 4%
- Hispanic origin (detail)
- Mexican 2% Puerto Rican 1%
- Common ancestry
- Romanian 4% Italian 3% Lithuanian 2%
- Foreign-born
- 5% · Canada, Vietnam
- Languages at home
- 93% English-only · Spanish 5% Other Indo-European 1%
Political lean MEDSL · Volusia
- 2024 margin
- Strong R (+21.8) · D 38.7% · R 60.5%
- 2008→2024 swing
- -27.4pp toward R · 2008: 5.7pp · 2024: -21.8pp
- All cycles
- 2024: R+21.8 2020: R+14.1 2016: R+13.1 2012: R+1.2 2008: D+5.7
Not yet ingested
- Civics
- —
Market trends
- HPI YoY
- ▼ -129.58%
- Current HPI
- 350.4259
- Rent YoY
- ▲ 5.60%
- Metro
- Deltona-Daytona Beach-Ormond Beach, FL
- State GDP YoY
- ▲ 3.28%
- F500 in state
- 36
Industry mix (Fortune 500 HQ in FL)
| Industry | F500 HQs | Revenue |
|---|---|---|
| Industrial Technology | 2 | $29B |
|
||
| Insurance | 2 | $17B |
|
||
| Retail | 1 | $60B |
|
||
| Technology Distribution | 1 | $58B |
|
||
| Homebuilding | 1 | $35B |
|
||
| Technology Manufacturing | 1 | $35B |
|
||
Price history
+937.5% since first listed4 events — show timeline
- 2026-03-13 Pending — Stellar MLS as Distributed by MLS Grid
- 2026-02-11 Listed $249,000 Stellar MLS as Distributed by MLS Grid
- 2000-03-01 Sold (Public Records) $66,900 Public Records
- 1976-04-01 Sold (Public Records) $24,000 Public Records
Property tax history
+6.6%/yrLatest (2025): $3,554 · +3.9% YoY. Source: county tax records.
Cash-flow waterfall
monthlySold comps — $/sqft
last 12 mo · ≤1 miLoading sold comps…