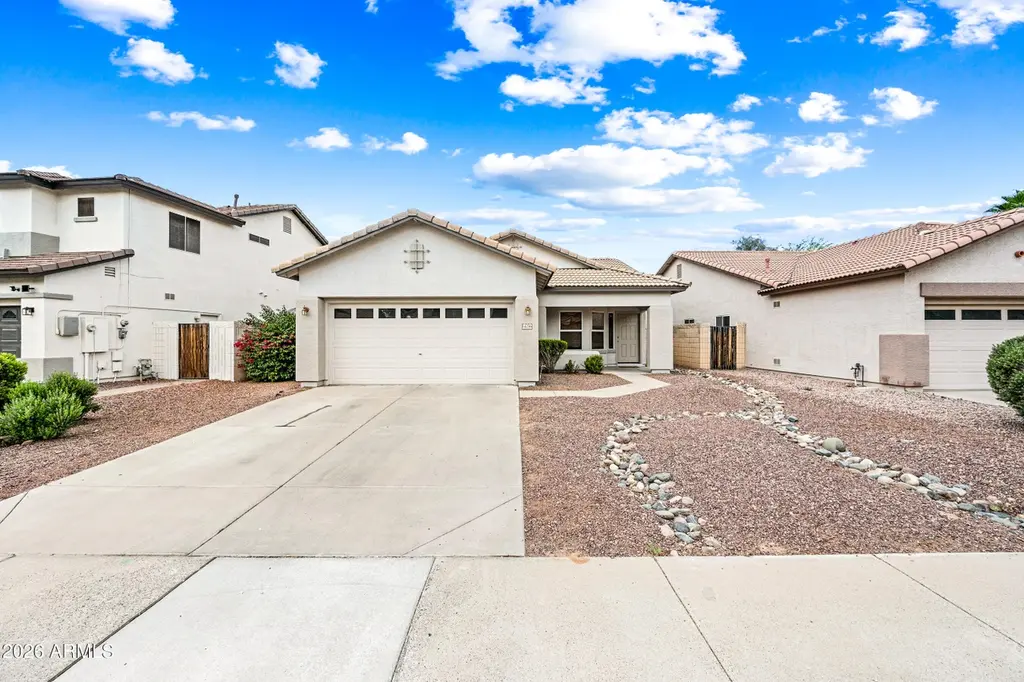
14236 W Columbus Ave · Goodyear, AZ
Flood risk 1/10 · Minimal
- FEMA flood zone
- X (shaded)
- Chance of flooding over 30 yrs
- 0.0%
- Est. flood insurance / yr
- $507 – $1,088
Fire risk 2/10 · Minimal
- Est. fire insurance / yr
- $610 – $1,132
Heat risk 9/10 · Severe
- Hot days now (above 114°F)
- 7 days/yr
- Hot days in 30 yrs
- 18 days/yr
Wind risk 1/10 · Minimal
- Chance of severe wind over 30 yrs
- —
Air-quality risk 1/10 · Minimal
- Unhealthy air days now
- 0 days/yr
- Unhealthy air days in 30 yrs
- 0 days/yr
Risk factors via First Street. Map © Google.
Why this score? — see what drove the D grade
The composite is a weighted blend of 9 inputs, each scored 0–100. Each bar is that input's sub-score; the figure is the points it added to the 100-point composite (weight × sub-score).
- ARV discount +12.5/15.0
- Cash flow +9.9/30.0
- Appreciation +6.0/10.0
- Livability +3.8/5.0
- DSCR +2.8/10.0
- Schools +2.8/10.0
- Condition / age +2.5/5.0
- 1% rule +2.1/10.0
- Rent growth +1.7/5.0
$349,000
🖨 Deal sheet 📄 Offer letter ✓ Due diligence
Listing remarks
Beautifully updated single-level home featuring 3 bedrooms, PLUS a dedicated office, and a unique yet highly functional floor plan designed for comfortable everyday living. Fresh new carpet and interior paint gives the home a clean, move-in-ready feel, while extra kitchen storage adds convenience and practicality. At this price point some might consider this is an investor special. Well it is that in price as very much below market but has new flooring and new paint interior and exterior AND in good condition! Just a beautiful home at below market pricing! Enjoy covered front and back patios perfect for relaxing or entertaining year-round. Ideally located near community parks, neighborho
Key facts
- Unique floor plan
- Covered front patio
- Covered back patio
Tags
Property features AI
Finance
- Other: Lot size reported from assessor; Directions: West on Indian School; North on 144th Ave; right on 142nd Ave; curve then right on W Columbus
- Financial info: Conventional financing available (non-assumable)
- HOA & community: Monthly HOA fee of $50 covering grounds maintenance; Community playground; Biking/walking paths; Association rules restrict visible trucks, trailers, RVs, boats
Exterior
- Parking: 2 covered parking spaces; 2‑car garage
- Security: Owned security system
- Utilities: City water; Public sewer
- Home design: Single-family residence; Fee simple ownership
- Construction: Stucco and painted wood-frame construction; Block accents; Tile roof
- Exterior features: Misting system; Sprinklers in front and rear; Desert front landscaping; Block fencing
Interior
- Kitchen: Refrigerator; Dishwasher; Garbage disposal; Eat-in kitchen with breakfast bar
- Bedrooms: Up to 4 bedrooms (possible)
- Flooring: Carpet; Tile
- Bathrooms: 2 full bathrooms
- Heating & cooling: Natural gas heating; Central air conditioning; Ceiling fans
- Interior features: High-speed internet; Double vanity in bathroom; Eat-in kitchen; Breakfast bar; Vaulted ceilings; Full bath in master bedroom; See remarks / other
- Laundry & utility: No laundry hookups indicated
Neighborhood map
What this means for you Summary
Snapshot
- This is a 3-bed/3.0-bath single-family listed at $349k.
Deal economics
- At list price, monthly cash flow is $-217 ($-3k/yr) — negative.
- To cash-flow at today's rent, offer at most $311k (11.0% below list).
- To meet the 1% rule (rent ≥ 1% of price), the offer needs to be $248k (29.0% below list).
- Recommended offer: $248k (29.0% below list) — sets the bar for 1% rule.
- Cap rate 5.5% vs local median 3.0% in Goodyear — top-decile yield for the area; either an underpriced asset or a hidden risk that comps aren't pricing in. Stress-test before assuming the spread holds.
Location & tenants
- Location reads 76/100 on livability (#15 in AZ, #3,737 nationally) — a middle-class / working-renter tenant base. Strengths: employment A+, housing A+, crime B+; Watch: health & safety D+, cost of living D, amenities F.
- Agua Fria Union High School District (4289) (suburban): math 24% / reading 37% proficiency, ranked #99 of 249 in AZ (top 40%) — families likely to look elsewhere, expect single-tenant / working-renter base with shorter leases.
- Zoned schools: Millennium High School (math 39% / reading 55%, grade D-, #50 of 381 statewide, top 14%, 2,121 students, 21% FRL).
- Zoned-school proficiency averages 47% at this address vs 30% district-wide (+16 pts) — the actual schools serving this property are materially stronger than the Agua Fria Union High School District (4289) average implies; a family-tenant draw the district grade alone would hide.
- Market conditions: Rents falling (-3.4%/yr); 347 active listings in the ZIP; 40 comparable units currently listed for rent nearby; rentals leasing fast (median 1d on market — plan ~1-2 weeks tenant-placement turnaround); solid renter incomes; 36,011 units permitted in Maricopa County in 2024 (12,801 in 5+ unit buildings).
Forward outlook
- In year one you build about $10k of equity ($2k loan paydown + $7k appreciation (2.0% local appreciation)).
- Maricopa County population projected at +38% by 2050 — long-run rental-demand tailwind backs the buy-and-hold thesis.
- By year 4, paydown + projected appreciation supports a ~$33k cash-out refi (75% LTV) — recoverable capital for the next deal without selling this one.
Negotiation context
- Only 6 days on market — expect competitive offers; lowballing is unlikely to land.
- 4 sale attempts since 21y ago with the ask held roughly flat each time — persistent listings suggest the price (not the market) is what's stuck; bring a comps-based counter.
- Current owner paid $211k; list at $349k implies a 65% gain — meaningful room to come down on a strong offer.
Risks & watch-outs
- Climate carrying-cost: extreme-heat days projected 7→18/yr by 2055 (HVAC capex compounding) — expect insurance premiums to compound above CPI over the hold.
Questions for the listing agent
- What do current leases actually rent for vs. the listed asking? Can we see a recent rent roll and the last 12 months of T-12 income?
- What does the HOA fee cover, when was the last increase, and are there any pending special assessments or reserve-fund shortfalls?
- Is there a deadline driving the sale (1031 exchange, divorce, estate, relocation)? That informs how much negotiation room exists.
- Schools are B-rated — typically a magnet for longer-tenancy family renters. What's the average tenant stay here, and is there a school-zone premium baked into asking?
- The area grade is low — what's the realistic commute time and amenity access for the typical tenant pool here? Any planned neighborhood developments (good or bad) we should know about?
- What's the average days-on-market for RENTAL listings here right now (not sales)? A rising rental-DOM trend means longer vacancies and softer asking-rent achievability than the comps imply.
- What's the recent tenant-quality profile in this submarket — average credit score on applications, eviction rate, late-payment / NSF rate, and stable-employment percentage? A property-management company in the area should have these aggregated.
- How much new for-sale + rental construction is in the pipeline within 1–3 miles? Heavy new supply typically softens prices + rents 12–24 months out; constrained supply supports both.
Investment metrics
- 1% rule
- 0.71% ✗
- Cap rate
- 5.55%
- Cash-on-cash
- -2.66%
- DSCR
- 0.88
- GRM
- 11.7
CMA / ARV
- ARV (on-the-fly)
- $392,704
- Comps found
- 12
Show comp detail 12 sales within ~0.75 mi
| Address | Dist | Beds/Ba | Sqft | Sold | Price | $/sf | Match |
|---|---|---|---|---|---|---|---|
| 14236 W Columbus Ave | 0.00mi | 3/2.0 | 1,534 (0%) | 0mo | $349,000 | $228 | 96 |
| 14192 W Clarendon Ave | 0.11mi | 3/2.0 | 1,534 (0%) | 1mo | $337,500 | $220 | 90 |
| 14301 W Mitchell Dr | 0.16mi | 3/2.0 | 1,534 (0%) | 2mo | $400,000 | $261 | 87 |
| 14149 W Weldon Ave | 0.09mi | 4/2.0 (+1) | 1,534 (0%) | 2mo | $370,000 | $241 | 85 |
| 14269 W Verde Ln | 0.38mi | 3/2.0 | 1,560 (+2%) | 3mo | $400,000 | $256 | 73 |
| 14361 W Avalon Dr | 0.40mi | 3/2.0 | 1,560 (+2%) | 4mo | $408,000 | $262 | 71 |
| 193 W Laguna Dr | 0.50mi | 3/2.0 | 1,620 (+6%) | 2mo | $400,000 | $247 | 62 |
| 14148 W Fairmount Ave | 0.23mi | 3/2.0 | 1,748 (+14%) | 3mo | $375,000 | $215 | 60 |
| 14060 W Edgemont Ave | 0.65mi | 3/2.0 | 1,579 (+3%) | 2mo | $383,500 | $243 | 59 |
| 320 W Pacifico Cir | 0.30mi | 3/2.0 | 1,755 (+14%) | 3mo | $580,000 | $330 | 56 |
| 420 E Cascada Rd | 0.71mi | 3/2.0 | 1,610 (+5%) | 2mo | $590,000 | $366 | 53 |
| 356 S Moreno Cir | 0.35mi | 4/2.0 (+1) | 1,764 (+15%) | 1mo | $535,000 | $303 | 49 |
Match score weights: distance 35% · size 25% · config 20% · recency 20%. Top-matched comps best support the ARV.
Projected returns pro-forma
2.04% appreciation · 0.0% rent growth · sell at horizon
- IRR
- 0.7%
- Equity multiple
- 1.03×
- Total profit
- $3,405
- Equity at exit
- $138,353
- IRR
- 3.5%
- Equity multiple
- 1.47×
- Total profit
- $45,446
- Equity at exit
- $199,768
Cash invested: $97,720 (down + closing). Projections, not guarantees.
Landlord ↔ Tenant lean methodology
- Overall (STATE)
- 87 Strongly Landlord-Friendly
- State Arizona
- 87 Strongly Landlord-Friendly · R+3
- County
- — inherits STATE
- City
- — inherits STATE
ZIP-level market 85395
- Home prices YoY
- 0.8%
- Rents YoY
- -3.4%
- Active inventory
- 347
- Price-to-rent
- 11.7×
Monthly cashflow live
- Estimated rent
- $2,478 high interval (Pro) →
- Mortgage (P&I)
- −$1,830
- Tax from tax record
- −$148 /mo · $1,781/yr
- Insurance
- −$145
- HOA
- −$50
- Vacancy / Maint / Mgmt
- −$520
- Net cashflow
- $-217
Break-even live
UW: 25.0% down · 7.5% · 30yr · 1.5% tax · 5.0% vac · 8.0% maint · 8.0% mgmt
Financing live
Cash to close
- Down payment
- $87,250
- Closing costs
- $10,470
- Reserves months
- —
- Total cash needed
- —
Loan-product check · same deal, 3 products live
Conventional
25% down · 7.5% · 30yr
- Down + closing
- —
- Monthly P&I
- —
- Monthly cashflow
- —
- DSCR
- —
- Eligible?
- —
Personal DTI + credit; lowest rate.
DSCR
20% down · 8.5% · 30yr
- Down + closing
- —
- Monthly P&I
- —
- Monthly cashflow
- —
- DSCR
- —
- Eligible?
- —
No personal income docs; deal must DSCR.
Hard money
10% down · 12.0% · 12mo
- Down + closing
- —
- Monthly P&I
- —
- Monthly cashflow
- —
- DSCR
- —
- Eligible?
- —
Short-term bridge; refi at stabilization.
Rent comps 40 comps
| Address | Beds | Baths | Sqft | Rent | $/sqft | DOM | Units | Dist |
|---|---|---|---|---|---|---|---|---|
| 14226 W Columbus Ave Goodyear, AZ | 4.0 | 2.0 | 1656 | $1,999 | $1.21 | 1d | 1 | 0.02mi |
| 14265 W Lexington Ave Goodyear, AZ | 3.0 | 3.0 | 1655 | $2,800 | $1.69 | 1d | 1 | 0.24mi |
| 14488 W Weldon Ave Goodyear, AZ | 3.0 | 2.0 | 1550 | $1,850 | $1.19 | 1d | 1 | 0.31mi |
| 292 S Desert Ave Unit 1545854P Litchfield Park, AZ | 3.0 | 3.0 | 1776 | $3,788 | $2.13 | 12d | 1 | 0.35mi |
| 14385 W Verde Ln Goodyear, AZ | 4.0 | 2.5 | 2144 | $2,595 | $1.21 | 23d | 1 | 0.46mi |
| 14385 W Verde Ln Goodyear, AZ | 4.0 | 2.5 | 2144 | $2,595 | $1.21 | 21d | 1 | 0.46mi |
| 14250 W Wigwam Blvd Litchfield Park, AZ | 1.0–2.0 | 1.0–2.0 | 1151 | $3,400 | $2.95 | 1d | 6 | 0.48mi |
| 14200 W Village Pkwy #122 Litchfield Park, AZ | 2.0 | 2.0 | 1933 | $2,400 | $1.24 | 1d | 1 | 0.58mi |
| 400 S Paladin Cir Litchfield Park, AZ | 3.0 | 2.0 | 1624 | $2,295 | $1.41 | 1d | 1 | 0.59mi |
| 153 Bahia Ln E Litchfield Park, AZ | 3.0 | 2.0 | 1688 | $2,650 | $1.57 | 1d | 1 | 0.66mi |
| 14200 W Village Pkwy #2288 Litchfield Park, AZ | 3.0 | 2.0 | 2210 | $3,500 | $1.58 | 1d | 1 | 0.67mi |
| 14750 W Avalon Dr Goodyear, AZ | 2.0 | 2.0 | 1570 | $4,000 | $2.55 | 1d | 1 | 0.73mi |
| 837 W Village Pkwy Litchfield Park, AZ | 4.0 | 3.0 | 2181 | $2,595 | $1.19 | 1d | 1 | 0.75mi |
| 2801 N Litchfield Rd Goodyear, AZ | 2.0 | 2.0 | 1156 | $1,972 | $1.71 | 24d | 2 | 0.80mi |
| 14909 W Crenshaw Dr Goodyear, AZ | 2.0 | 2.0 | 1829 | $2,700 | $1.48 | 1d | 1 | 0.82mi |
| 2801 N Litchfield Rd #26 Goodyear, AZ | 2.0 | 2.0 | 1265 | $2,295 | $1.81 | 1d | 1 | 0.84mi |
| 14813 W Verde Ln Goodyear, AZ | 2.0 | 2.5 | 1671 | $4,000 | $2.39 | 1d | 1 | 0.95mi |
| 14214 W Harvard St Goodyear, AZ | 2.0 | 2.0 | 2099 | $2,500 | $1.19 | 1d | 1 | 1.06mi |
| 13271 W Clarendon Ave Litchfield Park, AZ | 3.0 | 2.0 | 1600 | $2,100 | $1.31 | 1d | 1 | 1.10mi |
| 3923 N 151st Ave Goodyear, AZ | 2.0 | 2.0 | 1445 | $3,000 | $2.08 | 1d | 1 | 1.15mi |
| 2551 N 149th Ave Goodyear, AZ | 3.0 | 3.0 | 1573 | $2,300 | $1.46 | 1d | 1 | 1.18mi |
| 2400 N Bullard Ave Goodyear, AZ | 1.0–2.0 | 1.0–2.0 | 989 | $1,599 | $1.62 | 1d | 17 | 1.19mi |
| 4551 Luna Rd W Litchfield Park, AZ | 3.0 | 2.0 | 1736 | $2,195 | $1.26 | 19d | 1 | 1.20mi |
| 15089 W Verde Ln Goodyear, AZ | 2.0 | 2.0 | 1450 | $2,200 | $1.52 | 12d | 1 | 1.22mi |
| 4175 N Falcon Dr Goodyear, AZ | 1.0–3.0 | 1.0–2.0 | 1064 | $2,299 | $2.16 | 1d | 31 | 1.23mi |
| 13140 W Fairmont Ave Litchfield Park, AZ | 3.0 | 2.0 | 1539 | $1,950 | $1.27 | 21d | 1 | 1.28mi |
| 14313 W Alvarado Dr Goodyear, AZ | 4.0 | 2.0 | 1812 | $2,200 | $1.21 | 1d | 1 | 1.28mi |
| 2100 N 145th Ave Goodyear, AZ | 1.0–3.0 | 1.0–2.0 | 1009 | $1,926 | $1.91 | 1d | 26 | 1.29mi |
| 15264 W Mulberry Dr Goodyear, AZ | 2.0 | 2.0 | 1641 | $2,300 | $1.40 | 1d | 1 | 1.32mi |
| 14870 W Encanto Blvd #2102 Goodyear, AZ | 2.0 | 2.0 | 1329 | $2,500 | $1.88 | 1d | 1 | 1.35mi |
| 13101 W Indianola Ave Litchfield Park, AZ | 4.0 | 2.0 | 1539 | $1,895 | $1.23 | 16d | 1 | 1.36mi |
| 14951 W Wilshire Dr Goodyear, AZ | 3.0 | 3.0 | 1573 | $5,900 | $3.75 | 1d | 1 | 1.37mi |
| 13620 W Cypress St Goodyear, AZ | 3.0 | 2.5 | 2024 | $2,850 | $1.41 | 1d | 1 | 1.37mi |
| 4200 N Falcon Dr Goodyear, AZ | 1.0–3.0 | 1.0–2.0 | 935 | $2,199 | $2.35 | 1d | 9 | 1.40mi |
| 2218 N 135th Dr Goodyear, AZ | 3.0 | 2.0 | 1572 | $1,949 | $1.24 | 1d | 1 | 1.41mi |
| 3691 N 153rd Ln Goodyear, AZ | 2.0 | 2.0 | 1445 | $4,000 | $2.77 | 1d | 1 | 1.41mi |
| 1891 N Litchfield Rd Goodyear, AZ | 1.0–3.0 | 1.0–2.0 | 1106 | $2,199 | $1.99 | 1d | 31 | 1.45mi |
| 14965 W Encanto Blvd Goodyear, AZ | 3.0 | 1.0–2.0 | 1016 | $2,342 | $2.30 | 1d | 72 | 1.46mi |
| 1830 N 145th Ave Goodyear, AZ | 1.0–2.0 | 1.0–2.0 | 937 | $1,747 | $1.86 | 1d | 10 | 1.48mi |
| 15369 W Westview Dr Goodyear, AZ | 3.0 | 2.5 | 2230 | $3,599 | $1.61 | 10d | 1 | 1.48mi |
HOA detail
- Monthly dues
- $50 · $600/yr
Listing history 10 events
-
2026-05-14status Pending
-
2026-05-08$349,000 Active
-
2009-06-28historical
-
2009-02-09$169,000
-
2008-03-13historical
-
2007-07-06$239,000
-
2005-03-30soldstatus $211,000
-
2005-02-25historical
-
2005-02-24$205,000
-
2001-05-07soldstatus $102,271
ⓘ Source: listings_history table (triggers on properties + properties_extension) + one-shot
backfill from property_details.listing_events for pre-trigger history.
Tax reassessment forecast AZ · Resets to sale price
- Current annual tax
- $1,781 · $148/mo
- Projected year-2 tax
- $2,303 · $192/mo
- Expected delta
- +$522/yr (+$43/mo · 29.3%)
ⓘ Screening estimate from a state-policy table — verify with the county assessor before closing.
Climate risk First Street
- Flood 1/10 Low FEMA zone X (shaded) · 0% chance over 30 yrs
- Wildfire 2/10 Low
- Heat 9/10 Extreme 7 d/yr ≥114°F today · 18 d/yr by 30 yrs out
- Wind 1/10 Low
- Air quality 1/10 Low 0 unhealthy d/yr today · 0 by 30 yrs out
Nearby sold comps map
Loading sold comps map…
Walkable amenities ~0.75 mi
Loading nearby amenities…
Taxation est. · year 1
- Rental income
- $29,730
- − Mortgage interest
- −$19,549
- − Property taxes
- −$1,781
- − Insurance
- −$1,745
- − Repairs & maintenance
- −$2,378
- − Management
- −$2,378
- − HOA
- −$600
- − Depreciation
- −$10,153
- Taxable loss
- −$8,855
- Est. tax savings @ 24.0%
- +$2,125
- After-tax cash flow
- $-477/yr
For passive investors: Depreciation is non-cash, so a rental often shows a tax loss while cash-flowing — sheltering income. Rental losses are passive: they offset passive income freely, and up to $25,000/yr can offset ordinary (W-2) income if you actively participate and your MAGI is under $100k (phasing out to $0 by $150k); unused losses carry forward. On sale, claimed depreciation is recaptured at up to 25%, and gains may owe capital-gains tax (a 1031 exchange can defer both). Figures are a year-1 estimate at your 24.0% rate — not tax advice; consult a CPA.
Schools (NCES district)
- District
- Agua Fria Union High School District (4289)
- NCES district ID
- 0400450
- Math proficiency
- 24% ▼ -32.00%
- Reading proficiency
- 37% ▼ -12.00%
- Median HH income
- $64,107
- Composite
- 27.92/100
- National rank
- #6865
- State rank
- #99 of 249 in AZ
Livability — Goodyear
- Score
- 76/100
- State rank
- #15
- US rank
- #3737
Category grades
Schools grade is shown separately in the Schools card above.
Census & demographics
- Census place
- Goodyear, AZ
- County
- Maricopa County · 4,537,380 people
- City population
- 107,865
- Metro
- Phoenix-Mesa-Chandler, AZ
- Population (ZIP)
- 40,414
- Household income
- $105,935
- Rent vs Own
- Severe rent burden
- 814.0
Population outlook (Maricopa County) Hauer SSP2
- Today (2025)
- 4,979,203 people
- By 2030
- 5,378,229 · +8.0%
- By 2040
- 6,156,598 · +23.6%
- By 2050
- 6,872,376 · +38.0%
- By 2075
- 8,401,270 · +68.7%
- By 2100
- 9,247,439 · +85.7%
Race, ethnicity, and origin ACS 2023
- Neighborhood character
- Diverse neighborhood (Simpson 0.57)
- Race & ethnicity
- White 60% Hispanic / Latino 24% Two or more races 14% Black 5% Asian 4% Native American 2%
- Hispanic origin (detail)
- Mexican 19%
- Common ancestry
- Romanian 3% Portuguese 3% Slovak 2%
- Foreign-born
- 9% · Canada, Vietnam
- Languages at home
- 84% English-only · Spanish 11% Other Indo-European 1% Tagalog/Filipino 1%
Political lean MEDSL · Maricopa
- 2024 margin
- Toss-up / Even · D 47.7% · R 51.2% · Other 1.1%
- 2008→2024 swing
- +7.1pp toward D · 2008: -10.6pp · 2024: -3.5pp
- All cycles
- 2024: R+3.5 2020: D+2.2 2016: R+3.5 2012: R+12.0 2008: R+10.6
Not yet ingested
- Civics
- —
Market trends
- HPI YoY
- ▲ 2.04%
- Current HPI
- 259.7131
- Rent YoY
- ▼ -3.38%
- Metro
- Phoenix-Mesa-Chandler, AZ
- State GDP YoY
- ▲ 4.54%
- F500 in state
- 20
Industry mix (Fortune 500 HQ in AZ)
| Industry | F500 HQs | Revenue |
|---|---|---|
| Technology | 2 | $13B |
|
||
| Mining / Metals | 1 | $23B |
|
||
| Environmental Services | 1 | $16B |
|
||
| Metals / Steel | 1 | $14B |
|
||
| Technology Distribution | 1 | $9B |
|
||
| Homebuilding | 1 | $8B |
|
||
Price history
+241.3% since first listed10 events — show timeline
- 2026-05-14 Pending — ARMLS
- 2026-05-08 Listed $349,000 ARMLS
- 2009-06-28 Listing Removed — ARMLS
- 2009-02-09 Listed $169,000 ARMLS
- 2008-03-13 Listing Removed — ARMLS
- 2007-07-06 Listed $239,000 ARMLS
- 2005-03-30 Sold (MLS) $211,000 ARMLS
- 2005-02-25 Listing Removed — ARMLS
- 2005-02-24 Listed $205,000 ARMLS
- 2001-05-07 Sold (Public Records) $102,271 Public Records
Property tax history
+0.7%/yrLatest (2025): $1,781 · +3.7% YoY. Source: county tax records.
Cash-flow waterfall
monthlySold comps — $/sqft
last 12 mo · ≤1 miLoading sold comps…