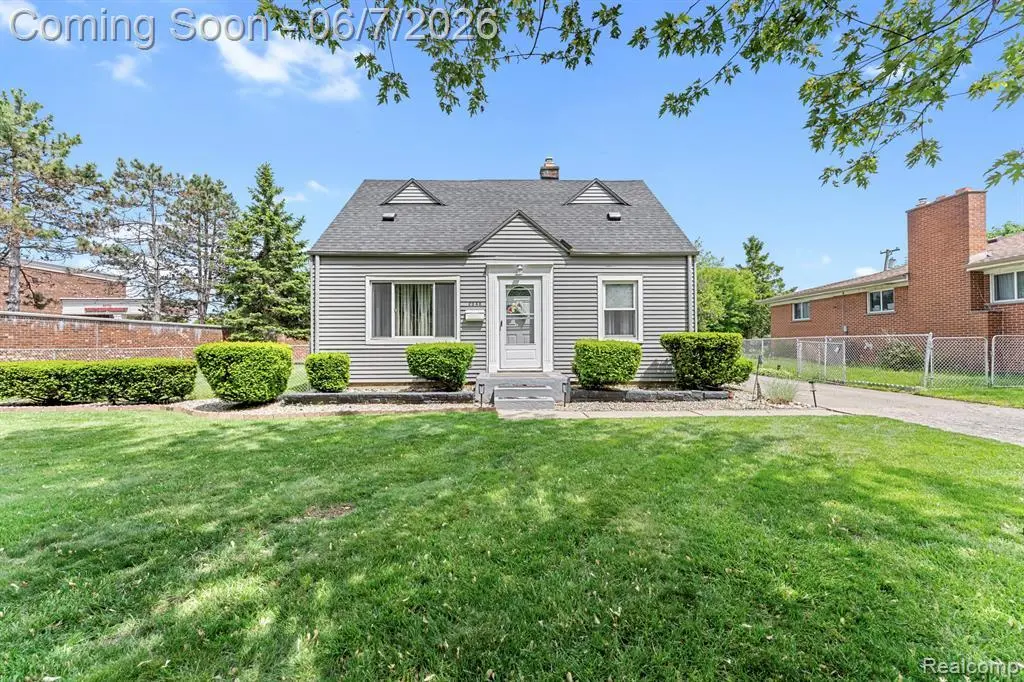
2048 Arcola St · Garden City, MI
Flood risk 1/10 · Minimal
- FEMA flood zone
- X (unshaded)
- Chance of flooding over 30 yrs
- 0.0%
- Est. flood insurance / yr
- $507 – $1,088
Fire risk 1/10 · Minimal
- Est. fire insurance / yr
- $784 – $1,456
Heat risk 3/10 · Minor
- Hot days now (above 98°F)
- 7 days/yr
- Hot days in 30 yrs
- 15 days/yr
Wind risk 2/10 · Minimal
- Chance of severe wind over 30 yrs
- —
Air-quality risk 2/10 · Minimal
- Unhealthy air days now
- 1 days/yr
- Unhealthy air days in 30 yrs
- 2 days/yr
Risk factors via First Street. Map © Google.
Why this score? — see what drove the C- grade
The composite is a weighted blend of 9 inputs, each scored 0–100. Each bar is that input's sub-score; the figure is the points it added to the 100-point composite (weight × sub-score).
- Cash flow +19.8/30.0
- ARV discount +6.7/15.0
- DSCR +6.3/10.0
- 1% rule +5.0/10.0
- Livability +4.1/5.0
- Rent growth +3.4/5.0
- Schools +2.6/10.0
- Condition / age +2.5/5.0
- Appreciation +0.0/10.0
$165,000
🖨 Deal sheet 📄 Offer letter ✓ Due diligence
Listing remarks
Welcome Home! This lovely, well-maintained 3 bedroom bungalow sits on a spacious lot and is ready for the next owner. The inviting living room is filled with natural light and flows into a spacious dining area with charming built-ins, adding character and functionality. The updated kitchen has plenty of cabinets and counter space, with appliances included. The main floor also offers a comfortable bedroom, an updated full bath, and convenient first-floor laundry. Upstairs, you'll find two generously sized bedrooms along with plenty of closet and storage space. Outside, enjoy the huge fenced backyard, perfect for summer activities, as well as a nice patio for relaxing with your morning coffee
Key facts
- 0.23 acre lot
- Garage
- Built 1941
Property features AI
Exterior
- Parking: Detached garage with electricity; Approximately 1.5 parking spaces in garage
- Utilities: Public water; Natural gas heating and gas water heater; Electric service (garage has electric)
- Home design: Residential property; 1 1/2 story structure; Built in 1941
- Construction: Aluminum exterior; Crawl foundation; Shingle roof (not specified in data)
- Exterior features: Fenced yard; Patio; Paved street access
Interior
- Kitchen: Kitchen at entry level, approx. 11 x 9; Appliances included: Range/Oven, Microwave, Refrigerator, Dishwasher
- Bedrooms: Bedroom 1 (Entry): 11 x 8, laminate flooring; Bedroom 2 (Second): 14 x 12, wood flooring; Bedroom 3 (Second): 12 wide, wood flooring
- Flooring: Laminate flooring in living room, dining room, kitchen, bathroom and bedroom 1; Wood flooring in bedrooms 2 and 3; Concrete flooring in laundry room
- Bathrooms: 1 full bathroom (Entry level), laminate flooring, approx. 7 x 5
- Heating & cooling: Forced air heating; Natural gas fuel
- Interior features: 8 total rooms; Ceiling fan(s)
- Laundry & utility: Laundry room at entry level, approx. 11 x 6, concrete floor; Washer and Dryer included; Gas water heater
Neighborhood map
What this means for you Summary
Snapshot
- This is a 3-bed/1.0-bath single-family listed at $165k.
Deal economics
- At list price, monthly cash flow is $197 ($2k/yr) — positive.
- The deal already cash-flows at list — no discount required.
- To meet the 1% rule (rent ≥ 1% of price), the offer needs to be $164k (0.4% below list).
- Recommended offer: $164k (0.4% below list) — sets the bar for 1% rule.
- Cap rate 7.7% vs local median 5.8% in Garden City — top-decile yield for the area; either an underpriced asset or a hidden risk that comps aren't pricing in. Stress-test before assuming the spread holds.
Location & tenants
- Location reads 82/100 on livability (#53 in MI, #1,047 nationally) — a professional / high-income tenant draw. Strengths: cost of living A+, housing A+, commute A; Watch: employment C-, schools D-.
- Garden City Public Schools (suburban): math 22% / reading 36% proficiency, ranked #365 of 540 in MI (top 68%) — low school quality limits family demand, transient renter base, plan for 1-2y turnover.
- Market conditions: Rents rising (+3.6%/yr); 134 active listings in the ZIP; 14 comparable units currently listed for rent nearby; rentals leasing fast (median 12d on market — plan ~1-2 weeks tenant-placement turnaround); 2,639 units permitted in Wayne County in 2024 (1,216 in 5+ unit buildings).
Forward outlook
- Local home prices are declining (-3.0%/yr); year-one equity from $1k of loan paydown is wiped out by about $5k of value loss. Plan a longer hold.
- Wayne County population projected at -17% by 2050 — secular population decline; favor cash flow + early exit over multi-decade hold.
Negotiation context
- Only 4 days on market — expect competitive offers; lowballing is unlikely to land.
Risks & watch-outs
- Watch-outs: built in 1941 — expect roof / HVAC / electrical / plumbing capex.
Questions for the listing agent
- Built in 1941 — when were the roof, HVAC, electrical panel, plumbing, and water heater last replaced?
- Is there a deadline driving the sale (1031 exchange, divorce, estate, relocation)? That informs how much negotiation room exists.
- Schools are D-rated, which usually means shorter tenancies and higher turnover. Who's the typical renter profile here, and what's been the actual vacancy rate?
- What's the average days-on-market for RENTAL listings here right now (not sales)? A rising rental-DOM trend means longer vacancies and softer asking-rent achievability than the comps imply.
- What's the recent tenant-quality profile in this submarket — average credit score on applications, eviction rate, late-payment / NSF rate, and stable-employment percentage? A property-management company in the area should have these aggregated.
- How much new for-sale + rental construction is in the pipeline within 1–3 miles? Heavy new supply typically softens prices + rents 12–24 months out; constrained supply supports both.
Investment metrics
- 1% rule
- 1.00% ✗
- Cap rate
- 7.73%
- Cash-on-cash
- 5.13%
- DSCR
- 1.23
- GRM
- 8.4
CMA / ARV
- ARV (on-the-fly)
- $162,060
- Comps found
- 12
Show comp detail 12 sales within ~0.75 mi
| Address | Dist | Beds/Ba | Sqft | Sold | Price | $/sf | Match |
|---|---|---|---|---|---|---|---|
| 1782 Gilman St | 0.33mi | 3/1.0 | 879 (+0%) | 7mo | $148,000 | $168 | 78 |
| 2019 Helen St | 0.28mi | 3/1.0 | 934 (+7%) | 4mo | $158,000 | $169 | 73 |
| 28807 Block St | 0.74mi | 3/1.0 | 895 (+2%) | 2mo | $163,200 | $182 | 60 |
| 1843 Lathers St | 0.42mi | 2/1.0 (-1) | 978 (+12%) | 1mo | $179,000 | $183 | 56 |
| 28455 Birchlawn St | 0.56mi | 2/1.0 (-1) | 800 (-9%) | 1mo | $166,000 | $208 | 53 |
| 28538 Block St | 0.67mi | 3/1.0 | 820 (-6%) | 7mo | $140,000 | $171 | 52 |
| 28513 Barton St | 0.73mi | 3/2.0 | 915 (+4%) | 4mo | $241,000 | $263 | 51 |
| 6141 Harrison St | 0.62mi | 2/1.0 (-1) | 812 (-7%) | 4mo | $138,000 | $170 | 50 |
| 5643 Gilman St | 0.36mi | 4/1.0 (+1) | 1,000 (+14%) | 6mo | $190,000 | $190 | 50 |
| 28663 Birchlawn St | 0.68mi | 2/1.0 (-1) | 812 (-7%) | 8mo | $150,000 | $185 | 44 |
| 642 Gilman St | 0.70mi | 2/1.0 (-1) | 779 (-11%) | 0mo | $167,000 | $214 | 44 |
| 6582 Sterling Ct | 0.71mi | 3/1.5 | 1,000 (+14%) | 4mo | $195,000 | $195 | 38 |
Match score weights: distance 35% · size 25% · config 20% · recency 20%. Top-matched comps best support the ARV.
Projected returns pro-forma
-3.0% appreciation · 3.65% rent growth · sell at horizon
- IRR
- -7.6%
- Equity multiple
- 0.72×
- Total profit
- $-13,079
- Equity at exit
- $24,602
- IRR
- 2.7%
- Equity multiple
- 1.20×
- Total profit
- $9,302
- Equity at exit
- $14,266
Cash invested: $46,200 (down + closing). Projections, not guarantees.
Landlord ↔ Tenant lean methodology
- Overall (STATE)
- 62 Landlord-Friendly
- State Michigan
- 62 Landlord-Friendly · EVEN
- County
- — inherits STATE
- City
- — inherits STATE
ZIP-level market 48135
- Rents YoY
- 3.6%
- Active inventory
- 134
- Price-to-rent
- 8.4×
Monthly cashflow live
- Estimated rent
- $1,643 high interval (Pro) →
- Mortgage (P&I)
- −$865
- Tax from tax record
- −$166 /mo · $1,997/yr
- Insurance
- −$69
- HOA
- −$0
- Vacancy / Maint / Mgmt
- −$345
- Net cashflow
- $197
Break-even live
UW: 25.0% down · 7.5% · 30yr · 1.5% tax · 5.0% vac · 8.0% maint · 8.0% mgmt
Financing live
Cash to close
- Down payment
- $41,250
- Closing costs
- $4,950
- Reserves months
- —
- Total cash needed
- —
Loan-product check · same deal, 3 products live
Conventional
25% down · 7.5% · 30yr
- Down + closing
- —
- Monthly P&I
- —
- Monthly cashflow
- —
- DSCR
- —
- Eligible?
- —
Personal DTI + credit; lowest rate.
DSCR
20% down · 8.5% · 30yr
- Down + closing
- —
- Monthly P&I
- —
- Monthly cashflow
- —
- DSCR
- —
- Eligible?
- —
No personal income docs; deal must DSCR.
Hard money
10% down · 12.0% · 12mo
- Down + closing
- —
- Monthly P&I
- —
- Monthly cashflow
- —
- DSCR
- —
- Eligible?
- —
Short-term bridge; refi at stabilization.
Rent comps 14 comps
| Address | Beds | Baths | Sqft | Rent | $/sqft | DOM | Units | Dist |
|---|---|---|---|---|---|---|---|---|
| 5839 Helen St Garden City, MI | 3.0 | 1.0 | 984 | $1,500 | $1.52 | 24d | 1 | 0.38mi |
| 5927 Lathers St Garden City, MI | 3.0 | 1.0 | 1000 | $1,600 | $1.60 | 1d | 1 | 0.52mi |
| 238 Yorkshire Blvd Dearborn Heights, MI | 1.0–2.0 | 1.0 | 741 | $1,424 | $1.92 | 1d | 9 | 0.85mi |
| 6954 Inkster Rd Dearborn Heights, MI | 1.0–2.0 | 1.0–1.5 | 837 | $1,339 | $1.60 | 2d | 9 | 0.92mi |
| 5722 Centralia St Dearborn Heights, MI | 3.0 | 1.0 | 999 | $1,750 | $1.75 | 1d | 1 | 0.99mi |
| 7048 Deering St Garden City, MI | 3.0 | 1.0 | 910 | $1,500 | $1.65 | 17d | 1 | 1.03mi |
| 26322 Westphal St Dearborn Heights, MI | 1.0–2.0 | 1.0 | 762 | $1,455 | $1.91 | 1d | 24 | 1.11mi |
| 181 Terri Dr Unit 181 Dearborn Heights, MI | 2.0 | 2.0 | 840 | $1,119 | $1.33 | 4d | 1 | 1.13mi |
| 79 3rd St Unit 79 Dearborn Heights, MI | 2.0 | 1.0 | 840 | $1,339 | $1.59 | 24d | 1 | 1.19mi |
| 7435 Lathers St Westland, MI | 3.0 | 1.0 | 1120 | $1,900 | $1.70 | 16d | 1 | 1.29mi |
| 167 Cherry Valley Dr Inkster, MI | 1.0–2.0 | 1.0 | 784 | $1,395 | $1.78 | 14d | 12 | 1.29mi |
| 7457 Harrison St Westland, MI | 3.0 | 1.0 | 1120 | $1,900 | $1.70 | 1d | 1 | 1.32mi |
| 7484 Affeldt St Westland, MI | 3.0 | 1.0 | 1120 | $1,500 | $1.34 | 24d | 1 | 1.35mi |
| 536 N Leona Ave Garden City, MI | 3.0 | 1.0 | 1000 | $1,440 | $1.44 | 12d | 1 | 1.41mi |
Listing history 6 events
-
2026-06-13statusdays on market $165,000 Pending 4 DOM
-
2026-06-09days on market $165,000 Active 3 DOM
-
2026-06-08days on market $165,000 Active 2 DOM
-
2026-06-07status $165,000 Active 1 DOM
-
2026-06-04remarks 699-char remark
-
2026-06-04$165,000 Coming Soon 1 DOM
ⓘ Source: listings_history table (triggers on properties + properties_extension) + one-shot
backfill from property_details.listing_events for pre-trigger history.
Tax reassessment forecast MI · Partial reset (capped growth)
- Current annual tax
- $1,997 · $166/mo
- Projected year-2 tax
- $2,269 · $189/mo
- Expected delta
- +$272/yr (+$23/mo · 13.6%)
ⓘ Screening estimate from a state-policy table — verify with the county assessor before closing.
Climate risk First Street
- Flood 1/10 Low FEMA zone X (unshaded) · 0% chance over 30 yrs
- Wildfire 1/10 Low
- Heat 3/10 Moderate 7 d/yr ≥98°F today · 15 d/yr by 30 yrs out
- Wind 2/10 Low
- Air quality 2/10 Low 1 unhealthy d/yr today · 2 by 30 yrs out
Nearby sold comps map
Loading sold comps map…
Walkable amenities ~0.75 mi
Loading nearby amenities…
Taxation est. · year 1
- Rental income
- $19,715
- − Mortgage interest
- −$9,243
- − Property taxes
- −$1,997
- − Insurance
- −$825
- − Repairs & maintenance
- −$1,577
- − Management
- −$1,577
- − Depreciation
- −$4,800
- Taxable loss
- −$304
- Est. tax savings @ 24.0%
- +$73
- After-tax cash flow
- $2,442/yr
For passive investors: Depreciation is non-cash, so a rental often shows a tax loss while cash-flowing — sheltering income. Rental losses are passive: they offset passive income freely, and up to $25,000/yr can offset ordinary (W-2) income if you actively participate and your MAGI is under $100k (phasing out to $0 by $150k); unused losses carry forward. On sale, claimed depreciation is recaptured at up to 25%, and gains may owe capital-gains tax (a 1031 exchange can defer both). Figures are a year-1 estimate at your 24.0% rate — not tax advice; consult a CPA.
Schools (NCES district)
- District
- Garden City Public Schools
- NCES district ID
- 2615540
- Math proficiency
- 22% ▼ -11.00%
- Reading proficiency
- 36% ▼ -13.00%
- Median HH income
- $52,165
- Composite
- 25.53/100
- National rank
- #7433
- State rank
- #365 of 540 in MI
Livability — Garden City
- Score
- 82/100
- State rank
- #53
- US rank
- #1047
Category grades
Schools grade is shown separately in the Schools card above.
Census & demographics
- Census place
- Garden City, MI
- County
- Wayne County · 1,562,939 people
- City population
- 26,739
- Metro
- Detroit-Warren-Dearborn, MI
- Population (ZIP)
- 26,739
- Household income
- $67,294
- Rent vs Own
- Severe rent burden
- 509.0
Population outlook (Wayne County) Hauer SSP2
- Today (2025)
- 1,675,273 people
- By 2030
- 1,620,300 · -3.3%
- By 2040
- 1,502,341 · -10.3%
- By 2050
- 1,384,039 · -17.4%
- By 2075
- 1,124,592 · -32.9%
- By 2100
- 881,193 · -47.4%
Race, ethnicity, and origin ACS 2023
- Neighborhood character
- Predominantly White (82%)
- Race & ethnicity
- White 82% Two or more races 8% Black 7% Hispanic / Latino 5%
- Hispanic origin (detail)
- Mexican 5%
- Common ancestry
- Romanian 13% Italian 4% Slovak 3%
- Foreign-born
- 4% · Canada
- Languages at home
- 94% English-only · Arabic 3% Spanish 1% Other Indo-European 1%
Political lean MEDSL · Wayne
- 2024 margin
- Strong D (+29.0) · D 62.7% · R 33.7% · Other 3.6%
- 2008→2024 swing
- -20.5pp toward R · 2008: 49.5pp · 2024: 29.0pp
- All cycles
- 2024: D+29.0 2020: D+38.1 2016: D+37.3 2012: D+46.9 2008: D+49.5
Not yet ingested
- Civics
- —
Market trends
- HPI YoY
- ▼ -265.28%
- Current HPI
- 212.5713
- Rent YoY
- ▲ 3.65%
- Metro
- Detroit-Warren-Dearborn, MI
- State GDP YoY
- ▲ 1.37%
- F500 in state
- 28
Industry mix (Fortune 500 HQ in MI)
| Industry | F500 HQs | Revenue |
|---|---|---|
| Automotive Parts | 3 | $48B |
|
||
| Automotive | 2 | $372B |
|
||
| Chemicals | 1 | $45B |
|
||
| Automotive Retail | 1 | $29B |
|
||
| Healthcare / Medical Devices | 1 | $23B |
|
||
| Automotive Technology | 1 | $20B |
|
||
Price history
1 event — show timeline
- 2026-06-03 Coming Soon $165,000 MiRealSource-MiMLS
Property tax history
+3.3%/yrLatest (2025): $1,997 · +3.7% YoY. Source: county tax records.
Cash-flow waterfall
monthlySold comps — $/sqft
last 12 mo · ≤1 miLoading sold comps…