5356 81st St N · West Lealman, FL
Flood risk 9/10 · Severe
- FEMA flood zone
- AE
- Chance of flooding over 30 yrs
- 0.99%
- Est. flood insurance / yr
- $1,737 – $8,500
Fire risk 1/10 · Minimal
- Est. fire insurance / yr
- $947 – $1,759
Heat risk 10/10 · Severe
- Hot days now (above 107°F)
- 7 days/yr
- Hot days in 30 yrs
- 26 days/yr
Wind risk 10/10 · Severe
- Chance of severe wind over 30 yrs
- 99.0%
Air-quality risk 3/10 · Minor
- Unhealthy air days now
- 2 days/yr
- Unhealthy air days in 30 yrs
- 2 days/yr
Risk factors via First Street. Map © Google.
Why this score? — see what drove the B grade
The composite is a weighted blend of 9 inputs, each scored 0–100. Each bar is that input's sub-score; the figure is the points it added to the 100-point composite (weight × sub-score).
- Cash flow +30.0/30.0
- 1% rule +10.0/10.0
- DSCR +10.0/10.0
- ARV discount +7.5/15.0
- Schools +4.3/10.0
- Livability +4.0/5.0
- Condition / age +3.8/5.0
- Rent growth +2.7/5.0
- Appreciation +0.0/10.0
$100,000
🖨 Deal sheet 📄 Offer letter ✓ Due diligence
Listing remarks
The kitchen shines with stainless steel appliances and plenty of counter and cabinet space, perfect for at-home cooking and entertaining. Large Primary Suite with ample closet space and spacious 2nd Bedroom with lots of room for family or guests. A highlight is the extra space for a home officeor relaxing retreat. The unit includes convenient access to a central laundry room just steps away, and the monthly HOA fee covers an impressive array of utilities and services: internet, gas, water, sewer, trash, cable-tv and more. Paradise Shores is centrally located in Pinellas County, close to the beaches, restaurants, and shopping. This is an ideal year-round residence or a tropical seasonal esca
Key facts
- Convenient access
- Central laundry room
- Built 1981
Tags
Neighborhood map
What this means for you Summary
Snapshot
- This is a 2-bed/1.0-bath other listed at $100k. Condition is rated good.
Deal economics
- At list price, monthly cash flow is $270 ($3k/yr) — positive.
- The deal already cash-flows at list — no discount required.
- Meets the 1% rule at list price ($2k rent vs $100k).
- Recommended offer: $98k (1.5% below list) — sets the bar for market timing.
- Cap rate 14.6% vs local median 1.8% in West Lealman — top-decile yield for the area; either an underpriced asset or a hidden risk that comps aren't pricing in. Stress-test before assuming the spread holds.
Location & tenants
- Location reads 81/100 on livability (#84 in FL, #1,396 nationally) — a professional / high-income tenant draw. Strengths: commute A+, cost of living A+, housing A+; Watch: schools C-, employment D+, amenities F.
- Pinellas (suburban): math 51% / reading 51% proficiency, ranked #31 of 73 in FL (top 42%) — acceptable for families but not a draw, mixed tenant base, ~2y average lease.
- Market conditions: Rents flat; 309 active listings in the ZIP; 36 comparable units currently listed for rent nearby; rentals at typical pace (median 22d on market — plan ~3-4 weeks tenant-placement turnaround); 2,676 units permitted in Pinellas County in 2024 (1,422 in 5+ unit buildings).
- This rent runs 39% of the median local income ($54k/yr) — at the standard rent-burdened threshold; future hikes will face affordability resistance.
Forward outlook
- Local home prices are declining (-3.0%/yr); year-one equity from $691 of loan paydown is wiped out by about $3k of value loss. Plan a longer hold.
- Pinellas County population projected at +14% by 2050 — modest demand growth; plan on rents tracking national, not racing it.
Negotiation context
- It's been on market 23 days — a 2% lower offer ($98k) is reasonable based on typical stale-listing flexibility.
Risks & watch-outs
- Watch-outs: flood insurance adds $427/mo.
- Climate carrying-cost: in FEMA flood zone AE (mandatory federal flood insurance); severe wind risk, 99% chance of damaging wind over 30y; extreme-heat days projected 7→26/yr by 2055 (HVAC capex compounding) — expect insurance premiums to compound above CPI over the hold.
Questions for the listing agent
- What's the actual annual flood-insurance premium (NFIP or private), and is the property in a SFHA with mandatory coverage?
- Is there a deadline driving the sale (1031 exchange, divorce, estate, relocation)? That informs how much negotiation room exists.
- What's the average days-on-market for RENTAL listings here right now (not sales)? A rising rental-DOM trend means longer vacancies and softer asking-rent achievability than the comps imply.
- What's the recent tenant-quality profile in this submarket — average credit score on applications, eviction rate, late-payment / NSF rate, and stable-employment percentage? A property-management company in the area should have these aggregated.
- How much new for-sale + rental construction is in the pipeline within 1–3 miles? Heavy new supply typically softens prices + rents 12–24 months out; constrained supply supports both.
Investment metrics
- 1% rule
- 1.76% ✓
- Cap rate
- 14.65%
- Cash-on-cash
- 29.84%
- DSCR
- 2.33
- GRM
- 4.7
CMA / ARV
No comps found within radius.
Projected returns pro-forma
-3.0% appreciation · 0.99% rent growth · sell at horizon
- IRR
- -2.2%
- Equity multiple
- 0.92×
- Total profit
- $-2,225
- Equity at exit
- $14,910
- IRR
- 4.3%
- Equity multiple
- 1.27×
- Total profit
- $7,625
- Equity at exit
- $8,646
Cash invested: $28,000 (down + closing). Projections, not guarantees.
Landlord ↔ Tenant lean methodology
- Overall (STATE)
- 87 Strongly Landlord-Friendly
- State Florida
- 87 Strongly Landlord-Friendly · R+3
- County
- — inherits STATE
- City
- — inherits STATE
ZIP-level market 33709
- Rents YoY
- 1.0%
- Active inventory
- 309
- Price-to-rent
- 4.7×
Monthly cashflow live
- Estimated rent
- $1,756 high interval (Pro) →
- Mortgage (P&I)
- −$524
- Tax est. 1.5%
- −$125 /mo · $1,500/yr
- Insurance
- −$42
- Flood insurance flood zone
- −$427 /mo · $5,118/yr
- HOA
- −$0
- Vacancy / Maint / Mgmt
- −$369
- Net cashflow
- $270
Break-even live
UW: 25.0% down · 7.5% · 30yr · 1.5% tax · 5.0% vac · 8.0% maint · 8.0% mgmt
Financing live
Cash to close
- Down payment
- $25,000
- Closing costs
- $3,000
- Reserves months
- —
- Total cash needed
- —
Loan-product check · same deal, 3 products live
Conventional
25% down · 7.5% · 30yr
- Down + closing
- —
- Monthly P&I
- —
- Monthly cashflow
- —
- DSCR
- —
- Eligible?
- —
Personal DTI + credit; lowest rate.
DSCR
20% down · 8.5% · 30yr
- Down + closing
- —
- Monthly P&I
- —
- Monthly cashflow
- —
- DSCR
- —
- Eligible?
- —
No personal income docs; deal must DSCR.
Hard money
10% down · 12.0% · 12mo
- Down + closing
- —
- Monthly P&I
- —
- Monthly cashflow
- —
- DSCR
- —
- Eligible?
- —
Short-term bridge; refi at stabilization.
Rent comps 36 comps
| Address | Beds | Baths | Sqft | Rent | $/sqft | DOM | Units | Dist |
|---|---|---|---|---|---|---|---|---|
| 5287 81st St N #26 Saint Petersburg, FL | 2.0 | 2.0 | 1010 | $1,500 | $1.49 | 4d | 1 | 0.07mi |
| 5357 81st St N #14 Saint Petersburg, FL | 2.0 | 2.0 | 1110 | $1,550 | $1.40 | 24d | 1 | 0.07mi |
| 5530 80th St N Unit C204 Saint Petersburg, FL | 1.0 | 1.0 | 880 | $1,450 | $1.65 | 24d | 1 | 0.09mi |
| 5217 81st St N #22 Saint Petersburg, FL | 2.0 | 1.0 | 1010 | $1,700 | $1.68 | 24d | 1 | 0.12mi |
| 5257 81st Ln N #6 Saint Petersburg, FL | 1.0 | 1.0 | 745 | $1,375 | $1.85 | 24d | 1 | 0.13mi |
| 5521 80th St N #312 Saint Petersburg, FL | 1.0 | 1.0 | 1055 | $1,500 | $1.42 | 4d | 1 | 0.14mi |
| 5750 80th St N St Petersburg, FL | 1.0–2.0 | 1.0–1.5 | 987 | $1,800 | $1.82 | 24d | 2 | 0.24mi |
| 5725 80th St N #210 Saint Petersburg, FL | 2.0 | 2.0 | 1125 | $1,900 | $1.69 | 24d | 1 | 0.27mi |
| 8002 48th Ave N Saint Petersburg, FL | 1.0 | 1.0 | 1050 | $2,000 | $1.90 | 3d | 1 | 0.40mi |
| 5980 80th St N #205 St Petersburg, FL | 2.0 | 2.0 | 1100 | $1,950 | $1.77 | 4d | 1 | 0.40mi |
| 4653 78th Ln N St Petersburg, FL | 3.0 | 2.0 | 1312 | $2,695 | $2.05 | 24d | 1 | 0.51mi |
| 7249 Parkside Villas Dr N Saint Petersburg, FL | 2.0 | 2.0 | 956 | $1,950 | $2.04 | 24d | 1 | 0.74mi |
| 7238 55th Ave N Saint Petersburg, FL | 2.0 | 2.0 | 1085 | $1,899 | $1.75 | 18d | 1 | 0.76mi |
| 4930 72nd St N Saint Petersburg, FL | 2.0 | 1.0 | 1352 | $1,950 | $1.44 | 4d | 1 | 0.79mi |
| 7140 55th Ave N Saint Petersburg, FL | 3.0 | 2.0 | 1085 | $2,000 | $1.84 | 22d | 1 | 0.85mi |
| 4801 71st St N St Petersburg, FL | 2.0 | 1.0 | 726 | $1,900 | $2.62 | 18d | 1 | 0.96mi |
| 4801 71st St N Saint Petersburg, FL | 2.0 | 1.0 | 726 | $1,900 | $2.62 | 4d | 1 | 0.96mi |
| 5410 70th Way N Saint Petersburg, FL | 3.0 | 1.0 | 1160 | $2,100 | $1.81 | 4d | 1 | 0.96mi |
| 5410 70th Way N Saint Petersburg, FL | 3.0 | 1.0 | 1354 | $2,100 | $1.55 | 3d | 1 | 0.96mi |
| 6468 Bonnie Bay Cir N Pinellas Park, FL | 2.0 | 2.0 | 970 | $1,800 | $1.86 | 14d | 1 | 0.99mi |
| 6366 71st St N Pinellas Park, FL | 2.0 | 2.0 | 970 | $2,200 | $2.27 | 24d | 1 | 1.03mi |
| 9071 47th Ave N St. Petersburg, FL | 2.0 | 2.0 | 1100 | $2,000 | $1.82 | 24d | 1 | 1.05mi |
| 6398 Woodland Blvd Unit 1366035P Pinellas Park, FL | 3.0 | 2.0 | 1367 | $5,922 | $4.33 | 16d | 1 | 1.10mi |
| 4711 Sunnydale Ln N Unit A St. Petersburg, FL | 2.0 | 1.0 | 800 | $1,750 | $2.19 | 24d | 1 | 1.10mi |
| 5136 68th St N Unit C St. Petersburg, FL | 2.0 | 1.0 | 957 | $1,700 | $1.78 | 4d | 1 | 1.12mi |
| 5136 68th St N Unit B St. Petersburg, FL | 3.0 | 1.0 | 1302 | $1,900 | $1.46 | 4d | 1 | 1.12mi |
| 3855 39th Ave N St Petersburg, FL | 2.0 | 2.5 | 1100 | $1,850 | $1.68 | 22d | 1 | 1.12mi |
| 3501 Boca Ciega Dr N Saint Petersburg, FL | 2.0 | 2.0 | 1144 | $3,400 | $2.97 | 4d | 1 | 1.18mi |
| 4701 68th St N Saint Petersburg, FL | 1.0 | 1.0 | 700 | $1,099 | $1.57 | 24d | 1 | 1.21mi |
| 3451 79th St N Saint Petersburg, FL | 2.0 | 2.0 | 1150 | $2,500 | $2.17 | 24d | 1 | 1.23mi |
| 4390 68th St N Saint Petersburg, FL | 3.0 | 1.0 | 864 | $1,950 | $2.26 | 24d | 1 | 1.24mi |
| 6205 Shoreline Dr #1305 Saint Petersburg, FL | 2.0 | 2.0 | 1205 | $2,100 | $1.74 | 4d | 1 | 1.42mi |
| 8950 Park Blvd Seminole, FL | 2.0 | 2.0 | 1165 | $1,698 | $1.46 | 24d | 3 | 1.44mi |
| 8950 Park Blvd Seminole, FL | 2.0 | 2.0 | 1160 | $1,748 | $1.51 | 24d | 2 | 1.44mi |
| 6522 54th Ave N Saint Petersburg, FL | 1.0–3.0 | 1.0–2.0 | 892 | $1,600 | $1.79 | 2d | 10 | 1.47mi |
| 6524 54th Ave N Unit 2 St. Petersburg, FL | 2.0 | 1.0 | 840 | $1,360 | $1.62 | 24d | 1 | 1.48mi |
Listing history 13 events
-
2026-06-18days on market $100,000 Active 23 DOM
-
2026-06-17days on market $100,000 Active 22 DOM
-
2026-06-16days on market $100,000 Active 21 DOM
-
2026-06-15days on market $100,000 Active 20 DOM
-
2026-06-13days on market $100,000 Active 18 DOM
-
2026-06-09days on market $100,000 Active 14 DOM
-
2026-06-08days on market $100,000 Active 13 DOM
-
2026-06-07days on market $100,000 Active 12 DOM
-
2026-06-04days on market $100,000 Active 9 DOM
-
2026-06-03days on market $100,000 Active 8 DOM
-
2026-06-01days on market $100,000 Active 6 DOM
-
2026-05-31days on market $100,000 Active 5 DOM
-
2026-05-26$100,000 Active
ⓘ Source: listings_history table (triggers on properties + properties_extension) + one-shot
backfill from property_details.listing_events for pre-trigger history.
Climate risk First Street
- Flood 9/10 Extreme FEMA zone AE · 99% chance over 30 yrs
- Wildfire 1/10 Low
- Heat 10/10 Extreme 7 d/yr ≥107°F today · 26 d/yr by 30 yrs out
- Wind 10/10 Extreme 99% chance of damaging wind over 30 yrs
- Air quality 3/10 Moderate 2 unhealthy d/yr today · 2 by 30 yrs out
Nearby sold comps map
Loading sold comps map…
Walkable amenities ~0.75 mi
Loading nearby amenities…
Taxation est. · year 1
- Rental income
- $21,072
- − Mortgage interest
- −$5,602
- − Property taxes
- −$1,500
- − Insurance
- −$5,618
- − Repairs & maintenance
- −$1,686
- − Management
- −$1,686
- − Depreciation
- −$2,909
- Taxable income
- $2,071
- Est. tax owed @ 24.0%
- −$497
- After-tax cash flow
- $2,738/yr
For passive investors: Depreciation is non-cash, so a rental often shows a tax loss while cash-flowing — sheltering income. Rental losses are passive: they offset passive income freely, and up to $25,000/yr can offset ordinary (W-2) income if you actively participate and your MAGI is under $100k (phasing out to $0 by $150k); unused losses carry forward. On sale, claimed depreciation is recaptured at up to 25%, and gains may owe capital-gains tax (a 1031 exchange can defer both). Figures are a year-1 estimate at your 24.0% rate — not tax advice; consult a CPA.
Condition & rehab AI · 1 photo
This property is in good condition with a well-maintained pool and ample space for a home office or relaxing retreat. It is an ideal year-round residence or a tropical seasonal escape.
Value-add opportunities
- Both Landscaping improvements — Enhances curb appeal and adds value for both resale and rental.
- Both Painting exterior and interior — Fresh paint can make the home look more appealing and increase its value.
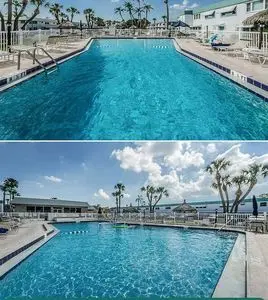
- Both Pool maintenance and cleaning — A clean and well-maintained pool can attract more potential buyers or renters and add to the home's value.
Renovation cost estimate screening
Value-add ROI direction
- Both Landscaping improvements — Enhances curb appeal and adds value for both resale and rental. ↑
- Both Painting exterior and interior — Fresh paint can make the home look more appealing and increase its value. ↑
- Both Pool maintenance and cleaning — A clean and well-maintained pool can attract more potential buyers or renters and add to the home's value. ↑
ⓘ Cost ranges are severity-bucket heuristics (US national rule-of-thumb). Get contractor quotes + a written scope before underwriting a rehab budget.
Schools (NCES district)
- District
- Pinellas
- NCES district ID
- 1201560
- Math proficiency
- 51% ▼ -5.00%
- Reading proficiency
- 51% ▼ -3.00%
- Median HH income
- $46,270
- Composite
- 43.27/100
- National rank
- #3046
- State rank
- #31 of 73 in FL
Livability — West Lealman
- Score
- 81/100
- State rank
- #84
- US rank
- #1396
Category grades
Schools grade is shown separately in the Schools card above.
Census & demographics
- Census place
- West Lealman, FL
- County
- Pinellas County · 939,478 people
- City population
- 25,371
- Metro
- Tampa-St. Petersburg-Clearwater, FL
- Population (ZIP)
- 25,050
- Household income
- $53,501
- Rent vs Own
- Severe rent burden
- 712.0
Population outlook (Pinellas County) Hauer SSP2
- Today (2025)
- 1,027,532 people
- By 2030
- 1,063,586 · +3.5%
- By 2040
- 1,125,020 · +9.5%
- By 2050
- 1,168,637 · +13.7%
- By 2075
- 1,265,188 · +23.1%
- By 2100
- 1,260,357 · +22.7%
Race, ethnicity, and origin ACS 2023
- Neighborhood character
- Predominantly White (73%)
- Race & ethnicity
- White 73% Hispanic / Latino 11% Two or more races 10% Black 5% Asian 5%
- Hispanic origin (detail)
- Mexican 2% Puerto Rican 3% Cuban 2% Dominican 1%
- Common ancestry
- Lithuanian 3% Romanian 3% Slovak 2%
- Foreign-born
- 14% · Canada, Vietnam, Jamaica
- Languages at home
- 84% English-only · Spanish 9% Other Indo-European 2% Vietnamese 2%
Political lean MEDSL · Pinellas
- 2024 margin
- Lean R (+5.2) · D 46.9% · R 52.1%
- 2008→2024 swing
- -13.5pp toward R · 2008: 8.3pp · 2024: -5.2pp
- All cycles
- 2024: R+5.2 2020: D+0.2 2016: R+1.1 2012: D+5.6 2008: D+8.3
Not yet ingested
- Civics
- —
Market trends
- HPI YoY
- ▼ -416.74%
- Current HPI
- 391.368
- Rent YoY
- ▲ 0.99%
- Metro
- Tampa-St. Petersburg-Clearwater, FL
- State GDP YoY
- ▲ 3.28%
- F500 in state
- 36
Industry mix (Fortune 500 HQ in FL)
| Industry | F500 HQs | Revenue |
|---|---|---|
| Industrial Technology | 2 | $29B |
|
||
| Insurance | 2 | $17B |
|
||
| Retail | 1 | $60B |
|
||
| Technology Distribution | 1 | $58B |
|
||
| Homebuilding | 1 | $35B |
|
||
| Technology Manufacturing | 1 | $35B |
|
||
Price history
1 event — show timeline
- 2026-05-26 Listed $100,000 FSBO.com
Cash-flow waterfall
monthlySold comps — $/sqft
last 12 mo · ≤1 miLoading sold comps…