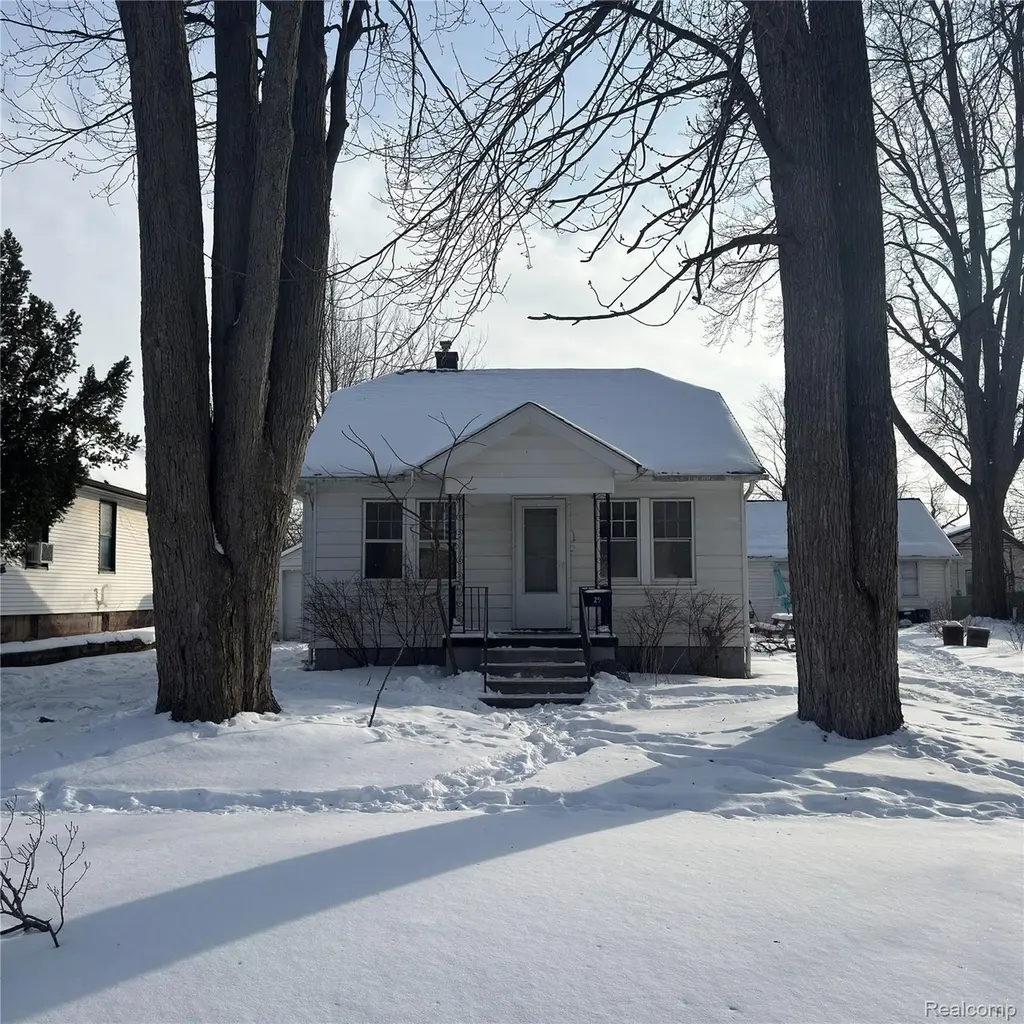
29 W New York Ave · Pontiac, MI
Flood risk 1/10 · Minimal
- FEMA flood zone
- X (unshaded)
- Chance of flooding over 30 yrs
- 0.0%
- Est. flood insurance / yr
- $473 – $860
Fire risk 1/10 · Minimal
- Est. fire insurance / yr
- $784 – $1,456
Heat risk 2/10 · Minimal
- Hot days now (above 96°F)
- 7 days/yr
- Hot days in 30 yrs
- 15 days/yr
Wind risk 2/10 · Minimal
- Chance of severe wind over 30 yrs
- —
Air-quality risk 3/10 · Minor
- Unhealthy air days now
- 2 days/yr
- Unhealthy air days in 30 yrs
- 4 days/yr
Risk factors via First Street. Map © Google.
Why this score? — see what drove the C- grade
The composite is a weighted blend of 9 inputs, each scored 0–100. Each bar is that input's sub-score; the figure is the points it added to the 100-point composite (weight × sub-score).
- Cash flow +20.2/30.0
- ARV discount +8.6/15.0
- DSCR +6.4/10.0
- 1% rule +4.6/10.0
- Rent growth +3.7/5.0
- Livability +3.2/5.0
- Condition / age +2.5/5.0
- Schools +1.0/10.0
- Appreciation +0.0/10.0
$127,000
🖨 Deal sheet (PDF) 📄 Offer letter ✓ Due diligence
Listing remarks MLS
CHARMING BUNGALOW LOCATED IN NORTHERN'S FINEST AREA. 2 BR BSMT AND GARAGE PLUS KNOTTY PINE. FAMILY RM OR ADDITIONAL BEDROOM. DESIGNER * * * * * * * * THRU-OUT & EASY SHOWING WITH IMMED OCCUPANCY.
Key facts
- Designer thru-out
- Additional bedroom
- Immed occupancy
Tags
Property features AI
Finance
- Other: Lot dimensions approximately 40 x 130 (0.12 acre); Subdivision: MARIMONT; Cross street: Baldwin
Exterior
- Parking: Detached 1-car garage
- Utilities: Public sewer; Other water source
- Home design: Single-family residence; One story; Ground-level entry with steps; Vinyl siding construction
- Construction: Asphalt roof; Home warranty included
- Exterior features: Front porch; Paved road access
Interior
- Bathrooms: 1 full bathroom
- Heating & cooling: Forced air heating (natural gas); No cooling
- Interior features: Crawl space basement; 6 total rooms
Neighborhood map
What this means for you Summary
Snapshot
- This is a 2-bed/1.0-bath single-family listed at $127k.
Deal economics
- At list price, monthly cash flow is $161 ($2k/yr) — positive.
- The deal already cash-flows at list — no discount required.
- To meet the 1% rule (rent ≥ 1% of price), the offer needs to be $121k (4.4% below list).
- Recommended offer: $121k (4.4% below list) — sets the bar for 1% rule.
Location & tenants
- Location reads 64/100 on livability (#499 in MI) — a middle-class / working-renter tenant base. Strengths: commute A+, cost of living A+, housing A+; Watch: health & safety D, schools F, crime F.
- Pontiac City School District (urban): math 8% / reading 17% proficiency, ranked #514 of 540 in MI (top 95%) — low school quality limits family demand, transient renter base, plan for 1-2y turnover; 81% free/reduced lunch — lower-income household profile, screen leases tightly.
- Market conditions: Rents rising fast (+4.7%/yr); 83 active listings in the ZIP; 9 comparable units currently listed for rent nearby; rentals lingering (median 45d on market — plan ~5-8 weeks vacancy on turnover, expect pricing pressure); 56% of comp listings sitting > 30 days — soft ceiling on asking rent; 2,614 units permitted in Oakland County in 2024 (721 in 5+ unit buildings).
- This rent runs 30% of the median local income ($48k/yr) — at the standard rent-burdened threshold; future hikes will face affordability resistance.
Forward outlook
- Local home prices are declining (-3.0%/yr); year-one equity from $878 of loan paydown is wiped out by about $4k of value loss. Plan a longer hold.
- Oakland County population projected at +10% by 2050 — modest demand growth; plan on rents tracking national, not racing it.
Negotiation context
- It's been on market 23 days — a 2% lower offer ($125k) is reasonable based on typical stale-listing flexibility.
- 6 sale attempts since 22y ago with the ask held roughly flat each time — persistent listings suggest the price (not the market) is what's stuck; bring a comps-based counter.
- Current owner paid $10k; list at $127k implies a 1170% gain — meaningful room to come down on a strong offer.
Risks & watch-outs
- Watch-outs: built in 1930 — expect roof / HVAC / electrical / plumbing capex.
Questions for the listing agent
- Built in 1930 — when were the roof, HVAC, electrical panel, plumbing, and water heater last replaced?
- Is there a deadline driving the sale (1031 exchange, divorce, estate, relocation)? That informs how much negotiation room exists.
- Schools are F-rated, which usually means shorter tenancies and higher turnover. Who's the typical renter profile here, and what's been the actual vacancy rate?
- Crime grade is F in this area — have there been break-ins, vandalism, or insurance claims at this property in the last 3 years? What carrier currently insures it and at what premium?
- What's the average days-on-market for RENTAL listings here right now (not sales)? A rising rental-DOM trend means longer vacancies and softer asking-rent achievability than the comps imply.
- What's the recent tenant-quality profile in this submarket — average credit score on applications, eviction rate, late-payment / NSF rate, and stable-employment percentage? A property-management company in the area should have these aggregated.
- How much new for-sale + rental construction is in the pipeline within 1–3 miles? Heavy new supply typically softens prices + rents 12–24 months out; constrained supply supports both.
Investment metrics
- 1% rule
- 0.96% ✗
- Cap rate
- 7.82%
- Cash-on-cash
- 5.44%
- DSCR
- 1.24
- GRM
- 8.7
CMA / ARV
- ARV (median comp)
- $130,272
- List price
- $127,000
- Delta
- -0.29%
- Verdict
- FAIR
- Comps
- 20 within 1.0 mi
Show comp detail 12 sales within ~0.75 mi
| Address | Dist | Beds/Ba | Sqft | Sold | Price | $/sf | Match |
|---|---|---|---|---|---|---|---|
| 64 W Colgate Ave | 0.07mi | 2/1.0 | 804 (+1%) | 3mo | $55,000 | $68 | 92 |
| 8304 Arlis St | 0.01mi | 3/1.0 (+1) | 840 (+6%) | 3mo | $183,900 | $219 | 83 |
| 74 E Colgate Ave | 0.20mi | 2/1.0 | 753 (-5%) | 1mo | $105,000 | $139 | 81 |
| 104 W Brooklyn Ave | 0.21mi | 3/1.0 (+1) | 762 (-4%) | 7mo | $100,000 | $131 | 72 |
| 18 E Hopkins Ave | 0.37mi | 3/1.0 (+1) | 815 (+2%) | 6mo | $115,000 | $141 | 68 |
| 228 W Columbia Ave | 0.66mi | 2/1.0 | 800 (+1%) | 1mo | $85,000 | $106 | 67 |
| 205 W Sheffield Ave | 0.40mi | 2/1.0 | 733 (-8%) | 9mo | $85,000 | $116 | 61 |
| 224 W Princeton Ave | 0.45mi | 2/1.0 | 874 (+10%) | 2mo | $75,000 | $86 | 60 |
| 240 W Longfellow Ave | 0.73mi | 2/1.0 | 812 (+2%) | 8mo | $150,000 | $185 | 56 |
| 200 W Chicago Ave | 0.33mi | 3/1.0 (+1) | 880 (+11%) | 8mo | $140,000 | $159 | 55 |
| 192 W Hopkins Ave | 0.44mi | 2/1.0 | 900 (+13%) | 10mo | $180,000 | $200 | 49 |
| 184 W Strathmore Ave | 0.73mi | 2/1.0 | 888 (+12%) | 3mo | $105,000 | $118 | 44 |
Match score weights: distance 35% · size 25% · config 20% · recency 20%. Top-matched comps best support the ARV.
Projected returns pro-forma
-3.0% appreciation · 4.73% rent growth · sell at horizon
- IRR
- -6.1%
- Equity multiple
- 0.77×
- Total profit
- $-8,191
- Equity at exit
- $18,936
- IRR
- 5.4%
- Equity multiple
- 1.42×
- Total profit
- $15,107
- Equity at exit
- $10,981
Cash invested: $35,560 (down + closing). Projections, not guarantees.
Landlord ↔ Tenant lean methodology
- Overall (STATE)
- 62 Landlord-Friendly
- State Michigan
- 62 Landlord-Friendly · EVEN
- County
- — inherits STATE
- City
- — inherits STATE
ZIP-level market 48340
- Rents YoY
- 4.7%
- Active inventory
- 83
- Price-to-rent
- 8.7×
Monthly cashflow live
- Estimated rent
- $1,215 high interval (Pro) →
- Mortgage (P&I)
- −$666
- Tax from tax record
- −$79 /mo · $953/yr
- Insurance
- −$53
- HOA
- −$0
- Vacancy / Maint / Mgmt
- −$255
- Net cashflow
- $161
Break-even live
Sensitivity live
| Price | -10% $233 | -5% $197 | +0% $161 | +5% $125 | +10% $89 |
|---|---|---|---|---|---|
| Rent | -10% $65 | -5% $113 | +0% $161 | +5% $209 | +10% $257 |
| Rate | -1.0pp $225 | -0.5pp $194 | base $161 | +0.5pp $128 | +1.0pp $95 |
UW: 25.0% down · 7.5% · 30yr · 1.5% tax · 5.0% vac · 8.0% maint · 8.0% mgmt
Financing live
Cash to close
- Down payment
- $31,750
- Closing costs
- $3,810
- Reserves months
- —
- Total cash needed
- —
Loan-product check · same deal, 3 products live
Conventional
25% down · 7.5% · 30yr
- Down + closing
- —
- Monthly P&I
- —
- Monthly cashflow
- —
- DSCR
- —
- Eligible?
- —
Personal DTI + credit; lowest rate.
DSCR
20% down · 8.5% · 30yr
- Down + closing
- —
- Monthly P&I
- —
- Monthly cashflow
- —
- DSCR
- —
- Eligible?
- —
No personal income docs; deal must DSCR.
Hard money
10% down · 12.0% · 12mo
- Down + closing
- —
- Monthly P&I
- —
- Monthly cashflow
- —
- DSCR
- —
- Eligible?
- —
Short-term bridge; refi at stabilization.
Rent comps 9 comps
| Address | Beds | Baths | Sqft | Rent | $/sqft | DOM | Units | Dist |
|---|---|---|---|---|---|---|---|---|
| 136 W Princeton Ave Pontiac, MI | 3.0 | 1.0 | 1050 | $1,395 | $1.33 | 20d | 1 | 0.36mi |
| 370 W Hopkins Ave Pontiac, MI | 1.0–2.0 | 1.0 | 700 | $1,100 | $1.57 | 44d | 39 | 0.73mi |
| 126 W Cornell Ave Pontiac, MI | 3.0 | 1.0 | 891 | $1,125 | $1.26 | 22d | 1 | 0.92mi |
| 126 W Cornell Ave Pontiac, MI | 3.0 | 1.0 | 891 | $1,325 | $1.49 | 44d | 1 | 0.92mi |
| 85 E Beverly Ave Pontiac, MI | 3.0 | 1.0 | 1000 | $1,250 | $1.25 | 5d | 1 | 1.00mi |
| 191 W Kennett Rd Unit 304 Pontiac, MI | 2.0 | 1.0 | 850 | $875 | $1.03 | 44d | 1 | 1.13mi |
| 195 W Kennett Rd Unit 202 Pontiac, MI | 2.0 | 1.0 | 950 | $875 | $0.92 | 44d | 1 | 1.14mi |
| 76 N Merrimac St Pontiac, MI | 2.0 | 1.0 | 633 | $1,450 | $2.29 | 44d | 1 | 1.31mi |
| 105 S Merrimac St Pontiac, MI | 2.0 | 1.0 | 625 | $825 | $1.32 | 22d | 1 | 1.37mi |
Listing history 27 events
-
2026-06-18days on market $127,000 Active 23 DOM
-
2026-06-17days on market $127,000 Active 22 DOM
-
2026-06-16days on market $127,000 Active 21 DOM
-
2026-06-15days on market $127,000 Active 20 DOM
-
2026-06-13days on market $127,000 Active 18 DOM
-
2026-06-13days on market $127,000 Active 17 DOM
-
2026-06-09days on market $127,000 Active 14 DOM
-
2026-06-08days on market $127,000 Active 13 DOM
-
2026-06-07days on market $127,000 Active 12 DOM
-
2026-06-04days on market $127,000 Active 9 DOM
-
2026-06-03days on market $127,000 Active 8 DOM
-
2026-06-02days on market $127,000 Active 7 DOM
-
2026-06-02$127,000 Active 6 DOM
-
2026-06-01days on market $127,000 Active 6 DOM
-
2026-05-31days on market $127,000 Active 5 DOM
-
2026-04-13price $129,900 210-char remark
-
2026-04-13price $129,900 210-char remark
-
2026-03-07price $134,900 210-char remark
-
2026-03-06price $134,900 210-char remark
-
2026-02-24price $139,900 210-char remark
-
2026-02-23price $139,900 210-char remark
-
2026-02-23$135,000 Active 210-char remark
-
2026-02-23$135,000 Active 210-char remark
-
2005-01-27historical
-
2004-12-10$94,900
-
2001-06-27soldstatus $10,000
-
1999-08-31soldstatus $10,000
ⓘ Source: listings_history table (triggers on properties + properties_extension) + one-shot
backfill from property_details.listing_events for pre-trigger history.
Tax reassessment forecast MI · Partial reset (capped growth)
- Current annual tax
- $953 · $79/mo
- Projected year-2 tax
- $1,454 · $121/mo
- Expected delta
- +$502/yr (+$42/mo · 52.6%)
ⓘ Screening estimate from a state-policy table — verify with the county assessor before closing.
Climate risk First Street
- Flood 1/10 Low FEMA zone X (unshaded) · 0% chance over 30 yrs
- Wildfire 1/10 Low
- Heat 2/10 Low 7 d/yr ≥96°F today · 15 d/yr by 30 yrs out
- Wind 2/10 Low
- Air quality 3/10 Moderate 2 unhealthy d/yr today · 4 by 30 yrs out
Nearby sold comps map
Loading sold comps map…
Walkable amenities ~0.75 mi
Loading nearby amenities…
Taxation est. · year 1
- Rental income
- $14,575
- − Mortgage interest
- −$7,114
- − Property taxes
- −$953
- − Insurance
- −$635
- − Repairs & maintenance
- −$1,166
- − Management
- −$1,166
- − Depreciation
- −$3,695
- Taxable loss
- −$153
- Est. tax savings @ 24.0%
- +$37
- After-tax cash flow
- $1,971/yr
For passive investors: Depreciation is non-cash, so a rental often shows a tax loss while cash-flowing — sheltering income. Rental losses are passive: they offset passive income freely, and up to $25,000/yr can offset ordinary (W-2) income if you actively participate and your MAGI is under $100k (phasing out to $0 by $150k); unused losses carry forward. On sale, claimed depreciation is recaptured at up to 25%, and gains may owe capital-gains tax (a 1031 exchange can defer both). Figures are a year-1 estimate at your 24.0% rate — not tax advice; consult a CPA.
Schools (NCES district)
- District
- Pontiac City School District
- NCES district ID
- 2628740
- Math proficiency
- 8% ▼ -5.00%
- Reading proficiency
- 17% ▼ -3.00%
- Median HH income
- $33,888
- Composite
- 10.12/100
- National rank
- #9802
- State rank
- #514 of 540 in MI
Livability — Pontiac
- Score
- 64/100
- State rank
- #499
- US rank
- #14703
Category grades
Schools grade is shown separately in the Schools card above.
Census & demographics
- Census place
- Pontiac, MI
- County
- Oakland County · 1,009,092 people
- City population
- 44,593
- Metro
- Detroit-Warren-Dearborn, MI
- Population (ZIP)
- 25,669
- Household income
- $47,891
- Rent vs Own
- Severe rent burden
- 1460.0
Population outlook (Oakland County) Hauer SSP2
- Today (2025)
- 1,335,747 people
- By 2030
- 1,375,100 · +2.9%
- By 2040
- 1,435,385 · +7.5%
- By 2050
- 1,469,250 · +10.0%
- By 2075
- 1,531,946 · +14.7%
- By 2100
- 1,450,485 · +8.6%
Race, ethnicity, and origin ACS 2023
- Neighborhood character
- Highly diverse neighborhood (Simpson 0.73)
- Race & ethnicity
- Black 31% Hispanic / Latino 31% White 29% Two or more races 22% Asian 4%
- Hispanic origin (detail)
- Mexican 18% Puerto Rican 7%
- Common ancestry
- Lithuanian 2% Romanian 2% Serbian 1%
- Foreign-born
- 11% · Canada, China
- Languages at home
- 74% English-only · Spanish 23% Other Asian/Pacific 2% Chinese 1%
Political lean MEDSL · Oakland
- 2024 margin
- D (+10.6) · D 54.4% · R 43.8% · Other 1.9%
- 2008→2024 swing
- -3.9pp toward R · 2008: 14.5pp · 2024: 10.6pp
- All cycles
- 2024: D+10.6 2020: D+14.1 2016: D+8.1 2012: D+8.1 2008: D+14.5
Not yet ingested
- Civics
- —
Market trends
- HPI YoY
- ▼ -295.80%
- Current HPI
- 177.961
- Rent YoY
- ▲ 4.73%
- Metro
- Detroit-Warren-Dearborn, MI
- State GDP YoY
- ▲ 1.37%
- F500 in state
- 28
Industry mix (Fortune 500 HQ in MI)
| Industry | F500 HQs | Revenue |
|---|---|---|
| Automotive Parts | 3 | $48B |
|
||
| Automotive | 2 | $372B |
|
||
| Chemicals | 1 | $45B |
|
||
| Automotive Retail | 1 | $29B |
|
||
| Healthcare / Medical Devices | 1 | $23B |
|
||
| Automotive Technology | 1 | $20B |
|
||
Price history
+1170.0% since first listed18 events — show timeline
- 2026-06-02 Relisted — REALCOMP
- 2026-06-01 Listing Removed — REALCOMP
- 2026-05-26 Listed $127,000 REALCOMP
- 2026-05-26 Listed $127,000 MiRealSource-MiMLS
- 2026-05-24 Listing Removed — REALCOMP
- 2026-05-24 Listing Removed — MiRealSource-MiMLS
- 2026-04-13 Price Changed $129,900 MiRealSource-MiMLS
- 2026-04-13 Price Changed $129,900 REALCOMP
- 2026-03-07 Price Changed $134,900 MiRealSource-MiMLS
- 2026-03-06 Price Changed $134,900 REALCOMP
- 2026-02-24 Price Changed $139,900 MiRealSource-MiMLS
- 2026-02-23 Price Changed $139,900 REALCOMP
- 2026-02-23 Listed $135,000 REALCOMP
- 2026-02-23 Listed $135,000 MiRealSource-MiMLS
- 2005-01-27 Listing Removed — REALCOMP
- 2004-12-10 Listed $94,900 REALCOMP
- 2001-06-27 Sold (Public Records) $10,000 Public Records
- 1999-08-31 Sold (Public Records) $10,000 Public Records
Property tax history
+1.9%/yrLatest (2025): $953 · +2.7% YoY. Source: county tax records.
Cash-flow waterfall
monthlySold comps — $/sqft
last 12 mo · ≤1 miLoading sold comps…