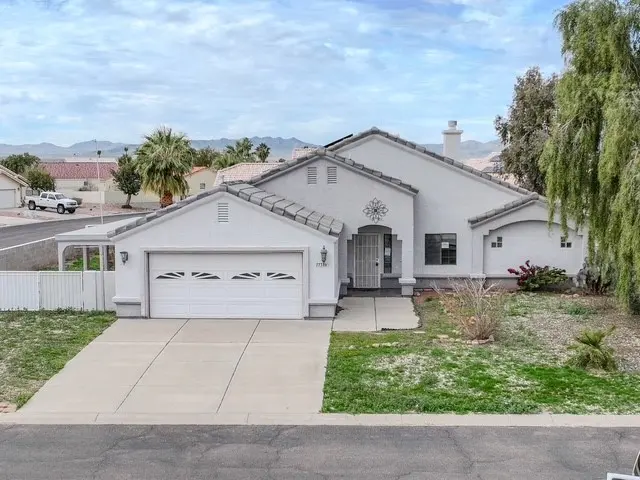
7733 S Valley Parkway Ct · Mohave Valley, AZ
Flood risk No data
- FEMA flood zone
- —
- Chance of flooding over 30 yrs
- —
- Est. flood insurance / yr
- —
Fire risk No data
- Est. fire insurance / yr
- —
Heat risk No data
- Hot days now (above threshold)
- —
- Hot days in 30 yrs
- —
Wind risk No data
- Chance of severe wind over 30 yrs
- —
Air-quality risk No data
- Unhealthy air days now
- —
- Unhealthy air days in 30 yrs
- —
Risk factors via First Street. Map © Google.
Why this score? — see what drove the B+ grade
The composite is a weighted blend of 9 inputs, each scored 0–100. Each bar is that input's sub-score; the figure is the points it added to the 100-point composite (weight × sub-score).
- Cash flow +30.0/30.0
- 1% rule +10.0/10.0
- DSCR +10.0/10.0
- Appreciation +10.0/10.0
- ARV discount +7.5/15.0
- Livability +3.2/5.0
- Rent growth +2.5/5.0
- Condition / age +2.5/5.0
- Schools +1.3/10.0
$85,000
🖨 Deal sheet (PDF) 📄 Offer letter ✓ Due diligence
Listing remarks
Come and check out this great Corner lot on a Cul de sac home! The living room is a striking space, defined by its high ceiling and vaulted ceiling, creating an airy and expansive atmosphere, while a fireplace adds a touch of cozy sophistication, complemented by thoughtfully designed built-in shelves throughout. The kitchen is equipped with shaker cabinets and a practical kitchen peninsula, along with a kitchen bar that provides a casual dining spot or a place to gather. The bathroom provides a tiled walk-in shower and a double vanity, offering a private space with practical features. This residence includes 3 bedrooms and 2 bathrooms, and a den providing comfortable accommodation. The prop
Key facts
- High ceiling
- Cul de sac
- Vaulted ceiling
Tags
Neighborhood map
What this means for you Summary
Snapshot
- This is a 3-bed/2.0-bath single-family listed at $85k.
Deal economics
- At list price, monthly cash flow is $792 ($9k/yr) — positive.
- The deal already cash-flows at list — no discount required.
- Meets the 1% rule at list price ($2k rent vs $85k).
- Cap rate 17.5% vs local median 3.8% in Mohave Valley — top-decile yield for the area; either an underpriced asset or a hidden risk that comps aren't pricing in. Stress-test before assuming the spread holds.
Location & tenants
- Location reads 65/100 on livability (#83 in AZ) — a middle-class / working-renter tenant base. Strengths: cost of living A+, housing A+, crime A; Watch: employment C-, health & safety C-, schools F.
- Colorado River Union High School District (4381) (town): math 13% / reading 17% proficiency, ranked #213 of 249 in AZ (top 86%) — low school quality limits family demand, transient renter base, plan for 1-2y turnover.
- Market conditions: 217 active listings in the ZIP; 2 comparable units currently listed for rent nearby; 2,543 units permitted in Mohave County in 2024 (33 in 5+ unit buildings).
Forward outlook
- In year one you build about $9k of equity ($588 loan paydown + $8k appreciation (10.0% local appreciation)).
- Mohave County population projected to shrink 6% by 2050 — rents likely to lag national; underwrite the cash flow, not the appreciation.
- At projected returns (10.0% appreciation + 3.0% rent growth), your $24k cash investment doubles in ~2 years — after that, you're playing with house money.
- By year 4, paydown + projected appreciation supports a ~$32k cash-out refi (75% LTV) — recoverable capital for the next deal without selling this one.
Negotiation context
- Only 6 days on market — expect competitive offers; lowballing is unlikely to land.
- 10 sale attempts since 9y ago; this cycle's ask has dropped $190k (69%) from the opening price — seller is motivated, your offer sets the floor, not the list.
Questions for the listing agent
- What does the HOA fee cover, when was the last increase, and are there any pending special assessments or reserve-fund shortfalls?
- Is there a deadline driving the sale (1031 exchange, divorce, estate, relocation)? That informs how much negotiation room exists.
- Schools are F-rated, which usually means shorter tenancies and higher turnover. Who's the typical renter profile here, and what's been the actual vacancy rate?
- What's the average days-on-market for RENTAL listings here right now (not sales)? A rising rental-DOM trend means longer vacancies and softer asking-rent achievability than the comps imply.
- What's the recent tenant-quality profile in this submarket — average credit score on applications, eviction rate, late-payment / NSF rate, and stable-employment percentage? A property-management company in the area should have these aggregated.
- How much new for-sale + rental construction is in the pipeline within 1–3 miles? Heavy new supply typically softens prices + rents 12–24 months out; constrained supply supports both.
Investment metrics
- 1% rule
- 2.14% ✓
- Cap rate
- 17.47%
- Cash-on-cash
- 39.91%
- DSCR
- 2.78
- GRM
- 3.9
CMA / ARV
- ARV (on-the-fly)
- $311,144
- Comps found
- 12
Show comp detail 12 sales within ~0.75 mi
| Address | Dist | Beds/Ba | Sqft | Sold | Price | $/sf | Match |
|---|---|---|---|---|---|---|---|
| 1660 E Winter Haven Dr | 0.20mi | 3/2.0 | 1,729 (+2%) | 1mo | $260,000 | $150 | 86 |
| 1723 E Winter Haven Dr | 0.12mi | 3/2.0 | 1,656 (-2%) | 9mo | $309,990 | $187 | 84 |
| 7713 S Winter Haven Cir | 0.12mi | 3/2.0 | 1,772 (+5%) | 4mo | $325,000 | $183 | 83 |
| 1763 E Desert Bloom Dr | 0.06mi | 3/2.0 | 1,659 (-2%) | 13mo | $376,000 | $227 | 83 |
| 1717 E Valley Pkwy | 0.08mi | 3/2.0 | 1,656 (-2%) | 13mo | $304,990 | $184 | 82 |
| 1836 E Spring Way | 0.16mi | 3/2.0 | 1,656 (-2%) | 11mo | $299,990 | $181 | 80 |
| 1827 E Desert Bloom Dr | 0.14mi | 3/2.0 | 1,656 (-2%) | 13mo | $304,990 | $184 | 79 |
| 1835 E Spring Way | 0.15mi | 3/2.0 | 1,656 (-2%) | 13mo | $304,990 | $184 | 78 |
| 1864 E Desert Bloom Dr | 0.22mi | 3/2.0 | 1,636 (-3%) | 14mo | $455,000 | $278 | 73 |
| 7730 S Winter Haven Way | 0.18mi | 3/2.0 | 1,808 (+7%) | 9mo | $319,990 | $177 | 73 |
| 1824 E Spring Way | 0.13mi | 3/2.0 | 1,808 (+7%) | 14mo | $316,123 | $175 | 71 |
| 1833 E Desert Bloom Dr | 0.15mi | 3/2.0 | 1,808 (+7%) | 13mo | $314,990 | $174 | 70 |
Match score weights: distance 35% · size 25% · config 20% · recency 20%. Top-matched comps best support the ARV.
Projected returns pro-forma
10.0% appreciation · 3.0% rent growth · sell at horizon
- IRR
- 55.2%
- Equity multiple
- 5.07×
- Total profit
- $96,769
- Equity at exit
- $76,575
- IRR
- 48.7%
- Equity multiple
- 11.31×
- Total profit
- $245,445
- Equity at exit
- $165,136
Cash invested: $23,800 (down + closing). Projections, not guarantees.
Landlord ↔ Tenant lean methodology
- Overall (STATE)
- 87 Strongly Landlord-Friendly
- State Arizona
- 87 Strongly Landlord-Friendly · R+3
- County
- — inherits STATE
- City
- — inherits STATE
ZIP-level market 86440
- Home prices YoY
- 4.2%
- Active inventory
- 217
- Price-to-rent
- 3.9×
Monthly cashflow live
- Estimated rent
- $1,816 medium interval (Pro) →
- Mortgage (P&I)
- −$446
- Tax from tax record
- −$122 /mo · $1,458/yr
- Insurance
- −$35
- HOA
- −$40
- Vacancy / Maint / Mgmt
- −$381
- Net cashflow
- $792
Break-even live
Sensitivity live
| Price | -10% $840 | -5% $816 | +0% $792 | +5% $767 | +10% $743 |
|---|---|---|---|---|---|
| Rent | -10% $648 | -5% $720 | +0% $792 | +5% $863 | +10% $935 |
| Rate | -1.0pp $834 | -0.5pp $813 | base $792 | +0.5pp $770 | +1.0pp $747 |
UW: 25.0% down · 7.5% · 30yr · 1.5% tax · 5.0% vac · 8.0% maint · 8.0% mgmt
Financing live
Cash to close
- Down payment
- $21,250
- Closing costs
- $2,550
- Reserves months
- —
- Total cash needed
- —
Loan-product check · same deal, 3 products live
Conventional
25% down · 7.5% · 30yr
- Down + closing
- —
- Monthly P&I
- —
- Monthly cashflow
- —
- DSCR
- —
- Eligible?
- —
Personal DTI + credit; lowest rate.
DSCR
20% down · 8.5% · 30yr
- Down + closing
- —
- Monthly P&I
- —
- Monthly cashflow
- —
- DSCR
- —
- Eligible?
- —
No personal income docs; deal must DSCR.
Hard money
10% down · 12.0% · 12mo
- Down + closing
- —
- Monthly P&I
- —
- Monthly cashflow
- —
- DSCR
- —
- Eligible?
- —
Short-term bridge; refi at stabilization.
Rent comps 2 comps
| Address | Beds | Baths | Sqft | Rent | $/sqft | DOM | Units | Dist |
|---|---|---|---|---|---|---|---|---|
| 1747 E Winter Haven Dr Mohave Valley, AZ | 3.0 | 2.0 | 1826 | $1,850 | $1.01 | 14d | 1 | 0.05mi |
| 7458 S Mountain View Rd Mohave Valley, AZ | 3.0 | 2.0 | 1440 | $1,525 | $1.06 | 22d | 1 | 0.77mi |
HOA detail
- Monthly dues
- $40 · $480/yr
Listing history 33 events
-
2026-06-18days on market $85,000 Active 6 DOM
-
2026-06-17days on market $85,000 Active 5 DOM
-
2026-06-16days on market $85,000 Active 4 DOM
-
2026-06-15days on market $85,000 Active 3 DOM
-
2026-06-13pricedays on market $85,000 Active 1 DOM
-
2026-06-01days on market $333,000 Active 20 DOM
-
2026-05-31days on market $333,000 Active 19 DOM
-
2026-05-30days on market $333,000 Active 18 DOM
-
2026-02-04status Pending
-
2026-01-30price $255,000
-
2026-01-20$275,000 Active
-
2025-03-14price $305,000
-
2025-01-06price $324,900
-
2024-12-02status Active
-
2024-11-26status Pending
-
2024-11-03$349,900 Active
-
2024-10-10price $365,000
-
2024-06-29$368,000 Active
-
2024-06-17price $368,000
-
2024-05-17$370,000 Active
-
2021-11-18soldstatus $316,000
-
2021-06-18$316,000
-
2021-01-22$339,900
-
2020-12-29$339,900
-
2018-09-28soldstatus $190,000
-
2018-09-28soldstatus $190,000
-
2018-04-12$190,000
-
2017-10-17$185,000
-
2015-07-23soldstatus $130,000
-
2005-10-06soldstatus $245,000
-
2005-03-01soldstatus $210,000
-
2003-03-25soldstatus $123,000
-
1993-07-23soldstatus $550,000
ⓘ Source: listings_history table (triggers on properties + properties_extension) + one-shot
backfill from property_details.listing_events for pre-trigger history.
Tax reassessment forecast AZ · Resets to sale price
- Current annual tax
- $1,458 · $122/mo
- Projected year-2 tax
- $1,458 · $122/mo
- Expected delta
- $0/yr ($0/mo · 0.0%)
ⓘ Screening estimate from a state-policy table — verify with the county assessor before closing.
Nearby sold comps map
Loading sold comps map…
Walkable amenities ~0.75 mi
Loading nearby amenities…
Taxation est. · year 1
- Rental income
- $21,786
- − Mortgage interest
- −$4,761
- − Property taxes
- −$1,458
- − Insurance
- −$425
- − Repairs & maintenance
- −$1,743
- − Management
- −$1,743
- − HOA
- −$480
- − Depreciation
- −$2,473
- Taxable income
- $8,703
- Est. tax owed @ 24.0%
- −$2,089
- After-tax cash flow
- $7,410/yr
For passive investors: Depreciation is non-cash, so a rental often shows a tax loss while cash-flowing — sheltering income. Rental losses are passive: they offset passive income freely, and up to $25,000/yr can offset ordinary (W-2) income if you actively participate and your MAGI is under $100k (phasing out to $0 by $150k); unused losses carry forward. On sale, claimed depreciation is recaptured at up to 25%, and gains may owe capital-gains tax (a 1031 exchange can defer both). Figures are a year-1 estimate at your 24.0% rate — not tax advice; consult a CPA.
Schools (NCES district)
- District
- Colorado River Union High School District (4381)
- NCES district ID
- 0400082
- Math proficiency
- 13% ▼ -17.00%
- Reading proficiency
- 17% ▼ -18.00%
- Median HH income
- $39,132
- Composite
- 12.72/100
- National rank
- #9603
- State rank
- #213 of 249 in AZ
Livability — Mohave Valley
- Score
- 65/100
- State rank
- #83
- US rank
- #13041
Category grades
Schools grade is shown separately in the Schools card above.
Census & demographics
- Census place
- Mohave Valley, AZ
- Population (ZIP)
- 8,403
Population outlook (Mohave County) Hauer SSP2
- Today (2025)
- 209,184 people
- By 2030
- 209,674 · +0.2%
- By 2040
- 205,897 · -1.6%
- By 2050
- 196,810 · -5.9%
- By 2075
- 169,454 · -19.0%
- By 2100
- 136,630 · -34.7%
Race, ethnicity, and origin ACS 2023
- Neighborhood character
- Predominantly White (73%)
- Race & ethnicity
- White 73% Hispanic / Latino 20% Two or more races 11% Native American 4%
- Hispanic origin (detail)
- Mexican 11%
- Common ancestry
- Lithuanian 3% Iranian 2% Italian 2%
- Foreign-born
- 1% · Canada
- Languages at home
- 96% English-only · Spanish 3%
Political lean MEDSL · Mohave
- 2024 margin
- Solid R (+55.8) · D 21.8% · R 77.6%
- 2008→2024 swing
- -22.9pp toward R · 2008: -32.9pp · 2024: -55.8pp
- All cycles
- 2024: R+55.8 2020: R+51.3 2016: R+51.5 2012: R+42.6 2008: R+32.9
Not yet ingested
- Civics
- —
Market trends
- HPI YoY
- ▲ 13.05%
- Current HPI
- 322.7772
- Rent YoY
- —
- Metro
- —
- State GDP YoY
- ▲ 4.54%
- F500 in state
- 20
Industry mix (Fortune 500 HQ in AZ)
| Industry | F500 HQs | Revenue |
|---|---|---|
| Technology | 2 | $13B |
|
||
| Mining / Metals | 1 | $23B |
|
||
| Environmental Services | 1 | $16B |
|
||
| Metals / Steel | 1 | $14B |
|
||
| Technology Distribution | 1 | $9B |
|
||
| Homebuilding | 1 | $8B |
|
||
Price history
-53.6% since first listed25 events — show timeline
- 2026-02-04 Pending — WARDEX
- 2026-01-30 Price Changed $255,000 WARDEX
- 2026-01-20 Listed $275,000 WARDEX
- 2025-03-14 Price Changed $305,000 WARDEX
- 2025-01-06 Price Changed $324,900 WARDEX
- 2024-12-02 Relisted — WARDEX
- 2024-11-26 Pending — WARDEX
- 2024-11-03 Listed $349,900 WARDEX
- 2024-10-10 Price Changed $365,000 WARDEX
- 2024-06-29 Listed $368,000 WARDEX
- 2024-06-17 Price Changed $368,000 WARDEX
- 2024-05-17 Listed $370,000 WARDEX
- 2021-11-18 Sold (MLS) $316,000 WARDEX
- 2021-06-18 Listed $316,000 WARDEX
- 2021-01-22 Listed $339,900 WARDEX
- 2020-12-29 Listed $339,900 LHAR
- 2018-09-28 Sold (Public Records) $190,000 Public Records
- 2018-09-28 Sold (MLS) $190,000 WARDEX
- 2018-04-12 Listed $190,000 WARDEX
- 2017-10-17 Listed $185,000 WARDEX
- 2015-07-23 Sold (Public Records) $130,000 Public Records
- 2005-10-06 Sold (Public Records) $245,000 Public Records
- 2005-03-01 Sold (Public Records) $210,000 Public Records
- 2003-03-25 Sold (Public Records) $123,000 Public Records
- 1993-07-23 Sold (Public Records) $550,000 Public Records
Property tax history
+4.2%/yrLatest (2025): $1,458 · +15.4% YoY. Source: county tax records.
Cash-flow waterfall
monthlySold comps — $/sqft
last 12 mo · ≤1 miLoading sold comps…