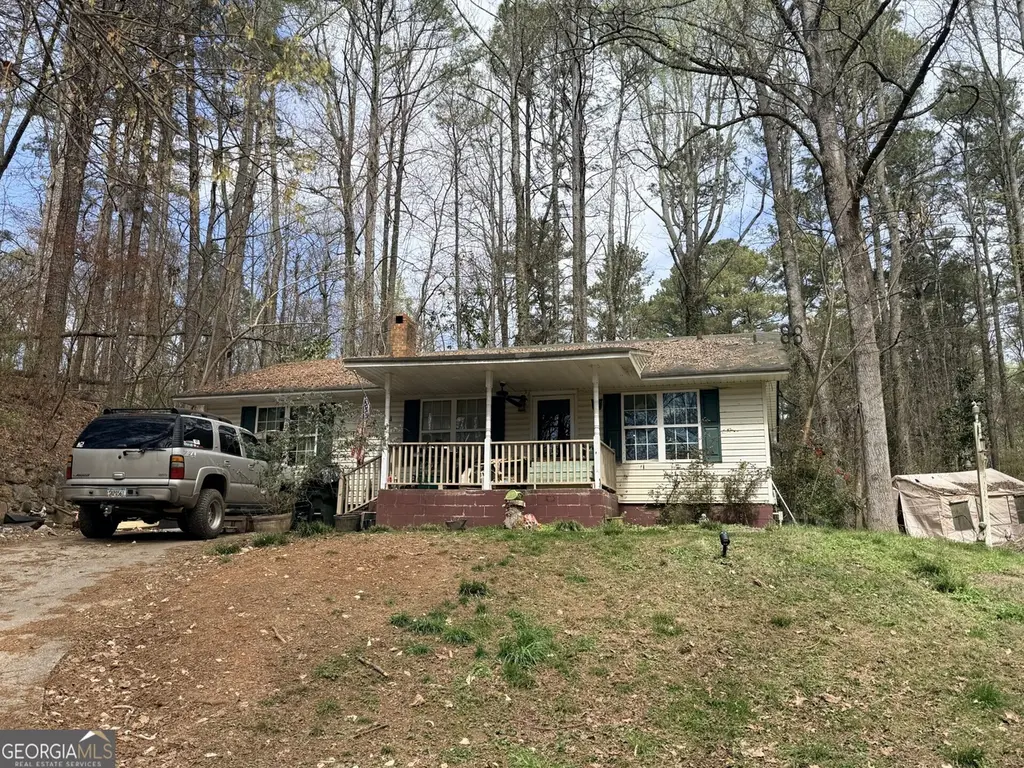
235 Nature Path · Dallas, GA
Flood risk 1/10 · Minimal
- FEMA flood zone
- X (unshaded)
- Chance of flooding over 30 yrs
- 0.0%
- Est. flood insurance / yr
- $507 – $1,088
Fire risk 4/10 · Minor
- Est. fire insurance / yr
- $963 – $1,789
Heat risk 5/10 · Moderate
- Hot days now (above 103°F)
- 7 days/yr
- Hot days in 30 yrs
- 17 days/yr
Wind risk 5/10 · Moderate
- Chance of severe wind over 30 yrs
- 25.0%
Air-quality risk 4/10 · Minor
- Unhealthy air days now
- 4 days/yr
- Unhealthy air days in 30 yrs
- 5 days/yr
Risk factors via First Street. Map © Google.
Why this score? — see what drove the D grade
The composite is a weighted blend of 9 inputs, each scored 0–100. Each bar is that input's sub-score; the figure is the points it added to the 100-point composite (weight × sub-score).
- ARV discount +15.0/15.0
- Cash flow +9.4/30.0
- Schools +3.6/10.0
- Livability +3.3/5.0
- Rent growth +3.0/5.0
- DSCR +2.6/10.0
- Condition / age +2.5/5.0
- 1% rule +2.1/10.0
- Appreciation +0.0/10.0
$235,000
🖨 Deal sheet (PDF) 📄 Offer letter ✓ Due diligence
Listing remarks MLS
Come check out this adorable 3 bed/ 2 bath ranch, sitting on 3.66 acres. From it's open floor plan, to the accent fireplace, you will feel right at home. This home is an open canvas, ready for your buyers to add their own personal touch. This home encompasses the split bedroom plan buyers love! Heading outside you have a barn, a private lot and vinyl exterior for low maintenance. If that's not enough, you have the option to buy the neighboring home sitting on an additional 1.21acres (235 Nature Path). Schedule your appointment and let's make a deal!
Key facts
- Open floor plan
- Accent fireplace
- Private lot
Tags
Neighborhood map
What this means for you Summary
Snapshot
- This is a 2-bed/1.0-bath single-family listed at $235k.
Deal economics
- At list price, monthly cash flow is $-169 ($-2k/yr) — negative.
- To cash-flow at today's rent, offer at most $205k (12.7% below list).
- To meet the 1% rule (rent ≥ 1% of price), the offer needs to be $168k (28.6% below list).
- Recommended offer: $168k (28.6% below list) — sets the bar for 1% rule.
- Cap rate 5.4% vs local median 4.2% in Dallas — meaningfully above typical; check what's discounted (condition, days-on-market, listing class) to confirm the premium yield is real.
Location & tenants
- Location reads 66/100 on livability (#192 in GA) — a middle-class / working-renter tenant base. Strengths: crime A+, cost of living A+, housing A+; Watch: employment C-, schools D, amenities F.
- Paulding County (suburban): math 39% / reading 42% proficiency, ranked #33 of 174 in GA (top 19%) — families likely to look elsewhere, expect single-tenant / working-renter base with shorter leases.
- Market conditions: Rents rising (+1.8%/yr); 674 active listings in the ZIP; 18 comparable units currently listed for rent nearby; rentals at typical pace (median 25d on market — plan ~3-4 weeks tenant-placement turnaround); 44% of comp listings sitting > 30 days — soft ceiling on asking rent; solid renter incomes; 1,458 units permitted in Paulding County in 2024 (0 in 5+ unit buildings).
Forward outlook
- Local home prices are declining (-3.0%/yr); year-one equity from $2k of loan paydown is wiped out by about $7k of value loss. Plan a longer hold.
- Paulding County population projected at +24% by 2050 — long-run rental-demand tailwind backs the buy-and-hold thesis.
Negotiation context
- It's been on market 89 days — a 6% lower offer ($221k) is reasonable based on typical stale-listing flexibility.
Risks & watch-outs
- Climate carrying-cost: moderate wind risk, 25% chance of damaging wind over 30y; extreme-heat days projected 7→17/yr by 2055 (HVAC capex compounding) — expect insurance premiums to compound above CPI over the hold.
Questions for the listing agent
- What do current leases actually rent for vs. the listed asking? Can we see a recent rent roll and the last 12 months of T-12 income?
- It's been on market 89 days. Have you received any prior offers? Is the seller open to a 29% concession, seller financing, or rate buy-down credit?
- Built in 1972 — when were the roof, HVAC, electrical panel, plumbing, and water heater last replaced?
- Why hasn't it sold? Are there any deal-killer items the seller is aware of (foundation, flood, title, zoning, code violations)?
- Is there a deadline driving the sale (1031 exchange, divorce, estate, relocation)? That informs how much negotiation room exists.
- Schools are D-rated, which usually means shorter tenancies and higher turnover. Who's the typical renter profile here, and what's been the actual vacancy rate?
- The area grade is low — what's the realistic commute time and amenity access for the typical tenant pool here? Any planned neighborhood developments (good or bad) we should know about?
- What's the average days-on-market for RENTAL listings here right now (not sales)? A rising rental-DOM trend means longer vacancies and softer asking-rent achievability than the comps imply.
- What's the recent tenant-quality profile in this submarket — average credit score on applications, eviction rate, late-payment / NSF rate, and stable-employment percentage? A property-management company in the area should have these aggregated.
- How much new for-sale + rental construction is in the pipeline within 1–3 miles? Heavy new supply typically softens prices + rents 12–24 months out; constrained supply supports both.
Investment metrics
- 1% rule
- 0.71% ✗
- Cap rate
- 5.43%
- Cash-on-cash
- -3.09%
- DSCR
- 0.86
- GRM
- 11.7
CMA / ARV
- ARV (median comp)
- $288,998
- List price
- $235,000
- Delta
- -18.68%
- Verdict
- UNDERPRICED
- Comps
- 20 within 1.0 mi
Show comp detail 12 sales within ~0.75 mi
| Address | Dist | Beds/Ba | Sqft | Sold | Price | $/sf | Match |
|---|---|---|---|---|---|---|---|
| 139 Circle Hill Dr | 0.59mi | 3/1.5 (+1) | 1,225 (+4%) | 4mo | $26,500 | $22 | 55 |
| 342 Dandy Rd | 0.38mi | 3/2.0 (+1) | 1,297 (+10%) | 2mo | $324,900 | $251 | 55 |
| 102 Huntington Way | 0.66mi | 3/2.0 (+1) | 1,140 (-3%) | 11mo | $255,000 | $224 | 46 |
| 105 Huntington Ct | 0.72mi | 3/2.0 (+1) | 1,208 (+3%) | 12mo | $267,000 | $221 | 43 |
| 126 Silver Fox Trl | 0.62mi | 3/2.5 (+1) | 1,260 (+7%) | 14mo | $254,900 | $202 | 37 |
| 205 Remington Ct | 0.60mi | 3/2.0 (+1) | 1,336 (+14%) | 5mo | $280,000 | $210 | 36 |
| 298 Sweetgum Ln | 0.72mi | 3/2.0 (+1) | 1,104 (-6%) | 14mo | $265,000 | $240 | 35 |
| 217 Remington Ct | 0.63mi | 3/2.0 (+1) | 1,348 (+15%) | 3mo | $240,500 | $178 | 35 |
| 219 Remington Ct | 0.63mi | 3/2.0 (+1) | 1,244 (+6%) | 21mo | $280,000 | $225 | 34 |
| 212 Silver Ridge Dr | 0.66mi | 3/2.5 (+1) | 1,300 (+10%) | 12mo | $250,000 | $192 | 30 |
| 118 Colt Ln | 0.70mi | 3/2.0 (+1) | 1,334 (+13%) | 10mo | $310,000 | $232 | 28 |
| 121 Colt Ln | 0.66mi | 3/2.0 (+1) | 1,308 (+11%) | 20mo | $280,000 | $214 | 25 |
Match score weights: distance 35% · size 25% · config 20% · recency 20%. Top-matched comps best support the ARV.
Projected returns pro-forma
-3.0% appreciation · 1.84% rent growth · sell at horizon
- IRR
- -22.7%
- Equity multiple
- 0.23×
- Total profit
- $-50,865
- Equity at exit
- $35,039
- IRR
- -20.0%
- Equity multiple
- -0.01×
- Total profit
- $-66,174
- Equity at exit
- $20,319
Cash invested: $65,800 (down + closing). Projections, not guarantees.
Landlord ↔ Tenant lean methodology
- Overall (STATE)
- 90 Strongly Landlord-Friendly
- State Georgia
- 90 Strongly Landlord-Friendly · R+3
- County
- — inherits STATE
- City
- — inherits STATE
ZIP-level market 30132
- Home prices YoY
- -33.1%
- Rents YoY
- 1.8%
- Active inventory
- 674
- Price-to-rent
- 11.7×
Monthly cashflow live
- Estimated rent
- $1,678 high interval (Pro) →
- Mortgage (P&I)
- −$1,232
- Tax from tax record
- −$165 /mo · $1,981/yr
- Insurance
- −$98
- HOA
- −$0
- Vacancy / Maint / Mgmt
- −$352
- Net cashflow
- $-169
Break-even live
Sensitivity live
| Price | -10% $-36 | -5% $-103 | +0% $-169 | +5% $-236 | +10% $-303 |
|---|---|---|---|---|---|
| Rent | -10% $-302 | -5% $-236 | +0% $-169 | +5% $-103 | +10% $-37 |
| Rate | -1.0pp $-51 | -0.5pp $-110 | base $-169 | +0.5pp $-230 | +1.0pp $-292 |
UW: 25.0% down · 7.5% · 30yr · 1.5% tax · 5.0% vac · 8.0% maint · 8.0% mgmt
Financing live
Cash to close
- Down payment
- $58,750
- Closing costs
- $7,050
- Reserves months
- —
- Total cash needed
- —
Loan-product check · same deal, 3 products live
Conventional
25% down · 7.5% · 30yr
- Down + closing
- —
- Monthly P&I
- —
- Monthly cashflow
- —
- DSCR
- —
- Eligible?
- —
Personal DTI + credit; lowest rate.
DSCR
20% down · 8.5% · 30yr
- Down + closing
- —
- Monthly P&I
- —
- Monthly cashflow
- —
- DSCR
- —
- Eligible?
- —
No personal income docs; deal must DSCR.
Hard money
10% down · 12.0% · 12mo
- Down + closing
- —
- Monthly P&I
- —
- Monthly cashflow
- —
- DSCR
- —
- Eligible?
- —
Short-term bridge; refi at stabilization.
Rent comps 18 comps
| Address | Beds | Baths | Sqft | Rent | $/sqft | DOM | Units | Dist |
|---|---|---|---|---|---|---|---|---|
| 1068 Merchants Dr Dallas, GA | 2.0–3.0 | 2.0 | 1300 | $1,525 | $1.17 | 4d | 12 | 0.21mi |
| 40 Colton Dr Dallas, GA | 3.0 | 2.0 | 1467 | $1,845 | $1.26 | 44d | 1 | 0.56mi |
| 179 Silver Fox Trl Dallas, GA | 3.0 | 2.0 | 1260 | $1,765 | $1.40 | 2d | 1 | 0.63mi |
| 217 Remmington Ct Dallas, GA | 3.0 | 2.0 | 1208 | $1,700 | $1.41 | 44d | 1 | 0.65mi |
| 102 Huntington Way Dallas, GA | 3.0 | 2.0 | 1140 | $1,495 | $1.31 | 44d | 1 | 0.68mi |
| 424 W I Pkwy Dallas, GA | 2.0 | 1.5 | 1000 | $1,350 | $1.35 | 44d | 1 | 0.69mi |
| 350 WI Pkwy Unit 16 Dallas, GA | 2.0 | 1.5 | 1200 | $1,349 | $1.12 | 44d | 1 | 0.70mi |
| 426 W I Pkwy Dallas, GA | 2.0 | 1.5 | 1088 | $1,325 | $1.22 | 44d | 1 | 0.70mi |
| 432 W I Pkwy Dallas, GA | 2.0 | 1.5 | 1000 | $1,295 | $1.29 | 23d | 1 | 0.72mi |
| 350 WI Pkwy Unit 12 Dallas, GA | 2.0 | 1.5 | 1200 | $1,349 | $1.12 | 25d | 1 | 0.74mi |
| 113 Colt Ln Dallas, GA | 3.0 | 2.0 | 1208 | $1,769 | $1.46 | 3d | 1 | 0.74mi |
| 1175 Old Harris Rd Dallas, GA | 1.0–3.0 | 1.0–2.0 | 1049 | $1,428 | $1.36 | 2d | 30 | 0.77mi |
| 211 Hampton Dr Dallas, GA | 3.0 | 2.0 | 1104 | $1,760 | $1.59 | 6d | 1 | 1.14mi |
| 213 Hampton Dr Dallas, GA | 3.0 | 2.0 | 1392 | $1,700 | $1.22 | 20d | 1 | 1.14mi |
| 234 Vernoy Aiken Rd Dallas, GA | 2.0 | 1.0 | 900 | $1,325 | $1.47 | 44d | 1 | 1.29mi |
| 103 Topaz Dr Dallas, GA | 3.0 | 2.0 | 1377 | $1,750 | $1.27 | 44d | 1 | 1.39mi |
| 430 Ivy Crest Dr Dallas, GA | 3.0 | 2.0 | 1220 | $1,900 | $1.56 | 6d | 1 | 1.46mi |
| 426 Ivy Crest Dr Dallas, GA | 3.0 | 2.0 | 1220 | $1,865 | $1.53 | 2d | 1 | 1.47mi |
Listing history 15 events
-
2026-06-18days on market $235,000 Active 89 DOM
-
2026-06-17days on market $235,000 Active 88 DOM
-
2026-06-16days on market $235,000 Active 87 DOM
-
2026-06-15days on market $235,000 Active 86 DOM
-
2026-06-13days on market $235,000 Active 84 DOM
-
2026-06-13days on market $235,000 Active 83 DOM
-
2026-06-09days on market $235,000 Active 80 DOM
-
2026-06-08days on market $235,000 Active 79 DOM
-
2026-06-07days on market $235,000 Active 78 DOM
-
2026-06-04days on market $235,000 Active 75 DOM
-
2026-06-03days on market $235,000 Active 74 DOM
-
2026-06-02days on market $235,000 Active 73 DOM
-
2026-06-01days on market $235,000 Active 72 DOM
-
2026-05-31days on market $235,000 Active 71 DOM
-
2026-03-16$235,000 New 555-char remark
Show marketing remark (555 chars)
Come check out this adorable 3 bed/ 2 bath ranch, sitting on 3.66 acres. From it's open floor plan, to the accent fireplace, you will feel right at home. This home is an open canvas, ready for your buyers to add their own personal touch. This home encompasses the split bedroom plan buyers love! Heading outside you have a barn, a private lot and vinyl exterior for low maintenance. If that's not enough, you have the option to buy the neighboring home sitting on an additional 1.21acres (235 Nature Path). Schedule your appointment and let's make a deal!
ⓘ Source: listings_history table (triggers on properties + properties_extension) + one-shot
backfill from property_details.listing_events for pre-trigger history.
Tax reassessment forecast GA · Resets to sale price
- Current annual tax
- $1,981 · $165/mo
- Projected year-2 tax
- $2,162 · $180/mo
- Expected delta
- +$181/yr (+$15/mo · 9.2%)
ⓘ Screening estimate from a state-policy table — verify with the county assessor before closing.
Climate risk First Street
- Flood 1/10 Low FEMA zone X (unshaded) · 0% chance over 30 yrs
- Wildfire 4/10 Moderate
- Heat 5/10 Major 7 d/yr ≥103°F today · 17 d/yr by 30 yrs out
- Wind 5/10 Major 25% chance of damaging wind over 30 yrs
- Air quality 4/10 Moderate 4 unhealthy d/yr today · 5 by 30 yrs out
Nearby sold comps map
Loading sold comps map…
Walkable amenities ~0.75 mi
Loading nearby amenities…
Taxation est. · year 1
- Rental income
- $20,140
- − Mortgage interest
- −$13,164
- − Property taxes
- −$1,981
- − Insurance
- −$1,175
- − Repairs & maintenance
- −$1,611
- − Management
- −$1,611
- − Depreciation
- −$6,836
- Taxable loss
- −$6,238
- Est. tax savings @ 24.0%
- +$1,497
- After-tax cash flow
- $-537/yr
For passive investors: Depreciation is non-cash, so a rental often shows a tax loss while cash-flowing — sheltering income. Rental losses are passive: they offset passive income freely, and up to $25,000/yr can offset ordinary (W-2) income if you actively participate and your MAGI is under $100k (phasing out to $0 by $150k); unused losses carry forward. On sale, claimed depreciation is recaptured at up to 25%, and gains may owe capital-gains tax (a 1031 exchange can defer both). Figures are a year-1 estimate at your 24.0% rate — not tax advice; consult a CPA.
Schools (NCES district)
- District
- Paulding County
- NCES district ID
- 1304020
- Math proficiency
- 39% ▼ -6.00%
- Reading proficiency
- 42% ▼ -7.00%
- Median HH income
- $61,447
- Composite
- 36.0/100
- National rank
- #4784
- State rank
- #33 of 174 in GA
Livability — Dallas
- Score
- 66/100
- State rank
- #192
- US rank
- #11802
Category grades
Schools grade is shown separately in the Schools card above.
Census & demographics
- County
- Paulding County · 134,013 people
- City population
- 106,793
- Metro
- Atlanta-Sandy Springs-Alpharetta, GA
- Population (ZIP)
- 53,348
- Household income
- $109,914
- Rent vs Own
- Severe rent burden
- 593.0
Population outlook (Paulding County) Hauer SSP2
- Today (2025)
- 175,714 people
- By 2030
- 186,082 · +5.9%
- By 2040
- 204,414 · +16.3%
- By 2050
- 217,040 · +23.5%
- By 2075
- 236,980 · +34.9%
- By 2100
- 238,314 · +35.6%
Race, ethnicity, and origin ACS 2023
- Neighborhood character
- Majority White (64%)
- Race & ethnicity
- White 64% Black 19% Hispanic / Latino 9% Two or more races 8% Asian 2%
- Hispanic origin (detail)
- Mexican 3% Puerto Rican 2%
- Common ancestry
- Slovak 2% Romanian 2% Lithuanian 2%
- Foreign-born
- 8% · Canada, China
- Languages at home
- 91% English-only · Spanish 5% Other Indo-European 1% Tagalog/Filipino 1%
Political lean MEDSL · Paulding
- 2024 margin
- Strong R (+24.1) · D 37.6% · R 61.7%
- 2008→2024 swing
- +14.4pp toward D · 2008: -38.5pp · 2024: -24.1pp
- All cycles
- 2024: R+24.1 2020: R+29.1 2016: R+41.2 2012: R+43.6 2008: R+38.5
Not yet ingested
- Civics
- —
Market trends
- HPI YoY
- ▼ -92.85%
- Current HPI
- 187.6553
- Rent YoY
- ▲ 1.84%
- Metro
- Atlanta-Sandy Springs-Alpharetta, GA
- State GDP YoY
- ▲ 2.66%
- F500 in state
- 28
Industry mix (Fortune 500 HQ in GA)
| Industry | F500 HQs | Revenue |
|---|---|---|
| Paper / Packaging | 2 | $29B |
|
||
| Retail | 1 | $160B |
|
||
| Transportation / Logistics | 1 | $91B |
|
||
| Airlines | 1 | $62B |
|
||
| Consumer Goods | 1 | $47B |
|
||
| Utilities | 1 | $25B |
|
||
Price history
1 event — show timeline
- 2026-03-16 Listed $235,000 GAMLS
Property tax history
+5.8%/yrLatest (2025): $1,981 · +5.0% YoY. Source: county tax records.
Cash-flow waterfall
monthlySold comps — $/sqft
last 12 mo · ≤1 miLoading sold comps…