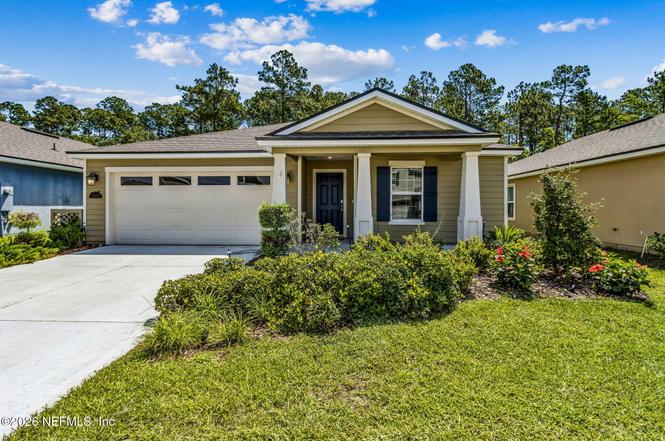
86607 Nassau Crossing Way · Yulee, FL
Flood risk 1/10 · Minimal
- FEMA flood zone
- X (unshaded)
- Chance of flooding over 30 yrs
- 0.0%
- Est. flood insurance / yr
- $507 – $1,088
Fire risk 6/10 · Moderate
- Est. fire insurance / yr
- $947 – $1,759
Heat risk 9/10 · Severe
- Hot days now (above 106°F)
- 7 days/yr
- Hot days in 30 yrs
- 19 days/yr
Wind risk 9/10 · Severe
- Chance of severe wind over 30 yrs
- 99.0%
Air-quality risk 5/10 · Moderate
- Unhealthy air days now
- 6 days/yr
- Unhealthy air days in 30 yrs
- 7 days/yr
Risk factors via First Street. Map © Google.
Why this score? — see what drove the C- grade
The composite is a weighted blend of 9 inputs, each scored 0–100. Each bar is that input's sub-score; the figure is the points it added to the 100-point composite (weight × sub-score).
- ARV discount +11.1/15.0
- Cash flow +10.3/30.0
- Appreciation +10.0/10.0
- Schools +6.0/10.0
- Livability +3.3/5.0
- Rent growth +3.2/5.0
- DSCR +2.9/10.0
- 1% rule +2.8/10.0
- Condition / age +2.5/5.0
$340,000
🖨 Deal sheet (PDF) 📄 Offer letter ✓ Due diligence
Listing remarks MLS
Nassau Crossing is a new D. R. Horton community that offers thoughtfully designed homes featuring one and two-story open floor plans with smart energy-efficient features and NO CDD FEES! Homeowners in Nassau Crossing will enjoy excellent shopping, top-rated schools, plus Historic Amelia Island and world-renowned beaches are just a short drive away. We have two model homes NOW OPEN so stop by or call for more information.
Key facts
- Tile flooring
- Granite countertops
- Gas range
Tags
Property features AI
Finance
- HOA & community: Community association with annual fee of $600; Community amenities include dog park, park, and playground; Sidewalks in the community
Exterior
- Parking: Attached garage with 2 spaces
- Utilities: Public sewer; Water connected; Sewer connected; Electricity connected; Natural gas connected; Cable available
- Home design: Single-family residence; One level
- Construction: Fiber cement exterior; Shingle roof
- Exterior features: Front porch; Patio; City street frontage; Asphalt road access
Interior
- Kitchen: Dishwasher; Disposal; Gas range; Microwave; Refrigerator; Kitchen island; Pantry
- Bedrooms: 4 bedrooms (primary bedroom on main level)
- Flooring: Carpet; Tile
- Bathrooms: 2 full bathrooms
- Heating & cooling: Central heating; Central air conditioning
- Interior features: Ceiling fans; Jack and Jill bathroom; Kitchen island; Open floor plan; Pantry; Primary bathroom with shower (no tub); Split bedroom layout; Walk-in closets
- Laundry & utility: In-unit laundry; Washer and dryer included; Tankless water heater
Neighborhood map
What this means for you Summary
Snapshot
- This is a 4-bed/2.0-bath single-family listed at $340k.
Deal economics
- At list price, monthly cash flow is $-190 ($-2k/yr) — negative.
- To cash-flow at today's rent, offer at most $307k (9.8% below list).
- To meet the 1% rule (rent ≥ 1% of price), the offer needs to be $266k (21.8% below list).
- Recommended offer: $266k (21.8% below list) — sets the bar for 1% rule.
- Cap rate 5.6% vs local median 3.3% in Yulee — top-decile yield for the area; either an underpriced asset or a hidden risk that comps aren't pricing in. Stress-test before assuming the spread holds.
Location & tenants
- Location reads 66/100 on livability (#605 in FL) — a middle-class / working-renter tenant base. Strengths: housing A+, cost of living A-, crime B+; Watch: amenities F, commute F, health & safety F.
- Nassau (town): math 74% / reading 65% proficiency, ranked #4 of 73 in FL (top 6%) — acceptable for families but not a draw, mixed tenant base, ~2y average lease.
- Market conditions: Rents rising (+2.9%/yr); 601 active listings in the ZIP; 6 comparable units currently listed for rent nearby; rentals at typical pace (median 25d on market — plan ~3-4 weeks tenant-placement turnaround); solid renter incomes; 953 units permitted in Nassau County in 2024 (24 in 5+ unit buildings).
- This rent runs 34% of the median local income ($93k/yr) — at the standard rent-burdened threshold; future hikes will face affordability resistance.
Forward outlook
- In year one you build about $36k of equity ($2k loan paydown + $34k appreciation (10.0% local appreciation)).
- Nassau County population projected at +17% by 2050 — long-run rental-demand tailwind backs the buy-and-hold thesis.
- By year 2, paydown + projected appreciation supports a ~$58k cash-out refi (75% LTV) — recoverable capital for the next deal without selling this one.
Negotiation context
- Only 11 days on market — expect competitive offers; lowballing is unlikely to land.
- 4 sale attempts since 4y ago with the ask held roughly flat each time — persistent listings suggest the price (not the market) is what's stuck; bring a comps-based counter.
Risks & watch-outs
- Climate carrying-cost: severe wind risk, 99% chance of damaging wind over 30y; major wildfire risk; extreme-heat days projected 7→19/yr by 2055 (HVAC capex compounding) — expect insurance premiums to compound above CPI over the hold.
Questions for the listing agent
- What do current leases actually rent for vs. the listed asking? Can we see a recent rent roll and the last 12 months of T-12 income?
- What does the HOA fee cover, when was the last increase, and are there any pending special assessments or reserve-fund shortfalls?
- Is there a deadline driving the sale (1031 exchange, divorce, estate, relocation)? That informs how much negotiation room exists.
- Schools are B-rated — typically a magnet for longer-tenancy family renters. What's the average tenant stay here, and is there a school-zone premium baked into asking?
- What's the average days-on-market for RENTAL listings here right now (not sales)? A rising rental-DOM trend means longer vacancies and softer asking-rent achievability than the comps imply.
- What's the recent tenant-quality profile in this submarket — average credit score on applications, eviction rate, late-payment / NSF rate, and stable-employment percentage? A property-management company in the area should have these aggregated.
- How much new for-sale + rental construction is in the pipeline within 1–3 miles? Heavy new supply typically softens prices + rents 12–24 months out; constrained supply supports both.
Investment metrics
- 1% rule
- 0.78% ✗
- Cap rate
- 5.62%
- Cash-on-cash
- -2.39%
- DSCR
- 0.89
- GRM
- 10.7
CMA / ARV
- ARV (on-the-fly)
- $369,344
- Comps found
- 12
Show comp detail 12 sales within ~0.75 mi
| Address | Dist | Beds/Ba | Sqft | Sold | Price | $/sf | Match |
|---|---|---|---|---|---|---|---|
| 86204 Buggy Ct | 0.25mi | 3/2.0 (-1) | 1,940 (+4%) | 5mo | $340,000 | $175 | 72 |
| 86021 Tropicana Ct | 0.48mi | 4/2.0 | 1,839 (-1%) | 5mo | $350,000 | $190 | 72 |
| 86178 Mainline Rd | 0.18mi | 3/2.0 (-1) | 1,670 (-10%) | 2mo | $347,900 | $208 | 69 |
| 86857 Iron Rail Ct | 0.21mi | 3/2.0 (-1) | 1,670 (-10%) | 2mo | $315,000 | $189 | 67 |
| 86047 Rio Way | 0.52mi | 3/2.0 (-1) | 2,006 (+8%) | 2mo | $379,999 | $189 | 56 |
| 86011 Aladdins Way | 0.56mi | 3/2.0 (-1) | 1,676 (-10%) | 0mo | $335,000 | $200 | 52 |
| 86163 Venetian Ave | 0.71mi | 4/2.5 | 2,010 (+8%) | 1mo | $399,000 | $199 | 50 |
| 86013 Bellagio Ct | 0.61mi | 3/2.0 (-1) | 1,676 (-10%) | 3mo | $355,000 | $212 | 48 |
| 86148 Venetian Ave | 0.69mi | 3/2.0 (-1) | 1,685 (-9%) | 2mo | $335,000 | $199 | 46 |
| 86351 Moonlit Walk Cir | 0.74mi | 3/2.0 (-1) | 2,017 (+9%) | 3mo | $395,000 | $196 | 43 |
| 86195 Venetian Ave | 0.74mi | 3/2.5 (-1) | 1,685 (-9%) | 2mo | $349,900 | $208 | 41 |
| 86095 Venetian Ave | 0.64mi | 3/2.0 (-1) | 1,611 (-13%) | 4mo | $300,000 | $186 | 40 |
Match score weights: distance 35% · size 25% · config 20% · recency 20%. Top-matched comps best support the ARV.
Projected returns pro-forma
10.0% appreciation · 2.88% rent growth · sell at horizon
- IRR
- 22.5%
- Equity multiple
- 2.81×
- Total profit
- $172,786
- Equity at exit
- $306,299
- IRR
- 20.2%
- Equity multiple
- 6.44×
- Total profit
- $517,677
- Equity at exit
- $660,545
Cash invested: $95,200 (down + closing). Projections, not guarantees.
Landlord ↔ Tenant lean methodology
- Overall (STATE)
- 87 Strongly Landlord-Friendly
- State Florida
- 87 Strongly Landlord-Friendly · R+3
- County
- — inherits STATE
- City
- — inherits STATE
ZIP-level market 32097
- Home prices YoY
- 19.5%
- Rents YoY
- 2.9%
- Active inventory
- 601
- Price-to-rent
- 10.7×
Monthly cashflow live
- Estimated rent
- $2,658 high interval (Pro) →
- Mortgage (P&I)
- −$1,783
- Tax from tax record
- −$315 /mo · $3,779/yr
- Insurance
- −$142
- HOA
- −$50
- Vacancy / Maint / Mgmt
- −$558
- Net cashflow
- $-190
Break-even live
Sensitivity live
| Price | -10% $3 | -5% $-93 | +0% $-190 | +5% $-286 | +10% $-382 |
|---|---|---|---|---|---|
| Rent | -10% $-400 | -5% $-295 | +0% $-190 | +5% $-84 | +10% $21 |
| Rate | -1.0pp $-18 | -0.5pp $-103 | base $-190 | +0.5pp $-278 | +1.0pp $-367 |
UW: 25.0% down · 7.5% · 30yr · 1.5% tax · 5.0% vac · 8.0% maint · 8.0% mgmt
Financing live
Cash to close
- Down payment
- $85,000
- Closing costs
- $10,200
- Reserves months
- —
- Total cash needed
- —
Loan-product check · same deal, 3 products live
Conventional
25% down · 7.5% · 30yr
- Down + closing
- —
- Monthly P&I
- —
- Monthly cashflow
- —
- DSCR
- —
- Eligible?
- —
Personal DTI + credit; lowest rate.
DSCR
20% down · 8.5% · 30yr
- Down + closing
- —
- Monthly P&I
- —
- Monthly cashflow
- —
- DSCR
- —
- Eligible?
- —
No personal income docs; deal must DSCR.
Hard money
10% down · 12.0% · 12mo
- Down + closing
- —
- Monthly P&I
- —
- Monthly cashflow
- —
- DSCR
- —
- Eligible?
- —
Short-term bridge; refi at stabilization.
Rent comps 6 comps
| Address | Beds | Baths | Sqft | Rent | $/sqft | DOM | Units | Dist |
|---|---|---|---|---|---|---|---|---|
| 86215 Buggy Ct Yulee, FL | 3.0 | 2.0 | 1675 | $2,295 | $1.37 | 22d | 1 | 0.22mi |
| 86467 Moonlit Walk Cir Yulee, FL | 4.0 | 3.0 | 2010 | $3,100 | $1.54 | 25d | 1 | 0.93mi |
| 78295 Saddle Rock Rd Yulee, FL | 4.0 | 2.0 | 1846 | $2,191 | $1.19 | 25d | 1 | 1.18mi |
| 76031 Long Pond Loop Yulee, FL | 3.0 | 2.5 | 2459 | $2,500 | $1.02 | 18d | 1 | 1.21mi |
| 77822 Lumber Creek Blvd Yulee, FL | 3.0 | 2.0 | 1543 | $2,200 | $1.43 | 25d | 1 | 1.35mi |
| 86092 Knotted Oak Way Unit Bedroom 1 Yulee, FL | 4.0 | 3.0 | 2414 | $825 | $0.34 | 19d | 1 | 1.40mi |
HOA detail
- Monthly dues
- $50 · $600/yr
Listing history 8 events
-
2026-06-21days on market $340,000 Active 11 DOM
-
2026-06-18days on market $340,000 Active 8 DOM
-
2026-06-17days on market $340,000 Active 7 DOM
-
2026-06-16days on market $340,000 Active 6 DOM
-
2026-06-15days on market $340,000 Active 5 DOM
-
2026-06-13days on market $340,000 Active 3 DOM
-
2026-06-13remarks 699-char remark
-
2026-06-13$340,000 Active 2 DOM
ⓘ Source: listings_history table (triggers on properties + properties_extension) + one-shot
backfill from property_details.listing_events for pre-trigger history.
Tax reassessment forecast FL · Resets to sale price
- Current annual tax
- $3,779 · $315/mo
- Projected year-2 tax
- $3,779 · $315/mo
- Expected delta
- $0/yr ($0/mo · 0.0%)
ⓘ Screening estimate from a state-policy table — verify with the county assessor before closing.
Climate risk First Street
- Flood 1/10 Low FEMA zone X (unshaded) · 0% chance over 30 yrs
- Wildfire 6/10 Major
- Heat 9/10 Extreme 7 d/yr ≥106°F today · 19 d/yr by 30 yrs out
- Wind 9/10 Extreme 99% chance of damaging wind over 30 yrs
- Air quality 5/10 Major 6 unhealthy d/yr today · 7 by 30 yrs out
Nearby sold comps map
Loading sold comps map…
Walkable amenities ~0.75 mi
Loading nearby amenities…
Taxation est. · year 1
- Rental income
- $31,900
- − Mortgage interest
- −$19,045
- − Property taxes
- −$3,779
- − Insurance
- −$1,700
- − Repairs & maintenance
- −$2,552
- − Management
- −$2,552
- − HOA
- −$600
- − Depreciation
- −$9,891
- Taxable loss
- −$8,219
- Est. tax savings @ 24.0%
- +$1,973
- After-tax cash flow
- $-301/yr
For passive investors: Depreciation is non-cash, so a rental often shows a tax loss while cash-flowing — sheltering income. Rental losses are passive: they offset passive income freely, and up to $25,000/yr can offset ordinary (W-2) income if you actively participate and your MAGI is under $100k (phasing out to $0 by $150k); unused losses carry forward. On sale, claimed depreciation is recaptured at up to 25%, and gains may owe capital-gains tax (a 1031 exchange can defer both). Figures are a year-1 estimate at your 24.0% rate — not tax advice; consult a CPA.
Schools (NCES district)
- District
- Nassau
- NCES district ID
- 1201350
- Math proficiency
- 74% ▼ -2.00%
- Reading proficiency
- 65% ▼ -2.00%
- Median HH income
- $58,267
- Composite
- 59.79/100
- National rank
- #899
- State rank
- #4 of 73 in FL
Livability — Yulee
- Score
- 66/100
- State rank
- #605
- US rank
- #11615
Category grades
Schools grade is shown separately in the Schools card above.
Census & demographics
- Census place
- Yulee, FL
- County
- Nassau County · 67,729 people
- City population
- 26,700
- Metro
- Jacksonville, FL
- Population (ZIP)
- 26,700
- Household income
- $93,161
- Rent vs Own
- Severe rent burden
- 404.0
Population outlook (Nassau County) Hauer SSP2
- Today (2025)
- 88,419 people
- By 2030
- 92,679 · +4.8%
- By 2040
- 99,257 · +12.3%
- By 2050
- 103,378 · +16.9%
- By 2075
- 109,726 · +24.1%
- By 2100
- 107,006 · +21.0%
Race, ethnicity, and origin ACS 2023
- Neighborhood character
- Predominantly White (75%)
- Race & ethnicity
- White 75% Two or more races 9% Black 9% Hispanic / Latino 8% Asian 1% Native American 1%
- Hispanic origin (detail)
- Mexican 2% Puerto Rican 2%
- Common ancestry
- Lithuanian 4% Italian 3% Romanian 2%
- Foreign-born
- 4% · Canada, Vietnam
- Languages at home
- 93% English-only · Spanish 5% Vietnamese 1%
Political lean MEDSL · Nassau
- 2024 margin
- Solid R (+46.9) · D 26.1% · R 73.1%
- 2008→2024 swing
- -3.1pp toward R · 2008: -43.8pp · 2024: -46.9pp
- All cycles
- 2024: R+46.9 2020: R+45.9 2016: R+50.2 2012: R+48.6 2008: R+43.8
Not yet ingested
- Civics
- —
Market trends
- HPI YoY
- ▲ 49.35%
- Current HPI
- 301.9299
- Rent YoY
- ▲ 2.88%
- Metro
- Jacksonville, FL
- State GDP YoY
- ▲ 3.28%
- F500 in state
- 36
Industry mix (Fortune 500 HQ in FL)
| Industry | F500 HQs | Revenue |
|---|---|---|
| Industrial Technology | 2 | $29B |
|
||
| Insurance | 2 | $17B |
|
||
| Retail | 1 | $60B |
|
||
| Technology Distribution | 1 | $58B |
|
||
| Homebuilding | 1 | $35B |
|
||
| Technology Manufacturing | 1 | $35B |
|
||
Price history
-62.4% since first listed10 events — show timeline
- 2026-06-10 Listed $340,000 realMLS
- 2022-06-28 Sold (MLS) $342,490 AINCAR
- 2022-06-24 Sold (MLS) $342,490 realMLS
- 2022-02-04 Pending — realMLS
- 2022-02-03 Price Changed $345,990 realMLS
- 2022-02-03 Relisted — realMLS
- 2022-01-10 Pending — realMLS
- 2022-01-04 Listed $329,990 AINCAR
- 2022-01-04 Listed $329,990 realMLS
- 2021-11-05 Sold (Public Records) $905,398 Public Records
Property tax history
+77.4%/yrLatest (2025): $3,779 · +1.4% YoY. Source: county tax records.
Cash-flow waterfall
monthlySold comps — $/sqft
last 12 mo · ≤1 miLoading sold comps…