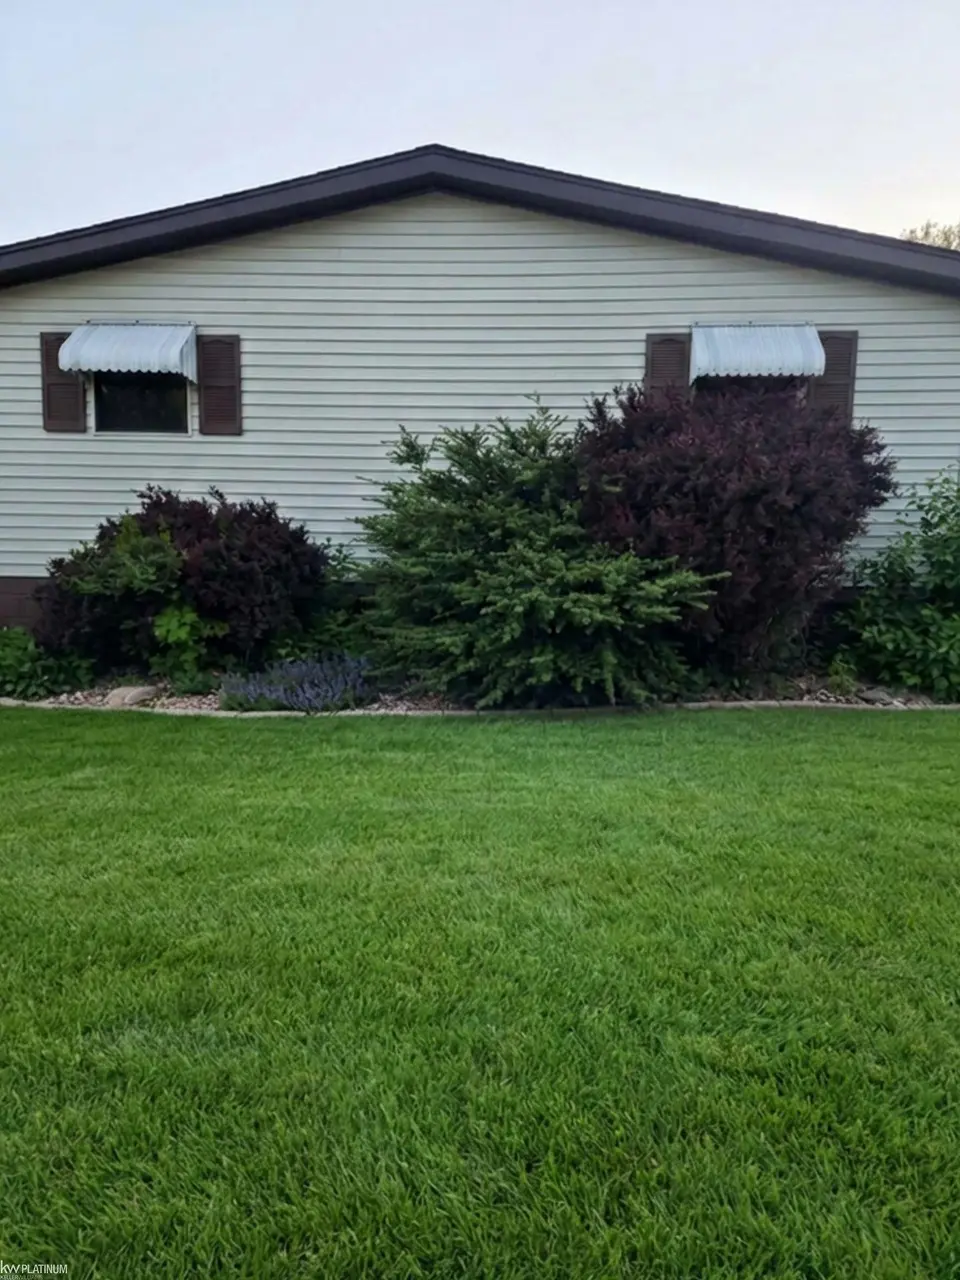
50091 Wensleydale Ct · Utica, MI
Flood risk 1/10 · Minimal
- FEMA flood zone
- X (unshaded)
- Chance of flooding over 30 yrs
- 0.0%
- Est. flood insurance / yr
- $473 – $860
Fire risk 1/10 · Minimal
- Est. fire insurance / yr
- $784 – $1,456
Heat risk 3/10 · Minor
- Hot days now (above 97°F)
- 7 days/yr
- Hot days in 30 yrs
- 15 days/yr
Wind risk 1/10 · Minimal
- Chance of severe wind over 30 yrs
- —
Air-quality risk 3/10 · Minor
- Unhealthy air days now
- 3 days/yr
- Unhealthy air days in 30 yrs
- 3 days/yr
Risk factors via First Street. Map © Google.
Why this score? — see what drove the B grade
The composite is a weighted blend of 9 inputs, each scored 0–100. Each bar is that input's sub-score; the figure is the points it added to the 100-point composite (weight × sub-score).
- Cash flow +30.0/30.0
- 1% rule +10.0/10.0
- DSCR +10.0/10.0
- ARV discount +7.5/15.0
- Schools +4.1/10.0
- Livability +3.9/5.0
- Rent growth +2.5/5.0
- Condition / age +2.5/5.0
- Appreciation +0.0/10.0
$45,000
🖨 Deal sheet (PDF) 📄 Offer letter ✓ Due diligence
Listing remarks MLS
WELCOME HOME TO AFFORDABLE LIVING IN BEAUTIFUL SHELBY TOWNSHIP! Opportunity is knocking with this spacious 1,800 sq. ft. home located on a quiet private cul-de-sac in one of Shelby Township’s sought-after communities! Step inside and fall in love with the bright open-concept layout featuring a spacious kitchen, dining, and living area — perfect for entertaining guests or enjoying cozy nights at home. The stunning stone fireplace creates a warm focal point, while the wet bar and large sunroom add extra charm and functionality you don’t often find at this price point. Home Features: 3 spacious bedrooms with double closets Open-concept living and dining area Beautiful stone fireplace Wet bar for entertaining Large relaxing sunroom New roof installed in 2024 4-car covered parking Built-in shed/storage area Affordable lot rent — only $700/month Community Amenities Include: Swimming Pool Fitness Center Clubhouse & Planned Activities Pet Friendly Community Playground Boat Storage RV Storage This home offers the perfect combination of space, comfort, affordability, and community living — all in a fantastic Shelby Township location. Your next chapter starts here… don’t let this one slip away!
Key facts
- Wet bar
- Large sunroom
- Stone fireplace
Tags
Property features AI
Finance
- Other: Located in the SHELBY FOREST subdivision
- HOA & community: Homeowners association with monthly fee
Exterior
- Utilities: Public sewer available
- Home design: Manufactured home; One level; Pillar/post/pier foundation
- Construction: Built area above grade: 1,800 square feet
- Exterior features: No pool
Interior
- Kitchen: Oven, Range, Refrigerator, Dishwasher not listed
- Bathrooms: 2 full bathrooms
- Heating & cooling: Forced air heating (natural gas); No central cooling
- Interior features: Dryer, Oven, Refrigerator, Range, Washer; 10 total rooms
- Laundry & utility: Washer and Dryer
Neighborhood map
What this means for you Summary
Snapshot
- This is a 3-bed/2.0-bath other listed at $45k.
Deal economics
- At list price, monthly cash flow is $1k ($14k/yr) — positive.
- The deal already cash-flows at list — no discount required.
- Meets the 1% rule at list price ($2k rent vs $45k).
- Recommended offer: $44k (1.5% below list) — sets the bar for market timing.
- Cap rate 37.3% vs local median 3.6% in Utica — top-decile yield for the area; either an underpriced asset or a hidden risk that comps aren't pricing in. Stress-test before assuming the spread holds.
Location & tenants
- Location reads 78/100 on livability (#106 in MI, #2,586 nationally) — a middle-class / working-renter tenant base. Strengths: commute A+, cost of living A+, housing A+; Watch: crime D+, health & safety D+, employment D.
- Utica Community Schools (suburban): math 38% / reading 53% proficiency, ranked #126 of 540 in MI (top 23%) — families likely to look elsewhere, expect single-tenant / working-renter base with shorter leases.
- Market conditions: 234 active listings in the ZIP; 3 comparable units currently listed for rent nearby; rentals at typical pace (median 16d on market — plan ~3-4 weeks tenant-placement turnaround); 1,321 units permitted in Macomb County in 2024 (86 in 5+ unit buildings).
Forward outlook
- Local home prices are declining (-3.0%/yr); year-one equity from $311 of loan paydown is wiped out by about $1k of value loss. Plan a longer hold.
- Macomb County population projected at +9% by 2050 — modest demand growth; plan on rents tracking national, not racing it.
- At projected returns (-3.0% appreciation + 3.0% rent growth), your $13k cash investment doubles in ~1 year — after that, you're playing with house money.
Negotiation context
- It's been on market 23 days — a 2% lower offer ($44k) is reasonable based on typical stale-listing flexibility.
- 2 sale attempts; this cycle's ask has dropped $5k (10%) from the opening price — seller is motivated, your offer sets the floor, not the list.
Questions for the listing agent
- Is there a deadline driving the sale (1031 exchange, divorce, estate, relocation)? That informs how much negotiation room exists.
- Crime grade is D in this area — have there been break-ins, vandalism, or insurance claims at this property in the last 3 years? What carrier currently insures it and at what premium?
- What's the average days-on-market for RENTAL listings here right now (not sales)? A rising rental-DOM trend means longer vacancies and softer asking-rent achievability than the comps imply.
- What's the recent tenant-quality profile in this submarket — average credit score on applications, eviction rate, late-payment / NSF rate, and stable-employment percentage? A property-management company in the area should have these aggregated.
- How much new for-sale + rental construction is in the pipeline within 1–3 miles? Heavy new supply typically softens prices + rents 12–24 months out; constrained supply supports both.
Investment metrics
- 1% rule
- 4.14% ✓
- Cap rate
- 37.28%
- Cash-on-cash
- 110.68%
- DSCR
- 5.92
- GRM
- 2.0
CMA / ARV
No comps found within radius.
Projected returns pro-forma
-3.0% appreciation · 3.0% rent growth · sell at horizon
- IRR
- —
- Equity multiple
- 6.30×
- Total profit
- $66,754
- Equity at exit
- $6,710
- IRR
- —
- Equity multiple
- 13.19×
- Total profit
- $153,553
- Equity at exit
- $3,891
Cash invested: $12,600 (down + closing). Projections, not guarantees.
Landlord ↔ Tenant lean methodology
- Overall (STATE)
- 62 Landlord-Friendly
- State Michigan
- 62 Landlord-Friendly · EVEN
- County
- — inherits STATE
- City
- — inherits STATE
ZIP-level market 48315
- Active inventory
- 234
- Price-to-rent
- 2.0×
Monthly cashflow live
- Estimated rent
- $1,865 medium interval (Pro) →
- Mortgage (P&I)
- −$236
- Tax est. 1.5%
- −$56 /mo · $675/yr
- Insurance
- −$19
- HOA
- −$0
- Vacancy / Maint / Mgmt
- −$392
- Net cashflow
- $1,162
Break-even live
Sensitivity live
| Price | -10% $1,193 | -5% $1,178 | +0% $1,162 | +5% $1,147 | +10% $1,131 |
|---|---|---|---|---|---|
| Rent | -10% $1,015 | -5% $1,088 | +0% $1,162 | +5% $1,236 | +10% $1,309 |
| Rate | -1.0pp $1,185 | -0.5pp $1,174 | base $1,162 | +0.5pp $1,150 | +1.0pp $1,139 |
UW: 25.0% down · 7.5% · 30yr · 1.5% tax · 5.0% vac · 8.0% maint · 8.0% mgmt
Financing live
Cash to close
- Down payment
- $11,250
- Closing costs
- $1,350
- Reserves months
- —
- Total cash needed
- —
Loan-product check · same deal, 3 products live
Conventional
25% down · 7.5% · 30yr
- Down + closing
- —
- Monthly P&I
- —
- Monthly cashflow
- —
- DSCR
- —
- Eligible?
- —
Personal DTI + credit; lowest rate.
DSCR
20% down · 8.5% · 30yr
- Down + closing
- —
- Monthly P&I
- —
- Monthly cashflow
- —
- DSCR
- —
- Eligible?
- —
No personal income docs; deal must DSCR.
Hard money
10% down · 12.0% · 12mo
- Down + closing
- —
- Monthly P&I
- —
- Monthly cashflow
- —
- DSCR
- —
- Eligible?
- —
Short-term bridge; refi at stabilization.
Rent comps 3 comps
| Address | Beds | Baths | Sqft | Rent | $/sqft | DOM | Units | Dist |
|---|---|---|---|---|---|---|---|---|
| 13955 Bronte Dr N Shelby Township, MI | 3.0 | 2.0 | 1380 | $1,799 | $1.30 | 11d | 1 | 0.12mi |
| 13670 Silver Birch Cir Shelby Township, MI | 2.0 | 2.0 | 1500 | $1,850 | $1.23 | 44d | 1 | 0.52mi |
| 51401 Times Square Dr Shelby Township, MI | 2.0–3.0 | 2.5–3.5 | 1400 | $2,275 | $1.62 | 15d | 8 | 0.73mi |
Listing history 15 events
-
2026-06-21days on market $45,000 Active 23 DOM
-
2026-06-18days on market $45,000 Active 20 DOM
-
2026-06-17days on market $45,000 Active 19 DOM
-
2026-06-16days on market $45,000 Active 18 DOM
-
2026-06-15days on market $45,000 Active 17 DOM
-
2026-06-13days on market $45,000 Active 15 DOM
-
2026-06-13pricedays on market $45,000 Active 14 DOM
-
2026-06-09days on market $49,999 Active 11 DOM
-
2026-06-08days on market $49,999 Active 10 DOM
-
2026-06-07days on market $49,999 Active 9 DOM
-
2026-06-04days on market $49,999 Active 6 DOM
-
2026-06-03days on market $49,999 Active 5 DOM
-
2026-06-02days on market $49,999 Active 4 DOM
-
2026-06-01days on market $49,999 Active 3 DOM
-
2026-05-31days on market $49,999 Active 2 DOM
ⓘ Source: listings_history table (triggers on properties + properties_extension) + one-shot
backfill from property_details.listing_events for pre-trigger history.
Climate risk First Street
- Flood 1/10 Low FEMA zone X (unshaded) · 0% chance over 30 yrs
- Wildfire 1/10 Low
- Heat 3/10 Moderate 7 d/yr ≥97°F today · 15 d/yr by 30 yrs out
- Wind 1/10 Low
- Air quality 3/10 Moderate 3 unhealthy d/yr today · 3 by 30 yrs out
Nearby sold comps map
Loading sold comps map…
Walkable amenities ~0.75 mi
Loading nearby amenities…
Taxation est. · year 1
- Rental income
- $22,377
- − Mortgage interest
- −$2,521
- − Property taxes
- −$675
- − Insurance
- −$225
- − Repairs & maintenance
- −$1,790
- − Management
- −$1,790
- − Depreciation
- −$1,309
- Taxable income
- $14,067
- Est. tax owed @ 24.0%
- −$3,376
- After-tax cash flow
- $10,570/yr
For passive investors: Depreciation is non-cash, so a rental often shows a tax loss while cash-flowing — sheltering income. Rental losses are passive: they offset passive income freely, and up to $25,000/yr can offset ordinary (W-2) income if you actively participate and your MAGI is under $100k (phasing out to $0 by $150k); unused losses carry forward. On sale, claimed depreciation is recaptured at up to 25%, and gains may owe capital-gains tax (a 1031 exchange can defer both). Figures are a year-1 estimate at your 24.0% rate — not tax advice; consult a CPA.
Schools (NCES district)
- District
- Utica Community Schools
- NCES district ID
- 2634470
- Math proficiency
- 38% ▼ -13.00%
- Reading proficiency
- 53% ▼ -7.00%
- Median HH income
- $65,953
- Composite
- 40.52/100
- National rank
- #3709
- State rank
- #126 of 540 in MI
Livability — Utica
- Score
- 78/100
- State rank
- #106
- US rank
- #2586
Category grades
Schools grade is shown separately in the Schools card above.
Census & demographics
- Population (ZIP)
- 28,428
Population outlook (Macomb County) Hauer SSP2
- Today (2025)
- 925,296 people
- By 2030
- 948,226 · +2.5%
- By 2040
- 983,961 · +6.3%
- By 2050
- 1,010,200 · +9.2%
- By 2075
- 1,076,222 · +16.3%
- By 2100
- 1,077,065 · +16.4%
Race, ethnicity, and origin ACS 2023
- Neighborhood character
- Predominantly White (86%)
- Race & ethnicity
- White 86% Two or more races 4% Asian 4% Hispanic / Latino 3% Black 3%
- Common ancestry
- Romanian 11% Lithuanian 4% Italian 2%
- Foreign-born
- 14% · Canada, South Korea, China
- Languages at home
- 81% English-only · Other Indo-European 9% Arabic 4% Spanish 2%
Political lean MEDSL · Macomb
- 2024 margin
- R (+13.7) · D 42.2% · R 55.9% · Other 1.9%
- 2008→2024 swing
- -22.3pp toward R · 2008: 8.6pp · 2024: -13.7pp
- All cycles
- 2024: R+13.7 2020: R+8.1 2016: R+11.6 2012: D+4.0 2008: D+8.6
Not yet ingested
- Civics
- —
Market trends
- HPI YoY
- ▼ -173.36%
- Current HPI
- 194.9368
- Rent YoY
- —
- Metro
- —
- State GDP YoY
- ▲ 1.37%
- F500 in state
- 28
Industry mix (Fortune 500 HQ in MI)
| Industry | F500 HQs | Revenue |
|---|---|---|
| Automotive Parts | 3 | $48B |
|
||
| Automotive | 2 | $372B |
|
||
| Chemicals | 1 | $45B |
|
||
| Automotive Retail | 1 | $29B |
|
||
| Healthcare / Medical Devices | 1 | $23B |
|
||
| Automotive Technology | 1 | $20B |
|
||
Price history
+0.0% since first listed2 events — show timeline
- 2026-05-29 Listed $49,999 REALCOMP
- 2026-05-29 Listed $49,999 MiRealSource-MiMLS
Property tax history
+0.8%/yrLatest (2024): $88 · +42.7% YoY. Source: county tax records.
Cash-flow waterfall
monthlySold comps — $/sqft
last 12 mo · ≤1 miLoading sold comps…