307 8th St #7 · Sultan, WA
Flood risk No data
- FEMA flood zone
- —
- Chance of flooding over 30 yrs
- —
- Est. flood insurance / yr
- —
Fire risk No data
- Est. fire insurance / yr
- —
Heat risk No data
- Hot days now (above threshold)
- —
- Hot days in 30 yrs
- —
Wind risk No data
- Chance of severe wind over 30 yrs
- —
Air-quality risk No data
- Unhealthy air days now
- —
- Unhealthy air days in 30 yrs
- —
Risk factors via First Street. Map © Google.
Why this score? — see what drove the B- grade
The composite is a weighted blend of 9 inputs, each scored 0–100. Each bar is that input's sub-score; the figure is the points it added to the 100-point composite (weight × sub-score).
- Cash flow +27.6/30.0
- ARV discount +9.8/15.0
- DSCR +9.7/10.0
- 1% rule +6.4/10.0
- Schools +4.5/10.0
- Livability +3.7/5.0
- Rent growth +2.5/5.0
- Condition / age +2.5/5.0
- Appreciation +0.0/10.0
$265,000
🖨 Deal sheet 📄 Offer letter ✓ Due diligence
Listing remarks
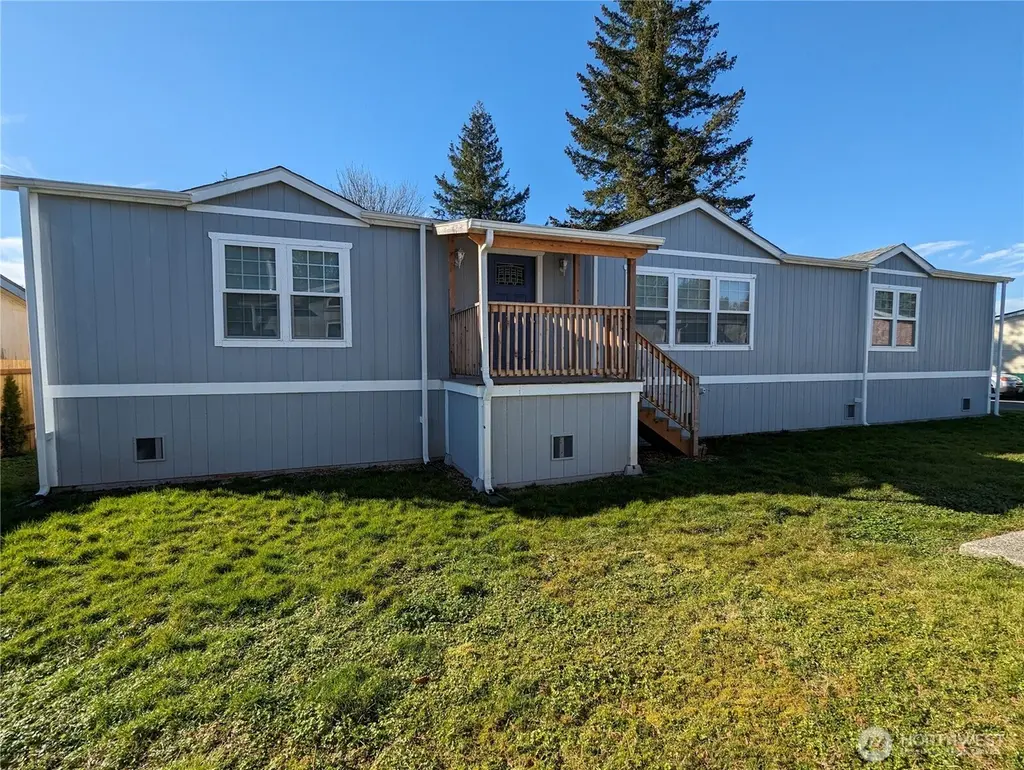
TOTALLY REMODELED. Beautiful large 3 bed room 2 bath manufactured home with mountain views in Timberline Village. Country living and still short distance to major cities. Ski, fishing and hiking areas are close by and the home is not at a high elevation where snow is a problem. Large island kitchen with lots of new cabinets and pantry. Separate dining room and living room. Large bedrooms with walk-in closets. Cathedral ceilings throughout, laundry room with new cabinets, new porches and awnings and new skirting that matches the home. New large shower and linen closet in master bath. New windows throughout and new roof. New carpet and vinyl.
Key facts
- Island kitchen
- Separate dining room
- Cathedral ceilings
Tags
Neighborhood map
What this means for you Summary
Snapshot
- This is a 3-bed/2.0-bath manufactured listed at $265k.
Deal economics
- At list price, monthly cash flow is $794 ($10k/yr) — positive.
- The deal already cash-flows at list — no discount required.
- Meets the 1% rule at list price ($3k rent vs $265k).
- Recommended offer: $233k (12.0% below list) — sets the bar for market timing.
- Cap rate 9.9% vs local median 3.0% in Sultan — top-decile yield for the area; either an underpriced asset or a hidden risk that comps aren't pricing in. Stress-test before assuming the spread holds.
Location & tenants
- Location reads 74/100 on livability (#183 in WA, #4,863 nationally) — a middle-class / working-renter tenant base. Strengths: housing A+, crime A, employment A; Watch: cost of living D+, amenities F, health & safety F.
- Sultan School District (town): math 42% / reading 56% proficiency, ranked #143 of 291 in WA (top 49%) — families likely to look elsewhere, expect single-tenant / working-renter base with shorter leases.
- Market conditions: 103 active listings in the ZIP; 7 comparable units currently listed for rent nearby; rentals at typical pace (median 17d on market — plan ~3-4 weeks tenant-placement turnaround); 3,982 units permitted in Snohomish County in 2024 (1,492 in 5+ unit buildings).
Forward outlook
- Local home prices are declining (-3.0%/yr); year-one equity from $2k of loan paydown is wiped out by about $8k of value loss. Plan a longer hold.
- Snohomish County population projected at +30% by 2050 — long-run rental-demand tailwind backs the buy-and-hold thesis.
- At projected returns (-3.0% appreciation + 3.0% rent growth), your $74k cash investment doubles in ~9 years — after that, you're playing with house money.
Negotiation context
- It's been on market 132 days — a 12% lower offer ($233k) is reasonable based on typical stale-listing flexibility.
Questions for the listing agent
- It's been on market 132 days. Have you received any prior offers? Is the seller open to a 12% concession, seller financing, or rate buy-down credit?
- Why hasn't it sold? Are there any deal-killer items the seller is aware of (foundation, flood, title, zoning, code violations)?
- Is there a deadline driving the sale (1031 exchange, divorce, estate, relocation)? That informs how much negotiation room exists.
- Schools are B-rated — typically a magnet for longer-tenancy family renters. What's the average tenant stay here, and is there a school-zone premium baked into asking?
- What's the average days-on-market for RENTAL listings here right now (not sales)? A rising rental-DOM trend means longer vacancies and softer asking-rent achievability than the comps imply.
- What's the recent tenant-quality profile in this submarket — average credit score on applications, eviction rate, late-payment / NSF rate, and stable-employment percentage? A property-management company in the area should have these aggregated.
- How much new for-sale + rental construction is in the pipeline within 1–3 miles? Heavy new supply typically softens prices + rents 12–24 months out; constrained supply supports both.
Investment metrics
- 1% rule
- 1.14% ✓
- Cap rate
- 9.89%
- Cash-on-cash
- 12.85%
- DSCR
- 1.57
- GRM
- 7.3
CMA / ARV
- ARV (median comp)
- $279,404
- List price
- $265,000
- Delta
- -5.16%
- Verdict
- FAIR
- Comps
- 8 within 2.0 mi
Projected returns pro-forma
-3.0% appreciation · 3.0% rent growth · sell at horizon
- IRR
- 2.6%
- Equity multiple
- 1.10×
- Total profit
- $7,548
- Equity at exit
- $39,512
- IRR
- 12.2%
- Equity multiple
- 1.96×
- Total profit
- $71,312
- Equity at exit
- $22,912
Cash invested: $74,200 (down + closing). Projections, not guarantees.
Landlord ↔ Tenant lean methodology
- Overall (STATE)
- 28 Tenant-Leaning
- State Washington
- 28 Tenant-Leaning · D+8
- County
- — inherits STATE
- City
- — inherits STATE
ZIP-level market 98294
- Home prices YoY
- -26.4%
- Active inventory
- 103
- Price-to-rent
- 7.3×
Monthly cashflow live
- Estimated rent
- $3,026 high interval (Pro) →
- Mortgage (P&I)
- −$1,390
- Tax from tax record
- −$96 /mo · $1,157/yr
- Insurance
- −$110
- HOA
- −$0
- Vacancy / Maint / Mgmt
- −$636
- Net cashflow
- $794
Break-even live
UW: 25.0% down · 7.5% · 30yr · 1.5% tax · 5.0% vac · 8.0% maint · 8.0% mgmt
Financing live
Cash to close
- Down payment
- $66,250
- Closing costs
- $7,950
- Reserves months
- —
- Total cash needed
- —
Loan-product check · same deal, 3 products live
Conventional
25% down · 7.5% · 30yr
- Down + closing
- —
- Monthly P&I
- —
- Monthly cashflow
- —
- DSCR
- —
- Eligible?
- —
Personal DTI + credit; lowest rate.
DSCR
20% down · 8.5% · 30yr
- Down + closing
- —
- Monthly P&I
- —
- Monthly cashflow
- —
- DSCR
- —
- Eligible?
- —
No personal income docs; deal must DSCR.
Hard money
10% down · 12.0% · 12mo
- Down + closing
- —
- Monthly P&I
- —
- Monthly cashflow
- —
- DSCR
- —
- Eligible?
- —
Short-term bridge; refi at stabilization.
Rent comps 7 comps
| Address | Beds | Baths | Sqft | Rent | $/sqft | DOM | Units | Dist |
|---|---|---|---|---|---|---|---|---|
| 200 Whispering Pine Pl Sultan, WA | 3.0 | 2.5 | 1428 | $2,750 | $1.93 | 43d | 1 | 0.71mi |
| 13401 324th Ave SE Sultan, WA | 3.0 | 2.5 | 1535 | $2,750 | $1.79 | 10d | 1 | 1.06mi |
| 1521 10th Pl Sultan, WA | 4.0 | 2.5 | 2501 | $3,500 | $1.40 | 17d | 1 | 1.12mi |
| 1521 10th Pl #157 Sultan, WA | 4.0 | 2.5 | 2501 | $3,500 | $1.40 | 21d | 1 | 1.12mi |
| 13343 325th Ave SE Sultan, WA | 3.0 | 3.0 | 1880 | $2,995 | $1.59 | 1d | 1 | 1.13mi |
| 1005 17th Ave Sultan, WA | 4.0 | 2.5 | 2438 | $3,000 | $1.23 | 14d | 1 | 1.15mi |
| 1715 Gohr Rd Sultan, WA | 4.0 | 3.0 | 1847 | $3,000 | $1.62 | 43d | 1 | 1.17mi |
Listing history 16 events
-
2026-06-18days on market $265,000 Active 132 DOM
-
2026-06-17days on market $265,000 Active 131 DOM
-
2026-06-16days on market $265,000 Active 130 DOM
-
2026-06-15days on market $265,000 Active 129 DOM
-
2026-06-13days on market $265,000 Active 127 DOM
-
2026-06-13days on market $265,000 Active 126 DOM
-
2026-06-09days on market $265,000 Active 123 DOM
-
2026-06-08days on market $265,000 Active 122 DOM
-
2026-06-07days on market $265,000 Active 121 DOM
-
2026-06-04days on market $265,000 Active 118 DOM
-
2026-06-03days on market $265,000 Active 117 DOM
-
2026-06-02days on market $265,000 Active 116 DOM
-
2026-06-01days on market $265,000 Active 115 DOM
-
2026-05-31days on market $265,000 Active 114 DOM
-
2026-02-28price $265,000
-
2026-02-05$275,000 Active
ⓘ Source: listings_history table (triggers on properties + properties_extension) + one-shot
backfill from property_details.listing_events for pre-trigger history.
Tax reassessment forecast WA · Resets to sale price
- Current annual tax
- $1,157 · $96/mo
- Projected year-2 tax
- $2,597 · $216/mo
- Expected delta
- +$1,440/yr (+$120/mo · 124.5%)
ⓘ Screening estimate from a state-policy table — verify with the county assessor before closing.
Nearby sold comps map
Loading sold comps map…
Walkable amenities ~0.75 mi
Loading nearby amenities…
Taxation est. · year 1
- Rental income
- $36,316
- − Mortgage interest
- −$14,844
- − Property taxes
- −$1,157
- − Insurance
- −$1,325
- − Repairs & maintenance
- −$2,905
- − Management
- −$2,905
- − Depreciation
- −$7,709
- Taxable income
- $5,470
- Est. tax owed @ 24.0%
- −$1,313
- After-tax cash flow
- $8,219/yr
For passive investors: Depreciation is non-cash, so a rental often shows a tax loss while cash-flowing — sheltering income. Rental losses are passive: they offset passive income freely, and up to $25,000/yr can offset ordinary (W-2) income if you actively participate and your MAGI is under $100k (phasing out to $0 by $150k); unused losses carry forward. On sale, claimed depreciation is recaptured at up to 25%, and gains may owe capital-gains tax (a 1031 exchange can defer both). Figures are a year-1 estimate at your 24.0% rate — not tax advice; consult a CPA.
Schools (NCES district)
- District
- Sultan School District
- NCES district ID
- 5308550
- Math proficiency
- 42% ▬ 0.00%
- Reading proficiency
- 56% ▲ 3.00%
- Median HH income
- $63,955
- Composite
- 45.32/100
- National rank
- #5739
- State rank
- #143 of 291 in WA
Livability — Sultan
- Score
- 74/100
- State rank
- #183
- US rank
- #4863
Category grades
Schools grade is shown separately in the Schools card above.
Census & demographics
- Census place
- Sultan, WA
- Population (ZIP)
- 7,838
Population outlook (Snohomish County) Hauer SSP2
- Today (2025)
- 899,800 people
- By 2030
- 960,975 · +6.8%
- By 2040
- 1,074,447 · +19.4%
- By 2050
- 1,171,954 · +30.2%
- By 2075
- 1,384,849 · +53.9%
- By 2100
- 1,497,296 · +66.4%
Race, ethnicity, and origin ACS 2023
- Neighborhood character
- Predominantly White (67%)
- Race & ethnicity
- White 67% Hispanic / Latino 17% Two or more races 14% Asian 8% Native American 3% Black 1%
- Hispanic origin (detail)
- Mexican 10%
- Common ancestry
- Portuguese 7% Slovak 6% Italian 2%
- Foreign-born
- 21% · Canada, Vietnam
- Languages at home
- 79% English-only · Spanish 15% Other Asian/Pacific 4% Vietnamese 1%
Political lean MEDSL · Snohomish
- 2024 margin
- D (+19.0) · D 57.8% · R 38.9% · Other 3.3%
- 2008→2024 swing
- +0.1pp no change · 2008: 18.9pp · 2024: 19.0pp
- All cycles
- 2024: D+19.0 2020: D+20.6 2016: D+16.6 2012: D+16.2 2008: D+18.9
Not yet ingested
- Civics
- —
Market trends
- HPI YoY
- ▼ -99.36%
- Current HPI
- 277.4099
- Rent YoY
- —
- Metro
- —
- State GDP YoY
- ▲ 4.65%
- F500 in state
- 22
Industry mix (Fortune 500 HQ in WA)
| Industry | F500 HQs | Revenue |
|---|---|---|
| Retail | 2 | $269B |
|
||
| Technology / Retail | 1 | $638B |
|
||
| Technology | 1 | $245B |
|
||
| Telecommunications | 1 | $38B |
|
||
| Food / Beverage | 1 | $36B |
|
||
| Automotive / Trucks | 1 | $34B |
|
||
Price history
-3.6% since first listed2 events — show timeline
- 2026-02-28 Price Changed $265,000 NWMLS as Distributed by MLS Grid
- 2026-02-05 Listed $275,000 NWMLS as Distributed by MLS Grid
Property tax history
+8.7%/yrLatest (2026): $1,157 · +4.0% YoY. Source: county tax records.
Cash-flow waterfall
monthlySold comps — $/sqft
last 12 mo · ≤1 miLoading sold comps…