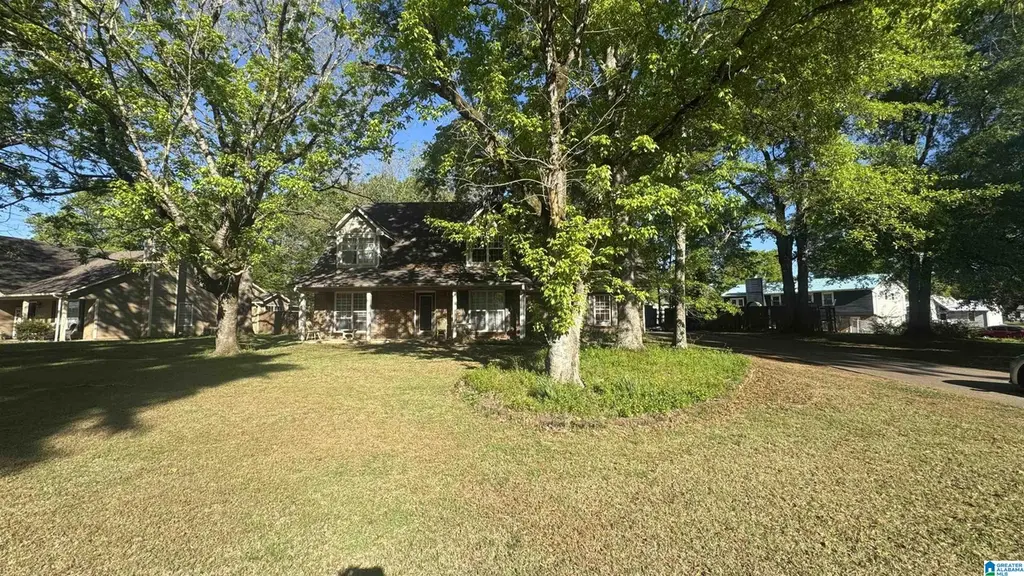
902 10th St SW · Alabaster, AL
Flood risk 1/10 · Minimal
- FEMA flood zone
- X (unshaded)
- Chance of flooding over 30 yrs
- 0.0%
- Est. flood insurance / yr
- $507 – $1,088
Fire risk 3/10 · Minor
- Est. fire insurance / yr
- $916 – $1,700
Heat risk 6/10 · Moderate
- Hot days now (above 106°F)
- 7 days/yr
- Hot days in 30 yrs
- 19 days/yr
Wind risk 6/10 · Moderate
- Chance of severe wind over 30 yrs
- 46.0%
Air-quality risk 2/10 · Minimal
- Unhealthy air days now
- 2 days/yr
- Unhealthy air days in 30 yrs
- 2 days/yr
Risk factors via First Street. Map © Google.
Why this score? — see what drove the C- grade
The composite is a weighted blend of 9 inputs, each scored 0–100. Each bar is that input's sub-score; the figure is the points it added to the 100-point composite (weight × sub-score).
- Cash flow +16.5/30.0
- ARV discount +15.0/15.0
- DSCR +5.1/10.0
- Schools +3.9/10.0
- Livability +3.8/5.0
- 1% rule +3.6/10.0
- Rent growth +3.0/5.0
- Condition / age +2.5/5.0
- Appreciation +0.0/10.0
$219,000
🖨 Deal sheet (PDF) 📄 Offer letter ✓ Due diligence
Listing remarks MLS
Beautiful Single Family Home located in Alabaster. Offering a three bed and three Bath two story home 1,885 Sq Ft and As-Is. Needs new HVAC unit.
Key facts
- 0.35 acre lot
- Garage
- Built 1996
Neighborhood map
What this means for you Summary
Snapshot
- This is a 3-bed/2.0-bath single-family listed at $219k.
Deal economics
- At list price, monthly cash flow is $127 ($2k/yr) — positive.
- The deal already cash-flows at list — no discount required.
- To meet the 1% rule (rent ≥ 1% of price), the offer needs to be $187k (14.5% below list).
- Recommended offer: $187k (14.5% below list) — sets the bar for 1% rule.
- Cap rate 7.0% vs local median 4.1% in Alabaster — top-decile yield for the area; either an underpriced asset or a hidden risk that comps aren't pricing in. Stress-test before assuming the spread holds.
Location & tenants
- Location reads 76/100 on livability (#14 in AL, #3,512 nationally) — a middle-class / working-renter tenant base. Strengths: employment A+, cost of living A+, housing A+; Watch: amenities D-, commute F, health & safety F.
- Alabaster City (suburban): math 30% / reading 57% proficiency, ranked #17 of 129 in AL (top 13%) — families likely to look elsewhere, expect single-tenant / working-renter base with shorter leases.
- Market conditions: Rents rising (+2.2%/yr); 226 active listings in the ZIP; 6 comparable units currently listed for rent nearby; rentals at typical pace (median 20d on market — plan ~3-4 weeks tenant-placement turnaround); solid renter incomes; 987 units permitted in Shelby County in 2024 (0 in 5+ unit buildings).
Forward outlook
- Local home prices are declining (-3.0%/yr); year-one equity from $2k of loan paydown is wiped out by about $7k of value loss. Plan a longer hold.
- Shelby County population projected at +23% by 2050 — long-run rental-demand tailwind backs the buy-and-hold thesis.
Negotiation context
- It's been on market 56 days — a 3% lower offer ($212k) is reasonable based on typical stale-listing flexibility.
Risks & watch-outs
- Climate carrying-cost: major wind risk, 46% chance of damaging wind over 30y; extreme-heat days projected 7→19/yr by 2055 (HVAC capex compounding) — expect insurance premiums to compound above CPI over the hold.
Questions for the listing agent
- It's been on market 56 days. Have you received any prior offers? Is the seller open to a 14% concession, seller financing, or rate buy-down credit?
- Is there a deadline driving the sale (1031 exchange, divorce, estate, relocation)? That informs how much negotiation room exists.
- Schools are B-rated — typically a magnet for longer-tenancy family renters. What's the average tenant stay here, and is there a school-zone premium baked into asking?
- What's the average days-on-market for RENTAL listings here right now (not sales)? A rising rental-DOM trend means longer vacancies and softer asking-rent achievability than the comps imply.
- What's the recent tenant-quality profile in this submarket — average credit score on applications, eviction rate, late-payment / NSF rate, and stable-employment percentage? A property-management company in the area should have these aggregated.
- How much new for-sale + rental construction is in the pipeline within 1–3 miles? Heavy new supply typically softens prices + rents 12–24 months out; constrained supply supports both.
Investment metrics
- 1% rule
- 0.86% ✗
- Cap rate
- 6.99%
- Cash-on-cash
- 2.49%
- DSCR
- 1.11
- GRM
- 9.7
CMA / ARV
- ARV (median comp)
- $293,779
- List price
- $219,000
- Delta
- -25.45%
- Verdict
- UNDERPRICED
- Comps
- 20 within 1.0 mi
Show comp detail 12 sales within ~0.75 mi
| Address | Dist | Beds/Ba | Sqft | Sold | Price | $/sf | Match |
|---|---|---|---|---|---|---|---|
| 104 Oakbrooke Ln | 0.11mi | 3/2.0 | 1,638 (-13%) | 1mo | $309,900 | $189 | 72 |
| 921 10th St SW | 0.27mi | 4/2.0 (+1) | 1,833 (-3%) | 8mo | $280,000 | $153 | 71 |
| 100 Bluegrass Dr | 0.34mi | 4/2.0 (+1) | 1,985 (+5%) | 0mo | $295,000 | $149 | 70 |
| 1230 SW 8th Ave | 0.32mi | 3/2.0 | 1,680 (-11%) | 7mo | $294,900 | $176 | 61 |
| 1307 3rd Ave SW | 0.60mi | 4/2.5 (+1) | 1,862 (-1%) | 3mo | $235,000 | $126 | 60 |
| 902 6th Ave SW | 0.33mi | 3/2.5 | 1,628 (-14%) | 4mo | $375,000 | $230 | 57 |
| 112 Summer Hill Dr | 0.48mi | 3/2.0 | 2,060 (+9%) | 7mo | $150,000 | $73 | 56 |
| 204 Shalimar Cir | 0.54mi | 3/2.5 | 1,754 (-7%) | 8mo | $299,900 | $171 | 54 |
| 113 Summer Hill Dr | 0.47mi | 4/2.0 (+1) | 2,133 (+13%) | 0mo | $316,000 | $148 | 51 |
| 235 Summer Hill Dr | 0.46mi | 4/2.0 (+1) | 2,133 (+13%) | 1mo | $310,000 | $145 | 51 |
| 167 Pebble Dr | 0.53mi | 3/2.0 | 2,166 (+15%) | 1mo | $279,900 | $129 | 49 |
| 121 Pebble Dr | 0.57mi | 3/2.5 | 1,628 (-14%) | 0mo | $315,000 | $193 | 48 |
Match score weights: distance 35% · size 25% · config 20% · recency 20%. Top-matched comps best support the ARV.
Projected returns pro-forma
-3.0% appreciation · 2.16% rent growth · sell at horizon
- IRR
- -13.3%
- Equity multiple
- 0.53×
- Total profit
- $-29,029
- Equity at exit
- $32,654
- IRR
- -5.6%
- Equity multiple
- 0.65×
- Total profit
- $-21,471
- Equity at exit
- $18,935
Cash invested: $61,320 (down + closing). Projections, not guarantees.
Landlord ↔ Tenant lean methodology
- Overall (STATE)
- 90 Strongly Landlord-Friendly
- State Alabama
- 90 Strongly Landlord-Friendly · R+15
- County
- — inherits STATE
- City
- — inherits STATE
ZIP-level market 35007
- Home prices YoY
- -35.0%
- Rents YoY
- 2.2%
- Active inventory
- 226
- Price-to-rent
- 9.7×
Monthly cashflow live
- Estimated rent
- $1,874 high interval (Pro) →
- Mortgage (P&I)
- −$1,148
- Tax from tax record
- −$113 /mo · $1,359/yr
- Insurance
- −$91
- HOA
- −$0
- Vacancy / Maint / Mgmt
- −$393
- Net cashflow
- $127
Break-even live
Sensitivity live
| Price | -10% $251 | -5% $189 | +0% $127 | +5% $65 | +10% $3 |
|---|---|---|---|---|---|
| Rent | -10% $-21 | -5% $53 | +0% $127 | +5% $201 | +10% $275 |
| Rate | -1.0pp $237 | -0.5pp $183 | base $127 | +0.5pp $70 | +1.0pp $13 |
UW: 25.0% down · 7.5% · 30yr · 1.5% tax · 5.0% vac · 8.0% maint · 8.0% mgmt
Financing live
Cash to close
- Down payment
- $54,750
- Closing costs
- $6,570
- Reserves months
- —
- Total cash needed
- —
Loan-product check · same deal, 3 products live
Conventional
25% down · 7.5% · 30yr
- Down + closing
- —
- Monthly P&I
- —
- Monthly cashflow
- —
- DSCR
- —
- Eligible?
- —
Personal DTI + credit; lowest rate.
DSCR
20% down · 8.5% · 30yr
- Down + closing
- —
- Monthly P&I
- —
- Monthly cashflow
- —
- DSCR
- —
- Eligible?
- —
No personal income docs; deal must DSCR.
Hard money
10% down · 12.0% · 12mo
- Down + closing
- —
- Monthly P&I
- —
- Monthly cashflow
- —
- DSCR
- —
- Eligible?
- —
Short-term bridge; refi at stabilization.
Rent comps 6 comps
| Address | Beds | Baths | Sqft | Rent | $/sqft | DOM | Units | Dist |
|---|---|---|---|---|---|---|---|---|
| 200 Summer Hill Dr Alabaster, AL | 3.0 | 2.0 | 1950 | $1,686 | $0.86 | 15d | 1 | 0.41mi |
| 203 Winterhaven Dr Alabaster, AL | 3.0 | 2.0 | 1431 | $1,550 | $1.08 | 4d | 1 | 0.60mi |
| 1090 Thompson Rd Alabaster, AL | 3.0 | 2.5 | 1615 | $1,600 | $0.99 | 44d | 1 | 0.75mi |
| 955 3rd Ave NW Alabaster, AL | 3.0 | 2.0 | 1363 | $1,875 | $1.38 | 4d | 1 | 0.82mi |
| 910 Falling Star Ln Alabaster, AL | 3.0 | 2.5 | 2010 | $1,800 | $0.90 | 20d | 1 | 1.27mi |
| 213 Queens Gate Maylene, AL | 3.0 | 2.0 | 1449 | $1,846 | $1.27 | 44d | 1 | 1.32mi |
Listing history 9 events
-
2026-06-09days on market $219,000 Active 56 DOM
-
2026-06-08days on market $219,000 Active 55 DOM
-
2026-06-07days on market $219,000 Active 54 DOM
-
2026-06-03days on market $219,000 Active 50 DOM
-
2026-06-02pricedays on market $219,000 Active 49 DOM
-
2026-06-01days on market $229,900 Active 48 DOM
-
2026-05-31days on market $229,900 Active 47 DOM
-
2026-04-22price $229,900 145-char remark
Show marketing remark (145 chars)
Beautiful Single Family Home located in Alabaster. Offering a three bed and three Bath two story home 1,885 Sq Ft and As-Is. Needs new HVAC unit.
-
2026-04-14$239,900 Active 145-char remark
Show marketing remark (145 chars)
Beautiful Single Family Home located in Alabaster. Offering a three bed and three Bath two story home 1,885 Sq Ft and As-Is. Needs new HVAC unit.
ⓘ Source: listings_history table (triggers on properties + properties_extension) + one-shot
backfill from property_details.listing_events for pre-trigger history.
Tax reassessment forecast AL · Resets to sale price
- Current annual tax
- $1,359 · $113/mo
- Projected year-2 tax
- $1,359 · $113/mo
- Expected delta
- $0/yr ($0/mo · 0.0%)
ⓘ Screening estimate from a state-policy table — verify with the county assessor before closing.
Climate risk First Street
- Flood 1/10 Low FEMA zone X (unshaded) · 0% chance over 30 yrs
- Wildfire 3/10 Moderate
- Heat 6/10 Major 7 d/yr ≥106°F today · 19 d/yr by 30 yrs out
- Wind 6/10 Major 46% chance of damaging wind over 30 yrs
- Air quality 2/10 Low 2 unhealthy d/yr today · 2 by 30 yrs out
Nearby sold comps map
Loading sold comps map…
Walkable amenities ~0.75 mi
Loading nearby amenities…
Taxation est. · year 1
- Rental income
- $22,482
- − Mortgage interest
- −$12,267
- − Property taxes
- −$1,359
- − Insurance
- −$1,095
- − Repairs & maintenance
- −$1,799
- − Management
- −$1,799
- − Depreciation
- −$6,371
- Taxable loss
- −$2,207
- Est. tax savings @ 24.0%
- +$530
- After-tax cash flow
- $2,056/yr
For passive investors: Depreciation is non-cash, so a rental often shows a tax loss while cash-flowing — sheltering income. Rental losses are passive: they offset passive income freely, and up to $25,000/yr can offset ordinary (W-2) income if you actively participate and your MAGI is under $100k (phasing out to $0 by $150k); unused losses carry forward. On sale, claimed depreciation is recaptured at up to 25%, and gains may owe capital-gains tax (a 1031 exchange can defer both). Figures are a year-1 estimate at your 24.0% rate — not tax advice; consult a CPA.
Schools (NCES district)
- District
- Alabaster City
- NCES district ID
- 0100190
- Math proficiency
- 30% ▼ -27.00%
- Reading proficiency
- 57% ▲ 5.00%
- Median HH income
- $68,690
- Composite
- 39.07/100
- National rank
- #4052
- State rank
- #17 of 129 in AL
Livability — Alabaster
- Score
- 76/100
- State rank
- #14
- US rank
- #3512
Category grades
Schools grade is shown separately in the Schools card above.
Census & demographics
- Census place
- Alabaster, AL
- County
- Shelby County · 188,970 people
- City population
- 28,586
- Metro
- Birmingham-Hoover, AL
- Population (ZIP)
- 28,586
- Household income
- $88,505
- Rent vs Own
- Severe rent burden
- 325.0
Population outlook (Shelby County) Hauer SSP2
- Today (2025)
- 237,024 people
- By 2030
- 249,868 · +5.4%
- By 2040
- 272,778 · +15.1%
- By 2050
- 291,062 · +22.8%
- By 2075
- 326,049 · +37.6%
- By 2100
- 335,870 · +41.7%
Race, ethnicity, and origin ACS 2023
- Neighborhood character
- Predominantly White (69%)
- Race & ethnicity
- White 69% Black 14% Hispanic / Latino 13% Two or more races 6% Asian 2%
- Hispanic origin (detail)
- Mexican 6% Cuban 1%
- Common ancestry
- Italian 3% Serbian 2% Lithuanian 1%
- Foreign-born
- 6% · Canada, China
- Languages at home
- 90% English-only · Spanish 8% Chinese 1%
Political lean MEDSL · Shelby
- 2024 margin
- Solid R (+40.9) · D 29.0% · R 69.9% · Other 1.1%
- 2008→2024 swing
- +12.6pp toward D · 2008: -53.4pp · 2024: -40.9pp
- All cycles
- 2024: R+40.9 2020: R+40.4 2016: R+50.3 2012: R+55.6 2008: R+53.4
Not yet ingested
- Civics
- —
Market trends
- HPI YoY
- ▼ -113.63%
- Current HPI
- 211.0691
- Rent YoY
- ▲ 2.16%
- Metro
- Birmingham-Hoover, AL
- State GDP YoY
- ▲ 2.94%
- F500 in state
- 4
Industry mix (Fortune 500 HQ in AL)
| Industry | F500 HQs | Revenue |
|---|---|---|
| Financial Services | 1 | $8B |
|
||
| Healthcare | 1 | $5B |
|
||
Price history
-4.2% since first listed2 events — show timeline
- 2026-04-22 Price Changed $229,900 Greater Alabama MLS
- 2026-04-14 Listed $239,900 Greater Alabama MLS
Property tax history
+5.1%/yrLatest (2025): $1,359 · +1.4% YoY. Source: county tax records.
Cash-flow waterfall
monthlySold comps — $/sqft
last 12 mo · ≤1 miLoading sold comps…