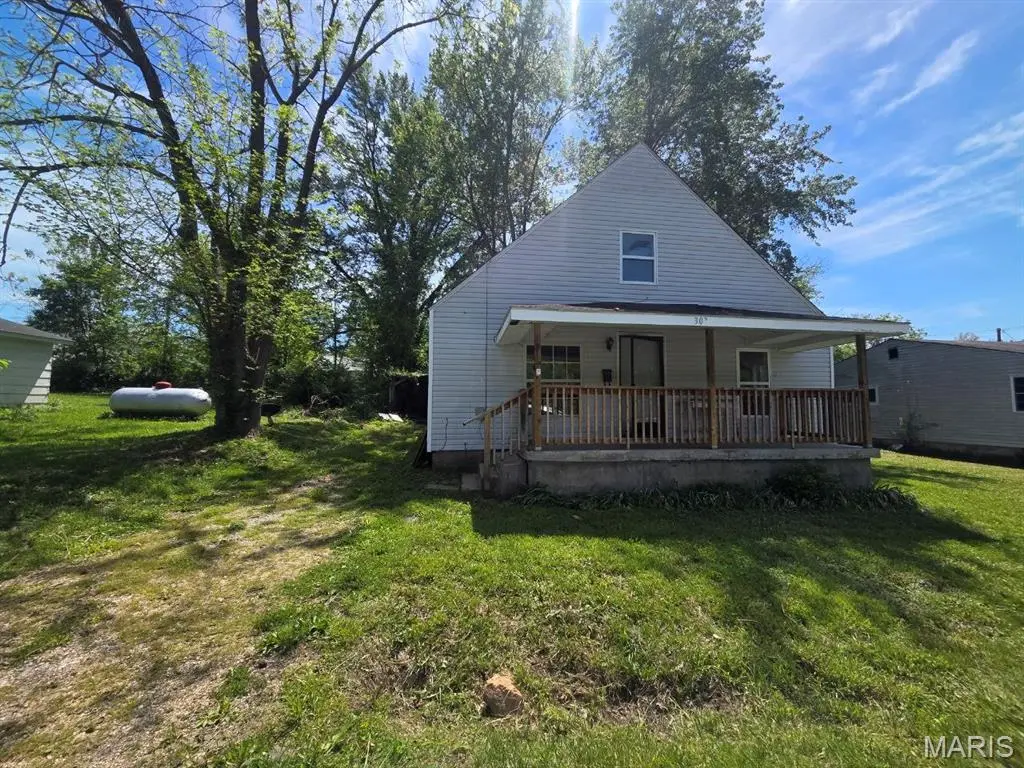
303 W 9th St · Salem, MO
Flood risk No data
- FEMA flood zone
- —
- Chance of flooding over 30 yrs
- —
- Est. flood insurance / yr
- —
Fire risk No data
- Est. fire insurance / yr
- —
Heat risk No data
- Hot days now (above threshold)
- —
- Hot days in 30 yrs
- —
Wind risk No data
- Chance of severe wind over 30 yrs
- —
Air-quality risk No data
- Unhealthy air days now
- —
- Unhealthy air days in 30 yrs
- —
Risk factors via First Street. Map © Google.
Why this score? — see what drove the B grade
The composite is a weighted blend of 9 inputs, each scored 0–100. Each bar is that input's sub-score; the figure is the points it added to the 100-point composite (weight × sub-score).
- Cash flow +26.1/30.0
- ARV discount +15.0/15.0
- DSCR +8.8/10.0
- Appreciation +7.8/10.0
- 1% rule +5.7/10.0
- Livability +3.5/5.0
- Schools +2.7/10.0
- Rent growth +2.5/5.0
- Condition / age +2.5/5.0
$79,000
🖨 Deal sheet 📄 Offer letter ✓ Due diligence
Listing remarks
Welcome home to this cozy 1.5-story gem in Salem! With 3 bedrooms, 1 bath, and around 1,600 sq ft, there’s plenty of space to spread out and enjoy. The home offers a comfortable layout, inviting living areas, and a 1-car garage for added convenience. Whether you're relaxing inside or enjoying the quiet surroundings, this property is full of potential and ready for your personal touch. HOME IS BEING SOLD AS-IS. Seller to do no repairs, replacements or inspections. Inspections would be for Informational purposes only.
Key facts
- 5,227 sq ft lot
- Garage
- Built 1946
Property features AI
Finance
- Financial info: Lease not considered
Exterior
- Parking: Attached garage with space for 1 car
- Utilities: Public water; Public sewer; Electricity connected
- Home design: Single-family residence; One-and-a-half story; Private ownership
- Construction: Vinyl siding exterior
- Exterior features: Level lot; Lot dimensions approximately 57 x 90 x 56 x 90
Interior
- Bedrooms: Three bedrooms total (two on the main level, one upper-level)
- Bathrooms: One full bathroom
- Heating & cooling: Electric heating; Central air conditioning
- Interior features: Central air conditioning; Electric heating
Neighborhood map
What this means for you Summary
Snapshot
- This is a 3-bed/1.0-bath other listed at $79k.
Deal economics
- At list price, monthly cash flow is $198 ($2k/yr) — positive.
- The deal already cash-flows at list — no discount required.
- Meets the 1% rule at list price ($846 rent vs $79k).
- Recommended offer: $77k (3.0% below list) — sets the bar for market timing.
- Cap rate 9.3% vs local median 2.7% in Salem — top-decile yield for the area; either an underpriced asset or a hidden risk that comps aren't pricing in. Stress-test before assuming the spread holds.
Location & tenants
- Location reads 69/100 on livability (#157 in MO) — a middle-class / working-renter tenant base. Strengths: cost of living A+, health & safety A+, crime B; Watch: amenities C-, commute F, employment F.
- Salem R-80 (town): math 25% / reading 41% proficiency, ranked #253 of 324 in MO (top 78%) — families likely to look elsewhere, expect single-tenant / working-renter base with shorter leases.
- Zoned schools: Salem Upper Elem. (math 28% / reading 40%, grade F, #739 of 1,115 statewide, top 67%, 336 students, 62% FRL); Salem Sr. High (math 8% / reading 47%, grade F, #417 of 521 statewide, top 80%, 616 students, 46% FRL).
- Market conditions: 169 active listings in the ZIP; 3 units permitted in Dent County in 2024 (0 in 5+ unit buildings).
Forward outlook
- In year one you build about $5k of equity ($546 loan paydown + $4k appreciation (5.7% local appreciation)).
- Dent County population projected at -14% by 2050 — secular population decline; favor cash flow + early exit over multi-decade hold.
- At projected returns (5.7% appreciation + 3.0% rent growth), your $22k cash investment doubles in ~3 years — after that, you're playing with house money.
- By year 7, paydown + projected appreciation supports a ~$33k cash-out refi (75% LTV) — recoverable capital for the next deal without selling this one.
Negotiation context
- It's been on market 39 days — a 3% lower offer ($77k) is reasonable based on typical stale-listing flexibility.
- 4 sale attempts since 2y ago with the ask held roughly flat each time — persistent listings suggest the price (not the market) is what's stuck; bring a comps-based counter.
Risks & watch-outs
- Watch-outs: built in 1946 — expect roof / HVAC / electrical / plumbing capex.
Questions for the listing agent
- It's been on market 39 days. Have you received any prior offers? Is the seller open to a 3% concession, seller financing, or rate buy-down credit?
- Built in 1946 — when were the roof, HVAC, electrical panel, plumbing, and water heater last replaced?
- Is there a deadline driving the sale (1031 exchange, divorce, estate, relocation)? That informs how much negotiation room exists.
- Schools are D-rated, which usually means shorter tenancies and higher turnover. Who's the typical renter profile here, and what's been the actual vacancy rate?
- What's the average days-on-market for RENTAL listings here right now (not sales)? A rising rental-DOM trend means longer vacancies and softer asking-rent achievability than the comps imply.
- What's the recent tenant-quality profile in this submarket — average credit score on applications, eviction rate, late-payment / NSF rate, and stable-employment percentage? A property-management company in the area should have these aggregated.
- How much new for-sale + rental construction is in the pipeline within 1–3 miles? Heavy new supply typically softens prices + rents 12–24 months out; constrained supply supports both.
Investment metrics
- 1% rule
- 1.07% ✓
- Cap rate
- 9.30%
- Cash-on-cash
- 10.75%
- DSCR
- 1.48
- GRM
- 7.8
CMA / ARV
- ARV (median comp)
- $113,829
- List price
- $79,000
- Delta
- -30.60%
- Verdict
- UNDERPRICED
- Comps
- 20 within 1.0 mi
Projected returns pro-forma
5.66% appreciation · 3.0% rent growth · sell at horizon
- IRR
- 23.5%
- Equity multiple
- 2.53×
- Total profit
- $33,791
- Equity at exit
- $47,955
- IRR
- 22.4%
- Equity multiple
- 5.06×
- Total profit
- $89,903
- Equity at exit
- $85,527
Cash invested: $22,120 (down + closing). Projections, not guarantees.
Landlord ↔ Tenant lean methodology
- Overall (STATE)
- 81 Strongly Landlord-Friendly
- State Missouri
- 81 Strongly Landlord-Friendly · R+10
- County
- — inherits STATE
- City
- — inherits STATE
ZIP-level market 65560
- Home prices YoY
- 2.4%
- Active inventory
- 169
- Price-to-rent
- 7.8×
Monthly cashflow live
- Estimated rent
- $846 medium interval (Pro) →
- Mortgage (P&I)
- −$414
- Tax from tax record
- −$23 /mo · $276/yr
- Insurance
- −$33
- HOA
- −$0
- Vacancy / Maint / Mgmt
- −$178
- Net cashflow
- $198
Break-even live
UW: 25.0% down · 7.5% · 30yr · 1.5% tax · 5.0% vac · 8.0% maint · 8.0% mgmt
Financing live
Cash to close
- Down payment
- $19,750
- Closing costs
- $2,370
- Reserves months
- —
- Total cash needed
- —
Loan-product check · same deal, 3 products live
Conventional
25% down · 7.5% · 30yr
- Down + closing
- —
- Monthly P&I
- —
- Monthly cashflow
- —
- DSCR
- —
- Eligible?
- —
Personal DTI + credit; lowest rate.
DSCR
20% down · 8.5% · 30yr
- Down + closing
- —
- Monthly P&I
- —
- Monthly cashflow
- —
- DSCR
- —
- Eligible?
- —
No personal income docs; deal must DSCR.
Hard money
10% down · 12.0% · 12mo
- Down + closing
- —
- Monthly P&I
- —
- Monthly cashflow
- —
- DSCR
- —
- Eligible?
- —
Short-term bridge; refi at stabilization.
Listing history 11 events
-
2026-06-18days on market $79,000 Active 39 DOM
-
2026-06-17days on market $79,000 Active 38 DOM
-
2026-06-16days on market $79,000 Active 37 DOM
-
2026-06-15days on market $79,000 Active 36 DOM
-
2026-06-13days on market $79,000 Active 34 DOM
-
2026-06-12statusdays on market $79,000 Active 33 DOM
-
2026-04-28$79,000 Active 393-char remark
-
2025-08-20$60,000 Active
-
2025-08-16historical
-
2025-01-26historical
-
2024-07-23$64,900 Active
ⓘ Source: listings_history table (triggers on properties + properties_extension) + one-shot
backfill from property_details.listing_events for pre-trigger history.
Tax reassessment forecast MO · Resets to sale price
- Current annual tax
- $276 · $23/mo
- Projected year-2 tax
- $766 · $64/mo
- Expected delta
- +$490/yr (+$41/mo · 177.5%)
ⓘ Screening estimate from a state-policy table — verify with the county assessor before closing.
Nearby sold comps map
Loading sold comps map…
Walkable amenities ~0.75 mi
Loading nearby amenities…
Taxation est. · year 1
- Rental income
- $10,152
- − Mortgage interest
- −$4,425
- − Property taxes
- −$276
- − Insurance
- −$395
- − Repairs & maintenance
- −$812
- − Management
- −$812
- − Depreciation
- −$2,298
- Taxable income
- $1,134
- Est. tax owed @ 24.0%
- −$272
- After-tax cash flow
- $2,106/yr
For passive investors: Depreciation is non-cash, so a rental often shows a tax loss while cash-flowing — sheltering income. Rental losses are passive: they offset passive income freely, and up to $25,000/yr can offset ordinary (W-2) income if you actively participate and your MAGI is under $100k (phasing out to $0 by $150k); unused losses carry forward. On sale, claimed depreciation is recaptured at up to 25%, and gains may owe capital-gains tax (a 1031 exchange can defer both). Figures are a year-1 estimate at your 24.0% rate — not tax advice; consult a CPA.
Schools (NCES district)
- District
- Salem R-80
- NCES district ID
- 2927090
- Math proficiency
- 25% ▼ -6.00%
- Reading proficiency
- 41% ▼ -2.00%
- Median HH income
- $32,306
- Composite
- 26.94/100
- National rank
- #7082
- State rank
- #253 of 324 in MO
Livability — Salem
- Score
- 69/100
- State rank
- #157
- US rank
- #8725
Category grades
Schools grade is shown separately in the Schools card above.
Census & demographics
- Census place
- Salem, MO
- Population (ZIP)
- 13,634
Population outlook (Dent County) Hauer SSP2
- Today (2025)
- 15,149 people
- By 2030
- 14,734 · -2.7%
- By 2040
- 13,862 · -8.5%
- By 2050
- 12,959 · -14.5%
- By 2075
- 11,217 · -26.0%
- By 2100
- 9,399 · -38.0%
Race, ethnicity, and origin ACS 2023
- Neighborhood character
- Predominantly White (92%)
- Race & ethnicity
- White 92% Two or more races 5% Hispanic / Latino 2%
- Common ancestry
- Italian 2% Lithuanian 2% Slovak 2%
- Foreign-born
- 2% · China
Political lean MEDSL · Dent
- 2024 margin
- Solid R (+70.2) · D 14.4% · R 84.7%
- 2008→2024 swing
- -32.4pp toward R · 2008: -37.8pp · 2024: -70.2pp
- All cycles
- 2024: R+70.2 2020: R+69.0 2016: R+68.2 2012: R+49.6 2008: R+37.8
Not yet ingested
- Civics
- —
Market trends
- HPI YoY
- ▲ 5.66%
- Current HPI
- 238.9175
- Rent YoY
- —
- Metro
- —
- State GDP YoY
- ▲ 1.84%
- F500 in state
- 20
Industry mix (Fortune 500 HQ in MO)
| Industry | F500 HQs | Revenue |
|---|---|---|
| Healthcare | 1 | $163B |
|
||
| Insurance | 1 | $21B |
|
||
| Industrial Technology | 1 | $17B |
|
||
| Retail | 1 | $16B |
|
||
| Industrial Distribution | 1 | $10B |
|
||
| Utilities | 1 | $9B |
|
||
Price history
+21.7% since first listed9 events — show timeline
- 2026-06-10 Relisted — MARIS as Distributed by MLS Grid
- 2026-05-30 Pending — MARIS as Distributed by MLS Grid
- 2026-05-20 Price Changed $79,000 MARIS as Distributed by MLS Grid
- 2026-05-20 Price Changed $64,900 MARIS as Distributed by MLS Grid
- 2026-04-28 Listed $79,000 MARIS as Distributed by MLS Grid
- 2025-08-20 Listed $60,000 MARIS as Distributed by MLS Grid
- 2025-08-16 Coming Soon — MARIS as Distributed by MLS Grid
- 2025-01-26 Delisted — MARIS as Distributed by MLS Grid
- 2024-07-23 Listed $64,900 MARIS as Distributed by MLS Grid
Property tax history
-5.7%/yrLatest (2025): $276 · +4.9% YoY. Source: county tax records.
Cash-flow waterfall
monthlySold comps — $/sqft
last 12 mo · ≤1 miLoading sold comps…