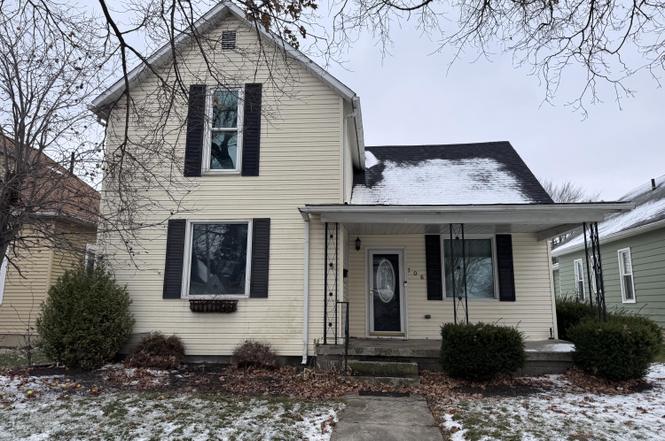
706 Jackson St · St. Marys, OH
Flood risk 1/10 · Minimal
- FEMA flood zone
- X
- Chance of flooding over 30 yrs
- 0.0%
- Est. flood insurance / yr
- $473 – $860
Fire risk 1/10 · Minimal
- Est. fire insurance / yr
- $713 – $1,323
Heat risk 3/10 · Minor
- Hot days now (above 100°F)
- 7 days/yr
- Hot days in 30 yrs
- 18 days/yr
Wind risk 2/10 · Minimal
- Chance of severe wind over 30 yrs
- —
Air-quality risk 2/10 · Minimal
- Unhealthy air days now
- 1 days/yr
- Unhealthy air days in 30 yrs
- 2 days/yr
Risk factors via First Street. Map © Google.
Why this score? — see what drove the D+ grade
The composite is a weighted blend of 9 inputs, each scored 0–100. Each bar is that input's sub-score; the figure is the points it added to the 100-point composite (weight × sub-score).
- ARV discount +15.0/15.0
- Cash flow +13.4/30.0
- Schools +5.5/10.0
- DSCR +4.0/10.0
- 1% rule +3.2/10.0
- Rent growth +2.5/5.0
- Livability +2.5/5.0
- Condition / age +2.5/5.0
- Appreciation +0.0/10.0
$125,000
🖨 Deal sheet (PDF) 📄 Offer letter ✓ Due diligence
Listing remarks MLS
The curb appeal is outstanding at 706 Jackson St!! Curb appeal isn't the only gorgeous feature here! Some updates on this wonderful two story home include: new flooring in kitchen, laundry room, and 1/2 bath in 2019, new kitchen counter tops in 2018, 1/2 bath vanity, new carpet in bedroom upstairs. The storage is abundant here.The front porch is great for gathering but that isn't all, enjoy the 24'x18' patio out back that was added in 2017. The back yard is fenced in and also features a one car detached garage. Call today to make that private tour! Interior pics coming soon!
Key facts
- New roof
- 5,662 sq ft lot
- Garage
Tags
Property features AI
Exterior
- Parking: 1-car garage
- Utilities: Supplied water; Public sewer
- Home design: Single-family residence; Residential property; Built in 1927
- Construction: Vinyl siding; Block foundation
- Exterior features: Porch; Patio; Fenced yard; Residential lot (regular)
Interior
- Flooring: Carpet; Linoleum; Tile
- Bathrooms: 2 bathrooms total (1 full, 1 half)
- Heating & cooling: Baseboard heating
- Interior features: Electric water heater; Partial, unfinished basement
Neighborhood map
What this means for you Summary
Snapshot
- This is a 3-bed/1.5-bath single-family listed at $125k.
Deal economics
- At list price, monthly cash flow is $3 ($36/yr) — positive.
- The deal already cash-flows at list — no discount required.
- To meet the 1% rule (rent ≥ 1% of price), the offer needs to be $103k (17.9% below list).
- Recommended offer: $103k (17.9% below list) — sets the bar for 1% rule.
- Cap rate 6.3% vs local median 2.9% in St. Marys — top-decile yield for the area; either an underpriced asset or a hidden risk that comps aren't pricing in. Stress-test before assuming the spread holds.
Location & tenants
- Location reads: area grade D — affects rentability + tenant quality, not the cash-flow math above.
- St Marys City (town): math 64% / reading 65% proficiency, ranked #221 of 656 in OH (top 34%) — acceptable for families but not a draw, mixed tenant base, ~2y average lease.
- Zoned schools: St Marys West Intermediate School (math 72% / reading 64%, grade B+, #439 of 1,584 statewide, top 28%, 430 students, 43% FRL); St. Marys Middle School (math 60% / reading 66%, grade B+, #233 of 654 statewide, top 36%, 454 students, 80% FRL); St Marys Memorial High School (math 52% / reading 67%, grade C+, #243 of 781 statewide, top 33%, 636 students, 0% FRL).
- Market conditions: 67 active listings in the ZIP; solid renter incomes; 121 units permitted in Auglaize County in 2024 (0 in 5+ unit buildings).
- This rent is only 16% of the median local income ($75k/yr) — well below the 30% rent-burden line; pricing power to push rent on renewal without tenant pushback.
Forward outlook
- Local home prices are declining (-3.0%/yr); year-one equity from $864 of loan paydown is wiped out by about $4k of value loss. Plan a longer hold.
- Auglaize County population projected at -12% by 2050 — secular population decline; favor cash flow + early exit over multi-decade hold.
Negotiation context
- It's been on market 199 days — a 12% lower offer ($110k) is reasonable based on typical stale-listing flexibility.
- 4 sale attempts since 7y ago with the ask held roughly flat each time — persistent listings suggest the price (not the market) is what's stuck; bring a comps-based counter.
Risks & watch-outs
- Watch-outs: built in 1927 — expect roof / HVAC / electrical / plumbing capex.
Questions for the listing agent
- It's been on market 199 days. Have you received any prior offers? Is the seller open to a 18% concession, seller financing, or rate buy-down credit?
- Built in 1927 — when were the roof, HVAC, electrical panel, plumbing, and water heater last replaced?
- Why hasn't it sold? Are there any deal-killer items the seller is aware of (foundation, flood, title, zoning, code violations)?
- Is there a deadline driving the sale (1031 exchange, divorce, estate, relocation)? That informs how much negotiation room exists.
- The area grade is low — what's the realistic commute time and amenity access for the typical tenant pool here? Any planned neighborhood developments (good or bad) we should know about?
- What's the average days-on-market for RENTAL listings here right now (not sales)? A rising rental-DOM trend means longer vacancies and softer asking-rent achievability than the comps imply.
- What's the recent tenant-quality profile in this submarket — average credit score on applications, eviction rate, late-payment / NSF rate, and stable-employment percentage? A property-management company in the area should have these aggregated.
- How much new for-sale + rental construction is in the pipeline within 1–3 miles? Heavy new supply typically softens prices + rents 12–24 months out; constrained supply supports both.
Investment metrics
- 1% rule
- 0.82% ✗
- Cap rate
- 6.32%
- Cash-on-cash
- 0.10%
- DSCR
- 1.00
- GRM
- 10.2
CMA / ARV
- ARV (on-the-fly)
- $170,624
- Comps found
- 12
Show comp detail 12 sales within ~0.75 mi
| Address | Dist | Beds/Ba | Sqft | Sold | Price | $/sf | Match |
|---|---|---|---|---|---|---|---|
| 310 N Main St | 0.32mi | 3/1.0 | 1,490 (+8%) | 4mo | $160,000 | $107 | 66 |
| 1209 W High St | 0.31mi | 3/1.0 | 1,232 (-10%) | 2mo | $199,900 | $162 | 64 |
| 719 Oliver St | 0.57mi | 3/1.0 | 1,392 (+1%) | 9mo | $172,000 | $124 | 62 |
| 1127 Robin Rd | 0.56mi | 3/1.5 | 1,337 (-3%) | 10mo | $155,000 | $116 | 61 |
| 116 Guy St | 0.33mi | 3/1.0 | 1,248 (-9%) | 10mo | $120,000 | $96 | 59 |
| 720 Oliver St | 0.54mi | 3/1.5 | 1,456 (+6%) | 10mo | $177,200 | $122 | 57 |
| 1306 Nagel St | 0.59mi | 3/1.5 | 1,282 (-7%) | 9mo | $190,000 | $148 | 54 |
| 1114 Neil Ave | 0.49mi | 4/2.0 (+1) | 1,451 (+6%) | 11mo | $265,000 | $183 | 52 |
| 828 Oliver St | 0.51mi | 3/2.0 | 1,512 (+10%) | 8mo | $190,000 | $126 | 51 |
| 121 Windsor Dr | 0.66mi | 3/2.0 | 1,274 (-7%) | 11mo | $29,900 | $23 | 46 |
| 806 Oliver St | 0.52mi | 4/2.5 (+1) | 1,575 (+14%) | 2mo | $247,000 | $157 | 41 |
| 228 N Chestnut St | 0.56mi | 4/1.5 (+1) | 1,568 (+14%) | 7mo | $180,000 | $115 | 40 |
Match score weights: distance 35% · size 25% · config 20% · recency 20%. Top-matched comps best support the ARV.
Projected returns pro-forma
-3.0% appreciation · 3.0% rent growth · sell at horizon
- IRR
- -16.2%
- Equity multiple
- 0.43×
- Total profit
- $-20,086
- Equity at exit
- $18,638
- IRR
- -7.9%
- Equity multiple
- 0.50×
- Total profit
- $-17,326
- Equity at exit
- $10,808
Cash invested: $35,000 (down + closing). Projections, not guarantees.
Landlord ↔ Tenant lean methodology
- Overall (STATE)
- 73 Landlord-Friendly
- State Ohio
- 73 Landlord-Friendly · R+6
- County
- — inherits STATE
- City
- — inherits STATE
ZIP-level market 45885
- Active inventory
- 67
- Price-to-rent
- 10.2×
Monthly cashflow live
- Estimated rent
- $1,026 medium interval (Pro) →
- Mortgage (P&I)
- −$656
- Tax from tax record
- −$100 /mo · $1,197/yr
- Insurance
- −$52
- HOA
- −$0
- Vacancy / Maint / Mgmt
- −$215
- Net cashflow
- $3
Break-even live
Sensitivity live
| Price | -10% $74 | -5% $38 | +0% $3 | +5% $-32 | +10% $-68 |
|---|---|---|---|---|---|
| Rent | -10% $-78 | -5% $-38 | +0% $3 | +5% $43 | +10% $84 |
| Rate | -1.0pp $66 | -0.5pp $35 | base $3 | +0.5pp $-29 | +1.0pp $-62 |
UW: 25.0% down · 7.5% · 30yr · 1.5% tax · 5.0% vac · 8.0% maint · 8.0% mgmt
Financing live
Cash to close
- Down payment
- $31,250
- Closing costs
- $3,750
- Reserves months
- —
- Total cash needed
- —
Loan-product check · same deal, 3 products live
Conventional
25% down · 7.5% · 30yr
- Down + closing
- —
- Monthly P&I
- —
- Monthly cashflow
- —
- DSCR
- —
- Eligible?
- —
Personal DTI + credit; lowest rate.
DSCR
20% down · 8.5% · 30yr
- Down + closing
- —
- Monthly P&I
- —
- Monthly cashflow
- —
- DSCR
- —
- Eligible?
- —
No personal income docs; deal must DSCR.
Hard money
10% down · 12.0% · 12mo
- Down + closing
- —
- Monthly P&I
- —
- Monthly cashflow
- —
- DSCR
- —
- Eligible?
- —
Short-term bridge; refi at stabilization.
Listing history 29 events
-
2026-06-21days on market $125,000 Active 199 DOM
-
2026-06-21days on market $125,000 Active 198 DOM
-
2026-06-18days on market $125,000 Active 196 DOM
-
2026-06-17days on market $125,000 Active 195 DOM
-
2026-06-16days on market $125,000 Active 194 DOM
-
2026-06-15days on market $125,000 Active 193 DOM
-
2026-06-13days on market $125,000 Active 191 DOM
-
2026-06-12days on market $125,000 Active 190 DOM
-
2026-06-09days on market $125,000 Active 187 DOM
-
2026-06-08days on market $125,000 Active 186 DOM
-
2026-06-08days on market $125,000 Active 185 DOM
-
2026-06-07days on market $125,000 Active 184 DOM
-
2026-06-04days on market $125,000 Active 181 DOM
-
2026-06-02days on market $125,000 Active 180 DOM
-
2026-06-01days on market $125,000 Active 179 DOM
-
2026-05-31days on market $125,000 Active 178 DOM
-
2026-05-05$125,000 Active
-
2026-05-04status Active
-
2026-05-04soldstatus Closed
-
2026-05-01historical
-
2026-03-26price $125,000
-
2026-01-03price $142,500
-
2025-12-04price $145,000
-
2025-11-30$150,000 Active
-
2019-09-24soldstatus $127,900 581-char remark
Show marketing remark (581 chars)
The curb appeal is outstanding at 706 Jackson St!! Curb appeal isn't the only gorgeous feature here! Some updates on this wonderful two story home include: new flooring in kitchen, laundry room, and 1/2 bath in 2019, new kitchen counter tops in 2018, 1/2 bath vanity, new carpet in bedroom upstairs. The storage is abundant here.The front porch is great for gathering but that isn't all, enjoy the 24'x18' patio out back that was added in 2017. The back yard is fenced in and also features a one car detached garage. Call today to make that private tour! Interior pics coming soon!
-
2019-09-24soldstatus $127,900
Show marketing remark (581 chars)
The curb appeal is outstanding at 706 Jackson St!! Curb appeal isn't the only gorgeous feature here! Some updates on this wonderful two story home include: new flooring in kitchen, laundry room, and 1/2 bath in 2019, new kitchen counter tops in 2018, 1/2 bath vanity, new carpet in bedroom upstairs. The storage is abundant here.The front porch is great for gathering but that isn't all, enjoy the 24'x18' patio out back that was added in 2017. The back yard is fenced in and also features a one car detached garage. Call today to make that private tour! Interior pics coming soon!
-
2019-07-31$129,900 581-char remark
Show marketing remark (581 chars)
The curb appeal is outstanding at 706 Jackson St!! Curb appeal isn't the only gorgeous feature here! Some updates on this wonderful two story home include: new flooring in kitchen, laundry room, and 1/2 bath in 2019, new kitchen counter tops in 2018, 1/2 bath vanity, new carpet in bedroom upstairs. The storage is abundant here.The front porch is great for gathering but that isn't all, enjoy the 24'x18' patio out back that was added in 2017. The back yard is fenced in and also features a one car detached garage. Call today to make that private tour! Interior pics coming soon!
-
2002-03-26soldstatus $60,000
-
1993-09-21soldstatus $47,500
ⓘ Source: listings_history table (triggers on properties + properties_extension) + one-shot
backfill from property_details.listing_events for pre-trigger history.
Tax reassessment forecast OH · Partial reset (capped growth)
- Current annual tax
- $1,197 · $100/mo
- Projected year-2 tax
- $1,574 · $131/mo
- Expected delta
- +$376/yr (+$31/mo · 31.5%)
ⓘ Screening estimate from a state-policy table — verify with the county assessor before closing.
Climate risk First Street
- Flood 1/10 Low FEMA zone X · 0% chance over 30 yrs
- Wildfire 1/10 Low
- Heat 3/10 Moderate 7 d/yr ≥100°F today · 18 d/yr by 30 yrs out
- Wind 2/10 Low
- Air quality 2/10 Low 1 unhealthy d/yr today · 2 by 30 yrs out
Nearby sold comps map
Loading sold comps map…
Walkable amenities ~0.75 mi
Loading nearby amenities…
Taxation est. · year 1
- Rental income
- $12,309
- − Mortgage interest
- −$7,002
- − Property taxes
- −$1,197
- − Insurance
- −$625
- − Repairs & maintenance
- −$985
- − Management
- −$985
- − Depreciation
- −$3,636
- Taxable loss
- −$2,121
- Est. tax savings @ 24.0%
- +$509
- After-tax cash flow
- $545/yr
For passive investors: Depreciation is non-cash, so a rental often shows a tax loss while cash-flowing — sheltering income. Rental losses are passive: they offset passive income freely, and up to $25,000/yr can offset ordinary (W-2) income if you actively participate and your MAGI is under $100k (phasing out to $0 by $150k); unused losses carry forward. On sale, claimed depreciation is recaptured at up to 25%, and gains may owe capital-gains tax (a 1031 exchange can defer both). Figures are a year-1 estimate at your 24.0% rate — not tax advice; consult a CPA.
Schools (NCES district)
- District
- St Marys City
- NCES district ID
- 3904472
- Math proficiency
- 64% ▼ -10.00%
- Reading proficiency
- 65% ▼ -4.00%
- Median HH income
- $49,672
- Composite
- 54.78/100
- National rank
- #1317
- State rank
- #221 of 656 in OH
Livability — St. Marys
No livability data for this city. (Only ~50 U.S. cities are tracked.)
Census & demographics
- Census place
- St. Marys, OH
- County
- Auglaize · 44,666 people
- Population (ZIP)
- 12,744
- Household income
- $75,054
- Rent vs Own
- Severe rent burden
- 3.6
Population outlook (Auglaize County) Hauer SSP2
- Today (2025)
- 45,247 people
- By 2030
- 44,448 · -1.8%
- By 2040
- 42,355 · -6.4%
- By 2050
- 39,722 · -12.2%
- By 2075
- 33,967 · -24.9%
- By 2100
- 26,839 · -40.7%
Race, ethnicity, and origin ACS 2023
- Neighborhood character
- Predominantly White (94%)
- Race & ethnicity
- White 94% Two or more races 4%
- Common ancestry
- Lithuanian 3% Iranian 2% Slovak 1%
- Foreign-born
- 1%
- Languages at home
- 98% English-only · German/W. Germanic 1% Other Asian/Pacific 1%
Political lean MEDSL · Auglaize
- 2024 margin
- Solid R (+64.6) · D 17.3% · R 81.9%
- 2008→2024 swing
- -23.4pp toward R · 2008: -41.2pp · 2024: -64.6pp
- All cycles
- 2024: R+64.6 2020: R+62.6 2016: R+62.6 2012: R+48.9 2008: R+41.2
Not yet ingested
- Civics
- —
Market trends
- HPI YoY
- ▼ -207.83%
- Current HPI
- 197.352
- Rent YoY
- —
- Metro
- —
- State GDP YoY
- ▲ 1.98%
- F500 in state
- 48
Industry mix (Fortune 500 HQ in OH)
| Industry | F500 HQs | Revenue |
|---|---|---|
| Insurance | 3 | $145B |
|
||
| Industrial Machinery | 3 | $49B |
|
||
| Financial Services | 3 | $24B |
|
||
| Consumer Goods | 2 | $93B |
|
||
| Aerospace / Defense | 2 | $47B |
|
||
| Utilities | 2 | $33B |
|
||
Price history
+163.2% since first listed13 events — show timeline
- 2026-05-05 Listed $125,000 WRIST
- 2026-05-04 Relisted — WRIST
- 2026-05-04 Sold (MLS) — WRIST
- 2026-05-01 Listing Removed — WRIST
- 2026-03-26 Price Changed $125,000 WRIST
- 2026-01-03 Price Changed $142,500 WRIST
- 2025-12-04 Price Changed $145,000 WRIST
- 2025-11-30 Listed $150,000 WRIST
- 2019-09-24 Sold (Public Records) $127,900 Public Records
- 2019-09-24 Sold (MLS) $127,900 WRIST
- 2019-07-31 Listed $129,900 WRIST
- 2002-03-26 Sold (Public Records) $60,000 Public Records
- 1993-09-21 Sold (Public Records) $47,500 Public Records
Property tax history
+2.6%/yrLatest (2025): $1,197 · -1.3% YoY. Source: county tax records.
Cash-flow waterfall
monthlySold comps — $/sqft
last 12 mo · ≤1 miLoading sold comps…