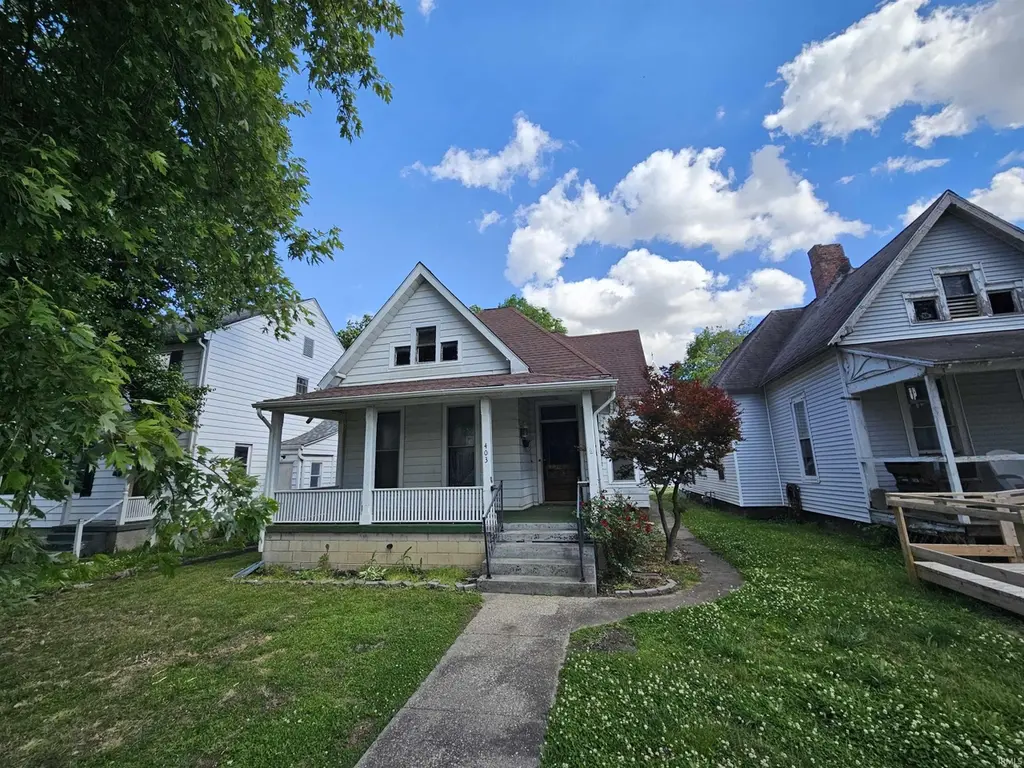
403 N 3rd St · Vincennes, IN
Flood risk 1/10 · Minimal
- FEMA flood zone
- —
- Chance of flooding over 30 yrs
- 0.0%
- Est. flood insurance / yr
- —
Fire risk 1/10 · Minimal
- Est. fire insurance / yr
- $717 – $1,331
Heat risk 5/10 · Moderate
- Hot days now (above 106°F)
- 7 days/yr
- Hot days in 30 yrs
- 20 days/yr
Wind risk 2/10 · Minimal
- Chance of severe wind over 30 yrs
- 2.0%
Air-quality risk 3/10 · Minor
- Unhealthy air days now
- 2 days/yr
- Unhealthy air days in 30 yrs
- 3 days/yr
Risk factors via First Street. Map © Google.
Why this score? — see what drove the B grade
The composite is a weighted blend of 9 inputs, each scored 0–100. Each bar is that input's sub-score; the figure is the points it added to the 100-point composite (weight × sub-score).
- Cash flow +30.0/30.0
- ARV discount +14.5/15.0
- DSCR +10.0/10.0
- 1% rule +8.6/10.0
- Livability +3.5/5.0
- Schools +3.0/10.0
- Rent growth +2.5/5.0
- Condition / age +2.5/5.0
- Appreciation +0.0/10.0
$99,900
🖨 Deal sheet (PDF) 📄 Offer letter ✓ Due diligence
Listing remarks MLS
This spacious home has 3-4 bedrooms and tons of classic character. The home needs some TLC, and the attic could be finished for more square footage.
Key facts
- Flexible floor plan
- Main floor laundry
- Unfinished 2nd level
Tags
Property features AI
Finance
- Other: Located in the Old Town subdivision
- Financial info: R1 residential zoning
Exterior
- Parking: Gravel parking
- Utilities: Public water; Public sewer; Cable connected
- Home design: Single-family residence; Site-built home; One story
- Construction: Aluminum siding; Asphalt roof; Built as site-built construction
- Exterior features: Covered porch; Porch; Level lot
Interior
- Kitchen: Kitchen island; Breakfast bar; Eat-in kitchen
- Flooring: Hardwood; Vinyl
- Bathrooms: 1 full bathroom (main level)
- Heating & cooling: Natural gas forced air heating; Ceiling fans; Window AC units
- Interior features: Breakfast bar; Ceiling fans; Eat-in kitchen; Kitchen island; Partial unfinished basement; Living room fireplace
- Laundry & utility: Washer hookup; Electric dryer hookup; Main level laundry; Gas water heater; Water heater
Neighborhood map
What this means for you Summary
Snapshot
- This is a 4-bed/1.0-bath single-family listed at $100k.
Deal economics
- At list price, monthly cash flow is $392 ($5k/yr) — positive.
- The deal already cash-flows at list — no discount required.
- Meets the 1% rule at list price ($1k rent vs $100k).
- Recommended offer: $97k (3.0% below list) — sets the bar for market timing.
- Cap rate 11.0% vs local median 5.0% in Vincennes — top-decile yield for the area; either an underpriced asset or a hidden risk that comps aren't pricing in. Stress-test before assuming the spread holds.
Location & tenants
- Location reads 70/100 on livability (#148 in IN) — a middle-class / working-renter tenant base. Strengths: cost of living A+, housing A+, health & safety A+; Watch: amenities F, commute F, employment D-.
- Vincennes Community School Corporation (town): math 34% / reading 38% proficiency, ranked #193 of 301 in IN (top 64%) — families likely to look elsewhere, expect single-tenant / working-renter base with shorter leases.
- Zoned schools: Tecumseh-Harrison Elementary Sch (math 22% / reading 32%, grade F, #737 of 994 statewide, top 76%, 369 students, 68% FRL); George Rogers Clark School (math 27% / reading 34%, grade F, #203 of 330 statewide, top 63%, 609 students, 57% FRL); Lincoln High School (math 27% / reading 47%, grade F, #247 of 369 statewide, top 70%, 765 students, 55% FRL).
- Market conditions: 139 active listings in the ZIP; 36 units permitted in Knox County in 2024 (0 in 5+ unit buildings).
Forward outlook
- Local home prices are declining (-3.0%/yr); year-one equity from $691 of loan paydown is wiped out by about $3k of value loss. Plan a longer hold.
- Knox County population projected at -13% by 2050 — secular population decline; favor cash flow + early exit over multi-decade hold.
- At projected returns (-3.0% appreciation + 3.0% rent growth), your $28k cash investment doubles in ~8 years — after that, you're playing with house money.
Negotiation context
- It's been on market 38 days — a 3% lower offer ($97k) is reasonable based on typical stale-listing flexibility.
- 3 sale attempts since 10y ago with the ask held roughly flat each time — persistent listings suggest the price (not the market) is what's stuck; bring a comps-based counter.
- Current owner paid $19k; list at $100k implies a 426% gain — meaningful room to come down on a strong offer.
Risks & watch-outs
- Watch-outs: built in 1890 — expect roof / HVAC / electrical / plumbing capex.
- Climate carrying-cost: extreme-heat days projected 7→20/yr by 2055 (HVAC capex compounding) — expect insurance premiums to compound above CPI over the hold.
Questions for the listing agent
- It's been on market 38 days. Have you received any prior offers? Is the seller open to a 3% concession, seller financing, or rate buy-down credit?
- Built in 1890 — when were the roof, HVAC, electrical panel, plumbing, and water heater last replaced?
- Is there a deadline driving the sale (1031 exchange, divorce, estate, relocation)? That informs how much negotiation room exists.
- Schools are D-rated, which usually means shorter tenancies and higher turnover. Who's the typical renter profile here, and what's been the actual vacancy rate?
- What's the average days-on-market for RENTAL listings here right now (not sales)? A rising rental-DOM trend means longer vacancies and softer asking-rent achievability than the comps imply.
- What's the recent tenant-quality profile in this submarket — average credit score on applications, eviction rate, late-payment / NSF rate, and stable-employment percentage? A property-management company in the area should have these aggregated.
- How much new for-sale + rental construction is in the pipeline within 1–3 miles? Heavy new supply typically softens prices + rents 12–24 months out; constrained supply supports both.
Investment metrics
- 1% rule
- 1.36% ✓
- Cap rate
- 11.00%
- Cash-on-cash
- 16.80%
- DSCR
- 1.75
- GRM
- 6.1
CMA / ARV
- ARV (median comp)
- $118,152
- List price
- $99,900
- Delta
- -15.45%
- Verdict
- UNDERPRICED
- Comps
- 20 within 1.0 mi
Show comp detail 12 sales within ~0.75 mi
| Address | Dist | Beds/Ba | Sqft | Sold | Price | $/sf | Match |
|---|---|---|---|---|---|---|---|
| 216 Buntin St | 0.08mi | 3/1.5 (-1) | 1,672 (+1%) | 6mo | $163,000 | $97 | 83 |
| 209 Seminary St | 0.07mi | 4/1.5 | 1,768 (+6%) | 10mo | $82,500 | $47 | 76 |
| 704 N 9th St | 0.39mi | 4/2.0 | 1,720 (+4%) | 4mo | $162,000 | $94 | 69 |
| 319 Bayou St | 0.61mi | 4/1.0 | 1,689 (+2%) | 0mo | $175,000 | $104 | 68 |
| 702 Buntin St | 0.27mi | 4/2.0 | 1,782 (+7%) | 7mo | $30,000 | $17 | 66 |
| 416 Barnett St | 0.44mi | 4/2.0 | 1,704 (+2%) | 6mo | $173,000 | $102 | 66 |
| 804 N 5th St | 0.26mi | 3/2.0 (-1) | 1,536 (-8%) | 6mo | $85,000 | $55 | 62 |
| 608 N 6th St | 0.20mi | 3/2.0 (-1) | 1,904 (+15%) | 7mo | $170,000 | $89 | 51 |
| 217 S 9th St | 0.57mi | 3/2.0 (-1) | 1,778 (+7%) | 11mo | $175,000 | $98 | 44 |
| 414 Bayou St | 0.60mi | 3/1.0 (-1) | 1,440 (-13%) | 8mo | $53,500 | $37 | 38 |
| 1302 Busseron St | 0.73mi | 3/2.5 (-1) | 1,866 (+12%) | 4mo | $171,000 | $92 | 31 |
| 1313 Broadway St | 0.74mi | 3/2.0 (-1) | 1,422 (-14%) | 8mo | $149,900 | $105 | 26 |
Match score weights: distance 35% · size 25% · config 20% · recency 20%. Top-matched comps best support the ARV.
Projected returns pro-forma
-3.0% appreciation · 3.0% rent growth · sell at horizon
- IRR
- 8.0%
- Equity multiple
- 1.31×
- Total profit
- $8,772
- Equity at exit
- $14,895
- IRR
- 17.3%
- Equity multiple
- 2.42×
- Total profit
- $39,816
- Equity at exit
- $8,638
Cash invested: $27,972 (down + closing). Projections, not guarantees.
Landlord ↔ Tenant lean methodology
- Overall (STATE)
- 90 Strongly Landlord-Friendly
- State Indiana
- 90 Strongly Landlord-Friendly · R+11
- County
- — inherits STATE
- City
- — inherits STATE
ZIP-level market 47591
- Home prices YoY
- -19.5%
- Active inventory
- 139
- Price-to-rent
- 6.1×
Monthly cashflow live
- Estimated rent
- $1,356 medium interval (Pro) →
- Mortgage (P&I)
- −$524
- Tax from tax record
- −$114 /mo · $1,366/yr
- Insurance
- −$42
- HOA
- −$0
- Vacancy / Maint / Mgmt
- −$285
- Net cashflow
- $392
Break-even live
Sensitivity live
| Price | -10% $448 | -5% $420 | +0% $392 | +5% $363 | +10% $335 |
|---|---|---|---|---|---|
| Rent | -10% $285 | -5% $338 | +0% $392 | +5% $445 | +10% $499 |
| Rate | -1.0pp $442 | -0.5pp $417 | base $392 | +0.5pp $366 | +1.0pp $339 |
UW: 25.0% down · 7.5% · 30yr · 1.5% tax · 5.0% vac · 8.0% maint · 8.0% mgmt
Financing live
Cash to close
- Down payment
- $24,975
- Closing costs
- $2,997
- Reserves months
- —
- Total cash needed
- —
Loan-product check · same deal, 3 products live
Conventional
25% down · 7.5% · 30yr
- Down + closing
- —
- Monthly P&I
- —
- Monthly cashflow
- —
- DSCR
- —
- Eligible?
- —
Personal DTI + credit; lowest rate.
DSCR
20% down · 8.5% · 30yr
- Down + closing
- —
- Monthly P&I
- —
- Monthly cashflow
- —
- DSCR
- —
- Eligible?
- —
No personal income docs; deal must DSCR.
Hard money
10% down · 12.0% · 12mo
- Down + closing
- —
- Monthly P&I
- —
- Monthly cashflow
- —
- DSCR
- —
- Eligible?
- —
Short-term bridge; refi at stabilization.
Listing history 22 events
-
2026-06-21days on market $99,900 Active 38 DOM
-
2026-06-21days on market $99,900 Active 37 DOM
-
2026-06-18days on market $99,900 Active 35 DOM
-
2026-06-17days on market $99,900 Active 34 DOM
-
2026-06-16days on market $99,900 Active 33 DOM
-
2026-06-15days on market $99,900 Active 32 DOM
-
2026-06-13days on market $99,900 Active 30 DOM
-
2026-06-12days on market $99,900 Active 29 DOM
-
2026-06-09days on market $99,900 Active 26 DOM
-
2026-06-08days on market $99,900 Active 25 DOM
-
2026-06-07days on market $99,900 Active 24 DOM
-
2026-06-07days on market $99,900 Active 23 DOM
-
2026-06-04days on market $99,900 Active 20 DOM
-
2026-06-03price $99,900 Active 19 DOM
-
2026-06-02days on market $104,900 Active 19 DOM
-
2026-06-01days on market $104,900 Active 18 DOM
-
2026-05-31days on market $104,900 Active 17 DOM
-
2026-05-31days on market $104,900 Active 16 DOM
-
2026-05-13$104,900 Active 442-char remark
-
2017-08-10soldstatus $19,000 148-char remark
Show marketing remark (148 chars)
This spacious home has 3-4 bedrooms and tons of classic character. The home needs some TLC, and the attic could be finished for more square footage.
-
2017-01-27$19,900 148-char remark
Show marketing remark (148 chars)
This spacious home has 3-4 bedrooms and tons of classic character. The home needs some TLC, and the attic could be finished for more square footage.
-
2016-10-06$27,100
ⓘ Source: listings_history table (triggers on properties + properties_extension) + one-shot
backfill from property_details.listing_events for pre-trigger history.
Tax reassessment forecast IN · Partial reset (capped growth)
- Current annual tax
- $1,366 · $114/mo
- Projected year-2 tax
- $1,366 · $114/mo
- Expected delta
- $0/yr ($0/mo · 0.0%)
ⓘ Screening estimate from a state-policy table — verify with the county assessor before closing.
Climate risk First Street
- Flood 1/10 Low 0% chance over 30 yrs
- Wildfire 1/10 Low
- Heat 5/10 Major 7 d/yr ≥106°F today · 20 d/yr by 30 yrs out
- Wind 2/10 Low 2% chance of damaging wind over 30 yrs
- Air quality 3/10 Moderate 2 unhealthy d/yr today · 3 by 30 yrs out
Nearby sold comps map
Loading sold comps map…
Walkable amenities ~0.75 mi
Loading nearby amenities…
Taxation est. · year 1
- Rental income
- $16,268
- − Mortgage interest
- −$5,596
- − Property taxes
- −$1,366
- − Insurance
- −$500
- − Repairs & maintenance
- −$1,301
- − Management
- −$1,301
- − Depreciation
- −$2,906
- Taxable income
- $3,298
- Est. tax owed @ 24.0%
- −$792
- After-tax cash flow
- $3,909/yr
For passive investors: Depreciation is non-cash, so a rental often shows a tax loss while cash-flowing — sheltering income. Rental losses are passive: they offset passive income freely, and up to $25,000/yr can offset ordinary (W-2) income if you actively participate and your MAGI is under $100k (phasing out to $0 by $150k); unused losses carry forward. On sale, claimed depreciation is recaptured at up to 25%, and gains may owe capital-gains tax (a 1031 exchange can defer both). Figures are a year-1 estimate at your 24.0% rate — not tax advice; consult a CPA.
Schools (NCES district)
- District
- Vincennes Community School Corporation
- NCES district ID
- 1812120
- Math proficiency
- 34% ▼ -5.00%
- Reading proficiency
- 38% ▼ -4.00%
- Median HH income
- $38,359
- Composite
- 30.05/100
- National rank
- #6354
- State rank
- #193 of 301 in IN
Livability — Vincennes
- Score
- 70/100
- State rank
- #148
- US rank
- #7480
Category grades
Schools grade is shown separately in the Schools card above.
Census & demographics
- Census place
- Vincennes, IN
- Population (ZIP)
- 25,191
Population outlook (Knox County) Hauer SSP2
- Today (2025)
- 37,092 people
- By 2030
- 36,271 · -2.2%
- By 2040
- 34,196 · -7.8%
- By 2050
- 32,405 · -12.6%
- By 2075
- 28,754 · -22.5%
- By 2100
- 24,110 · -35.0%
Race, ethnicity, and origin ACS 2023
- Neighborhood character
- Predominantly White (88%)
- Race & ethnicity
- White 88% Two or more races 6% Hispanic / Latino 3% Black 2% Asian 1%
- Common ancestry
- Lithuanian 4% Romanian 2% Slovak 2%
- Foreign-born
- 3% · Canada, China
- Languages at home
- 95% English-only · Spanish 2% French/Haitian/Cajun 1% Chinese 1%
Political lean MEDSL · Knox
- 2024 margin
- Solid R (+50.4) · D 24.0% · R 74.4% · Other 1.6%
- 2008→2024 swing
- -43.9pp toward R · 2008: -6.5pp · 2024: -50.4pp
- All cycles
- 2024: R+50.4 2020: R+47.4 2016: R+47.2 2012: R+28.9 2008: R+6.5
Not yet ingested
- Civics
- —
Market trends
- HPI YoY
- ▼ -47.26%
- Current HPI
- 194.903
- Rent YoY
- —
- Metro
- —
- State GDP YoY
- ▲ 2.90%
- F500 in state
- 18
Industry mix (Fortune 500 HQ in IN)
| Industry | F500 HQs | Revenue |
|---|---|---|
| Industrial Machinery | 2 | $37B |
|
||
| Healthcare | 1 | $177B |
|
||
| Pharmaceuticals | 1 | $45B |
|
||
| Metals / Steel | 1 | $18B |
|
||
| Agriculture | 1 | $17B |
|
||
| Packaging | 1 | $12B |
|
||
Price history
+268.6% since first listed5 events — show timeline
- 2026-06-02 Price Changed $99,900 IRMLS
- 2026-05-13 Listed $104,900 IRMLS
- 2017-08-10 Sold (MLS) $19,000 IRMLS
- 2017-01-27 Listed $19,900 IRMLS
- 2016-10-06 Listed $27,100 IRMLS
Property tax history
+5.4%/yrLatest (2024): $1,366 · -1.7% YoY. Source: county tax records.
Cash-flow waterfall
monthlySold comps — $/sqft
last 12 mo · ≤1 miLoading sold comps…