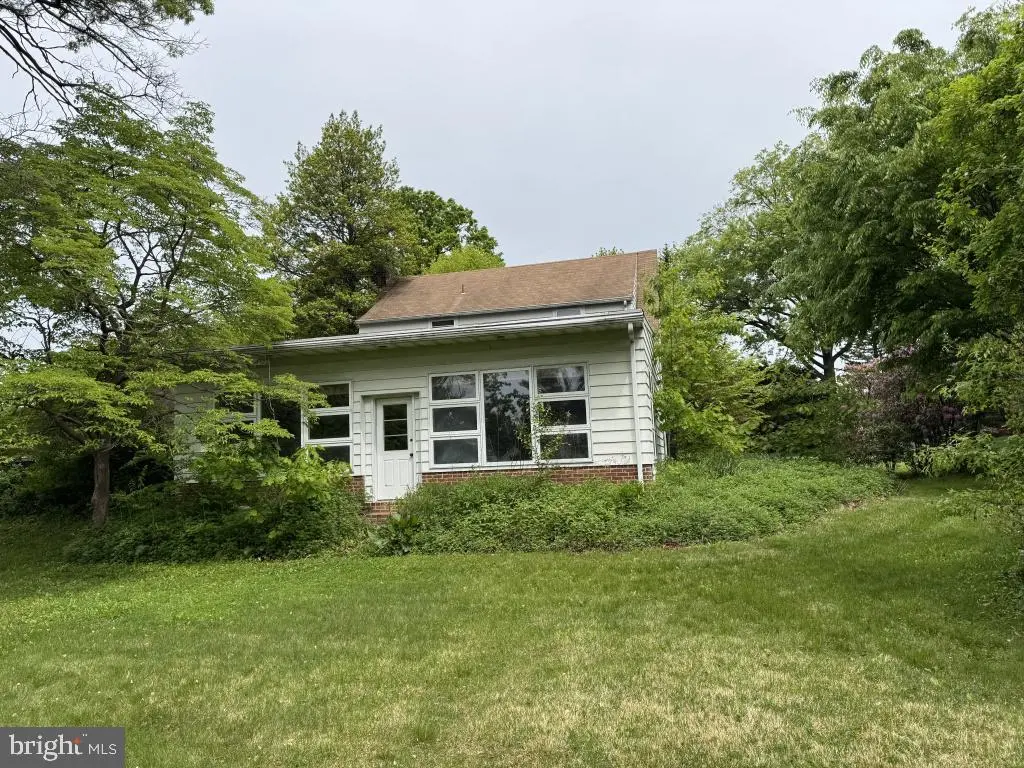
1996 Park Plz · Manheim, PA
Flood risk 1/10 · Minimal
- FEMA flood zone
- X (unshaded)
- Chance of flooding over 30 yrs
- 0.0%
- Est. flood insurance / yr
- $473 – $860
Fire risk 1/10 · Minimal
- Est. fire insurance / yr
- $511 – $949
Heat risk 5/10 · Moderate
- Hot days now (above 101°F)
- 7 days/yr
- Hot days in 30 yrs
- 14 days/yr
Wind risk 4/10 · Minor
- Chance of severe wind over 30 yrs
- 16.0%
Air-quality risk 4/10 · Minor
- Unhealthy air days now
- 4 days/yr
- Unhealthy air days in 30 yrs
- 6 days/yr
Risk factors via First Street. Map © Google.
Why this score? — see what drove the D+ grade
The composite is a weighted blend of 9 inputs, each scored 0–100. Each bar is that input's sub-score; the figure is the points it added to the 100-point composite (weight × sub-score).
- ARV discount +15.0/15.0
- Cash flow +11.5/30.0
- Schools +5.3/10.0
- Livability +4.0/5.0
- 1% rule +3.6/10.0
- Rent growth +3.5/5.0
- DSCR +3.4/10.0
- Condition / age +2.5/5.0
- Appreciation +0.0/10.0
$300,000
🖨 Deal sheet 📄 Offer letter ✓ Due diligence
Listing remarks
This property will be offered at Public Auction on Tuesday, June 30, 2026 @ 6pm. The listing price is the opening bid only and in no way reflects the final sale price. 10% down due at auction, 2% transfer tax to be paid by the purchaser, real estate taxes prorated. This spacious three-bedroom home offers a well-designed layout with generous living spaces throughout. The main floor features an eat-in kitchen, formal dining room, convenient powder room, and a large family room highlighted by a cozy fireplace. An additional oversized great room with beautiful brick flooring provides the perfect space for entertainment, gatherings, or relaxing. The second floor includes three bedrooms, includin
Key facts
- 0.51 acre lot
- Garage
- Built 1947
Property features AI
Finance
- Other: Fee simple ownership; Total below-grade area listed as 2442 (source: assessor); Above-grade finished area listed as 2,442 (source: assessor); Below-grade unfinished area listed as 2,442 (estimated)
Exterior
- Parking: Detached garage (front entry) with 1 garage space; Driveway with 2 parking spaces; Total of 3 garage/parking spaces
- Utilities: Public water; Public sewer; Municipal trash service
- Home design: Detached property; Below average condition
- Construction: Frame, brick and masonry construction; Composite/shingle roof; Permanent foundation; Garage(s); Above-grade and below-grade structures; Year built per assessor
- Exterior features: Not located in a federal flood zone; 2+ access exits
Interior
- Kitchen: Eat-in kitchen
- Bedrooms: Three bedrooms on the upper level
- Bathrooms: One full bathroom (upper level); One half bathroom (main level)
- Heating & cooling: Forced air heating; Oil-fired heating; Electric hot water
- Interior features: Attic; Formal separate dining room; Eat-in kitchen; Walk-in closet(s); Basement laundry
- Laundry & utility: Laundry in basement
Neighborhood map
What this means for you Summary
Snapshot
- This is a 3-bed/1.5-bath single-family listed at $300k.
Deal economics
- At list price, monthly cash flow is $-100 ($-1k/yr) — negative.
- To cash-flow at today's rent, offer at most $282k (5.9% below list).
- To meet the 1% rule (rent ≥ 1% of price), the offer needs to be $258k (14.0% below list).
- Recommended offer: $258k (14.0% below list) — sets the bar for 1% rule.
- Cap rate 5.9% vs local median 1.5% in Manheim — top-decile yield for the area; either an underpriced asset or a hidden risk that comps aren't pricing in. Stress-test before assuming the spread holds.
Location & tenants
- Location reads 79/100 on livability (#236 in PA, #2,155 nationally) — a middle-class / working-renter tenant base. Strengths: cost of living A+, housing A+, health & safety A+; Watch: amenities D+, commute F.
- Manheim Township SD (suburban): math 53% / reading 68% proficiency, ranked #61 of 539 in PA (top 11%) — acceptable for families but not a draw, mixed tenant base, ~2y average lease.
- Zoned schools: Manheim Twp Ms (math 34% / reading 63%, grade C-, #146 of 512 statewide, top 30%, 955 students, 32% FRL).
- Zoned-school proficiency averages 48% at this address vs 60% district-wide (-12 pts) — the specific schools serving this property underperform the Manheim Township SD average; the district grade overstates school quality for this exact location.
- Market conditions: Rents rising (+4.0%/yr); 321 active listings in the ZIP; 2 comparable units currently listed for rent nearby; solid renter incomes; 1,093 units permitted in Lancaster County in 2024 (201 in 5+ unit buildings).
- This rent runs 30% of the median local income ($102k/yr) — at the standard rent-burdened threshold; future hikes will face affordability resistance.
Forward outlook
- Local home prices are declining (-3.0%/yr); year-one equity from $2k of loan paydown is wiped out by about $9k of value loss. Plan a longer hold.
- Lancaster County population projected at +5% by 2050 — modest demand growth; plan on rents tracking national, not racing it.
Negotiation context
- Only 14 days on market — expect competitive offers; lowballing is unlikely to land.
Risks & watch-outs
- Watch-outs: built in 1947 — expect roof / HVAC / electrical / plumbing capex.
- Climate carrying-cost: extreme-heat days projected 7→14/yr by 2055 (HVAC capex compounding) — expect insurance premiums to compound above CPI over the hold.
Questions for the listing agent
- What do current leases actually rent for vs. the listed asking? Can we see a recent rent roll and the last 12 months of T-12 income?
- Built in 1947 — when were the roof, HVAC, electrical panel, plumbing, and water heater last replaced?
- Is there a deadline driving the sale (1031 exchange, divorce, estate, relocation)? That informs how much negotiation room exists.
- Schools are B-rated — typically a magnet for longer-tenancy family renters. What's the average tenant stay here, and is there a school-zone premium baked into asking?
- The area grade is low — what's the realistic commute time and amenity access for the typical tenant pool here? Any planned neighborhood developments (good or bad) we should know about?
- What's the average days-on-market for RENTAL listings here right now (not sales)? A rising rental-DOM trend means longer vacancies and softer asking-rent achievability than the comps imply.
- What's the recent tenant-quality profile in this submarket — average credit score on applications, eviction rate, late-payment / NSF rate, and stable-employment percentage? A property-management company in the area should have these aggregated.
- How much new for-sale + rental construction is in the pipeline within 1–3 miles? Heavy new supply typically softens prices + rents 12–24 months out; constrained supply supports both.
Investment metrics
- 1% rule
- 0.86% ✗
- Cap rate
- 5.89%
- Cash-on-cash
- -1.43%
- DSCR
- 0.94
- GRM
- 9.7
CMA / ARV
- ARV (on-the-fly)
- $520,146
- Comps found
- 12
Show comp detail 12 sales within ~0.75 mi
| Address | Dist | Beds/Ba | Sqft | Sold | Price | $/sf | Match |
|---|---|---|---|---|---|---|---|
| 1980 Park Plz | 0.12mi | 3/2.0 | 2,321 (-5%) | 8mo | $430,000 | $185 | 77 |
| 1821 Santa Barbara Dr | 0.27mi | 3/2.5 | 2,382 (-2%) | 4mo | $450,000 | $189 | 76 |
| 2012 Melody Ln | 0.34mi | 4/2.5 (+1) | 2,341 (-4%) | 2mo | $615,000 | $263 | 66 |
| 41 Hess Blvd | 0.48mi | 3/2.0 | 2,412 (-1%) | 12mo | $503,500 | $209 | 64 |
| 406 Teddy Ave | 0.63mi | 4/2.5 (+1) | 2,464 (+1%) | 4mo | $503,000 | $204 | 57 |
| 340 Primrose Ave | 0.45mi | 4/2.5 (+1) | 2,650 (+8%) | 2mo | $415,000 | $157 | 55 |
| 435 Primrose Ave | 0.61mi | 3/2.5 | 2,331 (-4%) | 9mo | $507,000 | $218 | 53 |
| 409 Rhoda Dr | 0.55mi | 4/2.5 (+1) | 2,518 (+3%) | 10mo | $580,000 | $230 | 52 |
| 1958 Geraldson Dr | 0.49mi | 4/2.5 (+1) | 2,268 (-7%) | 7mo | $350,000 | $154 | 50 |
| 1863 Harrington Dr | 0.73mi | 4/2.5 (+1) | 2,535 (+4%) | 3mo | $540,000 | $213 | 48 |
| 1916 Geraldson Dr | 0.40mi | 4/2.5 (+1) | 2,126 (-13%) | 6mo | $525,000 | $247 | 46 |
| 316 Primrose Ave | 0.37mi | 4/2.5 (+1) | 2,087 (-14%) | 11mo | $526,500 | $252 | 40 |
Match score weights: distance 35% · size 25% · config 20% · recency 20%. Top-matched comps best support the ARV.
Projected returns pro-forma
-3.0% appreciation · 3.99% rent growth · sell at horizon
- IRR
- -17.5%
- Equity multiple
- 0.38×
- Total profit
- $-52,307
- Equity at exit
- $44,731
- IRR
- -7.7%
- Equity multiple
- 0.49×
- Total profit
- $-42,558
- Equity at exit
- $25,939
Cash invested: $84,000 (down + closing). Projections, not guarantees.
Landlord ↔ Tenant lean methodology
- Overall (STATE)
- 62 Landlord-Friendly
- State Pennsylvania
- 62 Landlord-Friendly · EVEN
- County
- — inherits STATE
- City
- — inherits STATE
ZIP-level market 17601
- Rents YoY
- 4.0%
- Active inventory
- 321
- Price-to-rent
- 9.7×
Monthly cashflow live
- Estimated rent
- $2,581 medium interval (Pro) →
- Mortgage (P&I)
- −$1,573
- Tax from tax record
- −$440 /mo · $5,285/yr
- Insurance
- −$125
- HOA
- −$0
- Vacancy / Maint / Mgmt
- −$542
- Net cashflow
- $-100
Break-even live
UW: 25.0% down · 7.5% · 30yr · 1.5% tax · 5.0% vac · 8.0% maint · 8.0% mgmt
Financing live
Cash to close
- Down payment
- $75,000
- Closing costs
- $9,000
- Reserves months
- —
- Total cash needed
- —
Loan-product check · same deal, 3 products live
Conventional
25% down · 7.5% · 30yr
- Down + closing
- —
- Monthly P&I
- —
- Monthly cashflow
- —
- DSCR
- —
- Eligible?
- —
Personal DTI + credit; lowest rate.
DSCR
20% down · 8.5% · 30yr
- Down + closing
- —
- Monthly P&I
- —
- Monthly cashflow
- —
- DSCR
- —
- Eligible?
- —
No personal income docs; deal must DSCR.
Hard money
10% down · 12.0% · 12mo
- Down + closing
- —
- Monthly P&I
- —
- Monthly cashflow
- —
- DSCR
- —
- Eligible?
- —
Short-term bridge; refi at stabilization.
Rent comps 2 comps
| Address | Beds | Baths | Sqft | Rent | $/sqft | DOM | Units | Dist |
|---|---|---|---|---|---|---|---|---|
| 520 Hedgerow Ln Lancaster, PA | 4.0 | 2.5 | 1834 | $2,900 | $1.58 | 43d | 1 | 0.61mi |
| 2686 Lititz Pike Lancaster, PA | 4.0 | 3.0 | 1700 | $2,575 | $1.51 | 23d | 1 | 1.46mi |
Listing history 12 events
-
2026-06-18days on market $300,000 Coming Soon 14 DOM
-
2026-06-17days on market $300,000 Coming Soon 13 DOM
-
2026-06-16days on market $300,000 Coming Soon 12 DOM
-
2026-06-15days on market $300,000 Coming Soon 11 DOM
-
2026-06-14days on market $300,000 Coming Soon 9 DOM
-
2026-06-13days on market $300,000 Coming Soon 8 DOM
-
2026-06-10days on market $300,000 Coming Soon 6 DOM
-
2026-06-09days on market $300,000 Coming Soon 5 DOM
-
2026-06-08days on market $300,000 Coming Soon 4 DOM
-
2026-06-07days on market $300,000 Coming Soon 3 DOM
-
2026-06-05remarks 699-char remark
-
2026-06-05$300,000 Coming Soon 1 DOM
ⓘ Source: listings_history table (triggers on properties + properties_extension) + one-shot
backfill from property_details.listing_events for pre-trigger history.
Tax reassessment forecast PA · Partial reset (capped growth)
- Current annual tax
- $5,285 · $440/mo
- Projected year-2 tax
- $5,285 · $440/mo
- Expected delta
- $0/yr ($0/mo · 0.0%)
ⓘ Screening estimate from a state-policy table — verify with the county assessor before closing.
Climate risk First Street
- Flood 1/10 Low FEMA zone X (unshaded) · 0% chance over 30 yrs
- Wildfire 1/10 Low
- Heat 5/10 Major 7 d/yr ≥101°F today · 14 d/yr by 30 yrs out
- Wind 4/10 Moderate 16% chance of damaging wind over 30 yrs
- Air quality 4/10 Moderate 4 unhealthy d/yr today · 6 by 30 yrs out
Nearby sold comps map
Loading sold comps map…
Walkable amenities ~0.75 mi
Loading nearby amenities…
Taxation est. · year 1
- Rental income
- $30,967
- − Mortgage interest
- −$16,805
- − Property taxes
- −$5,285
- − Insurance
- −$1,500
- − Repairs & maintenance
- −$2,477
- − Management
- −$2,477
- − Depreciation
- −$8,727
- Taxable loss
- −$6,305
- Est. tax savings @ 24.0%
- +$1,513
- After-tax cash flow
- $313/yr
For passive investors: Depreciation is non-cash, so a rental often shows a tax loss while cash-flowing — sheltering income. Rental losses are passive: they offset passive income freely, and up to $25,000/yr can offset ordinary (W-2) income if you actively participate and your MAGI is under $100k (phasing out to $0 by $150k); unused losses carry forward. On sale, claimed depreciation is recaptured at up to 25%, and gains may owe capital-gains tax (a 1031 exchange can defer both). Figures are a year-1 estimate at your 24.0% rate — not tax advice; consult a CPA.
Schools (NCES district)
- District
- Manheim Township SD
- NCES district ID
- 4214580
- Math proficiency
- 53% ▼ -10.00%
- Reading proficiency
- 68% ▼ -11.00%
- Median HH income
- $68,335
- Composite
- 53.18/100
- National rank
- #1506
- State rank
- #61 of 539 in PA
Livability — Manheim
- Score
- 79/100
- State rank
- #236
- US rank
- #2155
Category grades
Schools grade is shown separately in the Schools card above.
Census & demographics
- County
- Lancaster County · 390,309 people
- City population
- 23,556
- Metro
- Lancaster, PA
- Population (ZIP)
- 56,382
- Household income
- $102,435
- Rent vs Own
- Severe rent burden
- 1296.0
Population outlook (Lancaster County) Hauer SSP2
- Today (2025)
- 561,011 people
- By 2030
- 570,969 · +1.8%
- By 2040
- 585,929 · +4.4%
- By 2050
- 591,056 · +5.4%
- By 2075
- 594,747 · +6.0%
- By 2100
- 558,850 · -0.4%
Race, ethnicity, and origin ACS 2023
- Neighborhood character
- Predominantly White (78%)
- Race & ethnicity
- White 78% Hispanic / Latino 10% Two or more races 7% Asian 6% Black 4%
- Hispanic origin (detail)
- Puerto Rican 5%
- Common ancestry
- Romanian 5% Slovak 2% Lithuanian 2%
- Foreign-born
- 9% · Canada, Vietnam, China
- Languages at home
- 86% English-only · Spanish 5% Other Indo-European 2% French/Haitian/Cajun 1%
Political lean MEDSL · Lancaster
- 2024 margin
- R (+15.9) · D 41.5% · R 57.5%
- 2008→2024 swing
- -4.1pp toward R · 2008: -11.8pp · 2024: -15.9pp
- All cycles
- 2024: R+15.9 2020: R+15.8 2016: R+19.7 2012: R+19.2 2008: R+11.8
Not yet ingested
- Civics
- —
Market trends
- HPI YoY
- ▼ -383.04%
- Current HPI
- 257.0336
- Rent YoY
- ▲ 3.99%
- Metro
- Lancaster, PA
- State GDP YoY
- ▲ 1.68%
- F500 in state
- 34
Industry mix (Fortune 500 HQ in PA)
| Industry | F500 HQs | Revenue |
|---|---|---|
| Healthcare | 2 | $309B |
|
||
| Insurance | 2 | $27B |
|
||
| Telecommunications / Media | 1 | $124B |
|
||
| Industrial Distribution | 1 | $22B |
|
||
| Financial Services | 1 | $20B |
|
||
| Chemicals / Materials | 1 | $18B |
|
||
Price history
1 event — show timeline
- 2026-06-04 Coming Soon $300,000 BRIGHT MLS
Property tax history
+2.5%/yrLatest (2026): $5,285 · +6.5% YoY. Source: county tax records.
Cash-flow waterfall
monthlySold comps — $/sqft
last 12 mo · ≤1 miLoading sold comps…