40 Fleetwood Unit 6-G · Mount Vernon, NY
Flood risk 6/10 · Moderate
- FEMA flood zone
- X (unshaded)
- Chance of flooding over 30 yrs
- 0.74%
- Est. flood insurance / yr
- $507 – $1,088
Fire risk 1/10 · Minimal
- Est. fire insurance / yr
- $691 – $1,283
Heat risk 6/10 · Moderate
- Hot days now (above 98°F)
- 7 days/yr
- Hot days in 30 yrs
- 15 days/yr
Wind risk 6/10 · Moderate
- Chance of severe wind over 30 yrs
- 27.0%
Air-quality risk 5/10 · Moderate
- Unhealthy air days now
- 6 days/yr
- Unhealthy air days in 30 yrs
- 8 days/yr
Risk factors via First Street. Map © Google.
Why this score? — see what drove the C grade
The composite is a weighted blend of 9 inputs, each scored 0–100. Each bar is that input's sub-score; the figure is the points it added to the 100-point composite (weight × sub-score).
- Cash flow +21.8/30.0
- ARV discount +7.5/15.0
- 1% rule +7.2/10.0
- DSCR +7.0/10.0
- Rent growth +4.3/5.0
- Schools +3.7/10.0
- Livability +3.6/5.0
- Condition / age +2.5/5.0
- Appreciation +0.0/10.0
$225,000
🖨 Deal sheet 📄 Offer letter ✓ Due diligence
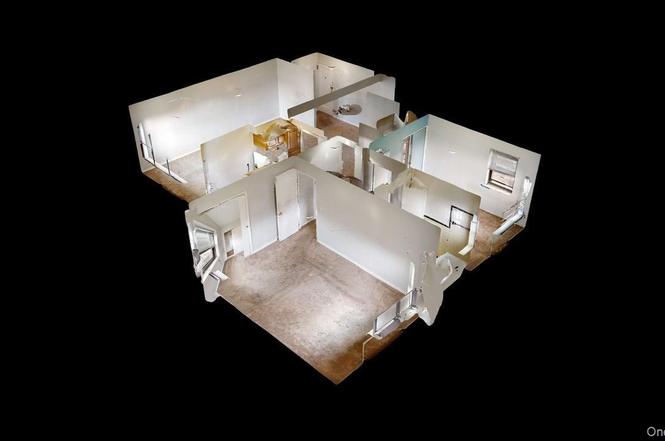
Listing remarks
Must see this large two bedroom apartment in the heart of Fleetwood. Apartment features 2 large bedrooms, oversized living room, updated kitchen, bath and beautiful hardwood floors. Complex features park benches outside, elevator, full time superintend and is just two blocks from the Fleetwood Metro North Rail Road. Maintenance includes heat, water, gas and full-time super/porter and snow removal. Maintenance qualifies for Star Rebate per month for owner occupied apartments. Walking distance to Fleetwood RR station, a 24-minute ride to NYC Grand Central Station. Walking distance to Fleetwood with shops, restaurants, cafes, post office, CVS & 3 banks. The NY Times called Fleetwood &quo
Key facts
- Elevator
- Updated kitchen
- $257 HOA
Tags
Neighborhood map
What this means for you Summary
Snapshot
- This is a 2-bed/1.0-bath condo listed at $225k.
Deal economics
- At list price, monthly cash flow is $348 ($4k/yr) — positive.
- The deal already cash-flows at list — no discount required.
- Meets the 1% rule at list price ($3k rent vs $225k).
- Recommended offer: $212k (6.0% below list) — sets the bar for market timing.
- Cap rate 8.1% vs local median 5.3% in Mount Vernon — top-decile yield for the area; either an underpriced asset or a hidden risk that comps aren't pricing in. Stress-test before assuming the spread holds.
Location & tenants
- Location reads 71/100 on livability (#397 in NY) — a middle-class / working-renter tenant base. Strengths: commute A+, health & safety A, employment B; Watch: crime D-, cost of living F.
- Mount Vernon School District (suburban): math 35% / reading 50% proficiency, ranked #485 of 590 in NY (top 82%) — families likely to look elsewhere, expect single-tenant / working-renter base with shorter leases; 62% free/reduced lunch — lower-income household profile, screen leases tightly.
- Zoned schools: Pennington School (math 42% / reading 62%, grade C-, #988 of 2,108 statewide, top 49%, 426 students, 45% FRL); Mount Vernon High School (math 54% / reading 75%, grade B-, #776 of 1,100 statewide, top 73%, 1,094 students, 76% FRL) — zoned schools at 60% FRL track the district average.
- Zoned-school proficiency averages 58% at this address vs 42% district-wide (+16 pts) — the actual schools serving this property are materially stronger than the Mount Vernon School District average implies; a family-tenant draw the district grade alone would hide.
- Market conditions: Rents rising fast (+7.0%/yr); 125 active listings in the ZIP; 37 comparable units currently listed for rent nearby; rentals at typical pace (median 25d on market — plan ~3-4 weeks tenant-placement turnaround); solid renter incomes; 954 units permitted in Westchester County in 2024 (649 in 5+ unit buildings).
Forward outlook
- Local home prices are declining (-3.0%/yr); year-one equity from $2k of loan paydown is wiped out by about $7k of value loss. Plan a longer hold.
- Westchester County population projected at +10% by 2050 — modest demand growth; plan on rents tracking national, not racing it.
- At projected returns (-3.0% appreciation + 7.0% rent growth), your $63k cash investment doubles in ~9 years — after that, you're playing with house money.
Negotiation context
- It's been on market 75 days — a 6% lower offer ($212k) is reasonable based on typical stale-listing flexibility.
- 2 sale attempts with the ask held roughly flat each time — persistent listings suggest the price (not the market) is what's stuck; bring a comps-based counter.
Risks & watch-outs
- Watch-outs: built in 1929 — expect roof / HVAC / electrical / plumbing capex.
- Climate carrying-cost: major flood risk; major wind risk, 27% chance of damaging wind over 30y; extreme-heat days projected 7→15/yr by 2055 (HVAC capex compounding) — expect insurance premiums to compound above CPI over the hold.
Questions for the listing agent
- It's been on market 75 days. Have you received any prior offers? Is the seller open to a 6% concession, seller financing, or rate buy-down credit?
- Built in 1929 — when were the roof, HVAC, electrical panel, plumbing, and water heater last replaced?
- What does the HOA fee cover, when was the last increase, and are there any pending special assessments or reserve-fund shortfalls?
- Any open or pending special assessments — roof, HVAC, plumbing, elevator, façade? What's the per-unit balance and payoff schedule, and is the seller paying it off at close or rolling it to the buyer?
- Why hasn't it sold? Are there any deal-killer items the seller is aware of (foundation, flood, title, zoning, code violations)?
- Is there a deadline driving the sale (1031 exchange, divorce, estate, relocation)? That informs how much negotiation room exists.
- Crime grade is D in this area — have there been break-ins, vandalism, or insurance claims at this property in the last 3 years? What carrier currently insures it and at what premium?
- What's the average days-on-market for RENTAL listings here right now (not sales)? A rising rental-DOM trend means longer vacancies and softer asking-rent achievability than the comps imply.
- What's the recent tenant-quality profile in this submarket — average credit score on applications, eviction rate, late-payment / NSF rate, and stable-employment percentage? A property-management company in the area should have these aggregated.
- How much new apartment / multifamily construction is in the pipeline within 1–3 miles? Heavy new supply (>2% of stock underway) typically softens rents 12–24 months out; light construction supports rent growth.
Investment metrics
- 1% rule
- 1.22% ✓
- Cap rate
- 8.15%
- Cash-on-cash
- 6.63%
- DSCR
- 1.30
- GRM
- 6.9
CMA / ARV
No comps found within radius.
Projected returns pro-forma
-3.0% appreciation · 7.04% rent growth · sell at horizon
- IRR
- -1.0%
- Equity multiple
- 0.96×
- Total profit
- $-2,518
- Equity at exit
- $33,548
- IRR
- 13.0%
- Equity multiple
- 2.25×
- Total profit
- $78,760
- Equity at exit
- $19,454
Cash invested: $63,000 (down + closing). Projections, not guarantees.
Landlord ↔ Tenant lean methodology
- Overall (STATE)
- 15 Strongly Tenant-Friendly
- State New York
- 15 Strongly Tenant-Friendly · D+10
- County
- — inherits STATE
- City
- — inherits STATE
ZIP-level market 10552
- Rents YoY
- 7.0%
- Active inventory
- 125
- Price-to-rent
- 6.9×
Monthly cashflow live
- Estimated rent
- $2,734 high interval (Pro) →
- Mortgage (P&I)
- −$1,180
- Tax est. 1.5%
- −$281 /mo · $3,375/yr
- Insurance
- −$94
- HOA
- −$257
- Vacancy / Maint / Mgmt
- −$574
- Net cashflow
- $348
Break-even live
UW: 25.0% down · 7.5% · 30yr · 1.5% tax · 5.0% vac · 8.0% maint · 8.0% mgmt
Financing live
Cash to close
- Down payment
- $56,250
- Closing costs
- $6,750
- Reserves months
- —
- Total cash needed
- —
Loan-product check · same deal, 3 products live
Conventional
25% down · 7.5% · 30yr
- Down + closing
- —
- Monthly P&I
- —
- Monthly cashflow
- —
- DSCR
- —
- Eligible?
- —
Personal DTI + credit; lowest rate.
DSCR
20% down · 8.5% · 30yr
- Down + closing
- —
- Monthly P&I
- —
- Monthly cashflow
- —
- DSCR
- —
- Eligible?
- —
No personal income docs; deal must DSCR.
Hard money
10% down · 12.0% · 12mo
- Down + closing
- —
- Monthly P&I
- —
- Monthly cashflow
- —
- DSCR
- —
- Eligible?
- —
Short-term bridge; refi at stabilization.
Rent comps 37 comps
| Address | Beds | Baths | Sqft | Rent | $/sqft | DOM | Units | Dist |
|---|---|---|---|---|---|---|---|---|
| 33 William St Mount Vernon, NY | 1.0–2.0 | 1.0 | 725 | $2,675 | $3.69 | 22d | 2 | 0.02mi |
| 669 N Terrace Ave Mount Vernon, NY | 1.0 | 1.0 | 750 | $2,031 | $2.71 | 24d | 1 | 0.14mi |
| 645 N MacQuesten Pkwy Unit 3G Mt Vernon, NY | 2.0 | 1.0 | 950 | $3,195 | $3.36 | 24d | 1 | 0.15mi |
| 80 W Grand St Mount Vernon, NY | 1.0 | 1.0 | 850 | $1,942 | $2.28 | 24d | 1 | 0.21mi |
| 42 Broad St W Mount Vernon, NY | 3.0 | 1.0–2.0 | 955 | $3,199 | $3.35 | 2d | 16 | 0.22mi |
| 42 Broad St W Mount Vernon, NY | 3.0 | 1.0–2.0 | 1014 | $5,080 | $5.01 | 24d | 15 | 0.22mi |
| 12 Putnam St Mount Vernon, NY | 2.0 | 1.0 | 950 | $2,600 | $2.74 | 24d | 1 | 0.34mi |
| 230 N 7th Ave Unit 2 Mt Vernon, NY | 1.0 | 1.0 | 950 | $2,300 | $2.42 | 10d | 1 | 0.42mi |
| 671 Bronx River Rd Unit 3A Yonkers, NY | 2.0 | 1.5 | 950 | $3,000 | $3.16 | 24d | 1 | 0.43mi |
| 173 Crary Ave Mount Vernon, NY | 3.0 | 2.0 | 1100 | $3,100 | $2.82 | 24d | 1 | 0.45mi |
| 200 Crescent Pl Unit 2nd fl Yonkers, NY | 1.0 | 1.0 | 800 | $2,300 | $2.88 | 16d | 1 | 0.46mi |
| 103 North St Mount Vernon, NY | 1.0 | 1.0 | 720 | $1,900 | $2.64 | 20d | 1 | 0.49mi |
| 14 Elm St Unit 2 Mt Vernon, NY | 2.0 | 1.0 | 1000 | $2,800 | $2.80 | 24d | 1 | 0.63mi |
| 148 Claremont Ave Mount Vernon, NY | 2.0 | 1.0 | 960 | $2,400 | $2.50 | 19d | 1 | 0.75mi |
| 86 Edgewood Ave Unit 2W Yonkers, NY | 2.0 | 1.0 | 1000 | $2,699 | $2.70 | 43d | 1 | 0.75mi |
| 86 Edgewood Ave Apt 2E Yonkers, NY | 2.0 | 1.0 | 1000 | $2,599 | $2.60 | 19d | 1 | 0.75mi |
| 32 N Bond St Mount Vernon, NY | 1.0 | 1.0 | 850 | $1,900 | $2.24 | 7d | 1 | 0.80mi |
| 18 N Bond St Unit 3D Mt Vernon, NY | 1.0 | 1.0 | 750 | $2,000 | $2.67 | 24d | 1 | 0.83mi |
| 13 N Bond St Mount Vernon, NY | 1.0 | 1.0 | 600 | $1,785 | $2.98 | 24d | 1 | 0.85mi |
| 495 Kimball Ave Unit First Floor Yonkers, NY | 2.0 | 1.0 | 1100 | $3,000 | $2.73 | 43d | 1 | 0.93mi |
| 118 N Columbus Ave Mount Vernon, NY | 1.0 | 1.0 | 650 | $1,700 | $2.62 | 24d | 1 | 0.95mi |
| 112 N Columbus Ave Unit 2 Mt Vernon, NY | 2.0 | 2.0 | 900 | $2,997 | $3.33 | 19d | 1 | 0.95mi |
| 20 Overhill Pl Unit 3 Yonkers, NY | 2.0 | 1.0 | 800 | $3,000 | $3.75 | 43d | 1 | 0.96mi |
| 173 Washington St Unit 1 Mt Vernon, NY | 3.0 | 2.0 | 1100 | $3,000 | $2.73 | 24d | 1 | 0.98mi |
| 28 Tunis Ave Unit 2 Yonkers, NY | 2.0 | 1.0 | 900 | $3,000 | $3.33 | 43d | 1 | 1.03mi |
| 51 Parkway Rd Apt 3 Bronxville, NY | 1.0 | 1.0 | 1100 | $3,100 | $2.82 | 24d | 1 | 1.06mi |
| 142 Trenchard St Unit 2E Yonkers, NY | 1.0 | 1.0 | 900 | $2,250 | $2.50 | 11d | 1 | 1.10mi |
| 119 S 11th Ave Unit 1 Mt Vernon, NY | 2.0 | 1.0 | 700 | $2,800 | $4.00 | 11d | 1 | 1.11mi |
| 150 S 6th Ave Unit 2 Mt Vernon, NY | 1.0 | 1.0 | 800 | $2,500 | $3.12 | 17d | 1 | 1.11mi |
| 150 S 6th Ave Unit 2 Mt Vernon, NY | 1.0 | 1.0 | 800 | $2,500 | $3.12 | 7d | 1 | 1.11mi |
| 2325 Cortlandt St Unit 4 Mt Vernon, NY | 2.0 | 1.0 | 700 | $2,300 | $3.29 | 24d | 1 | 1.13mi |
| 119 S 13th Ave Mount Vernon, NY | 2.0 | 1.0 | 800 | $2,997 | $3.75 | 13d | 1 | 1.16mi |
| 7 Monroe St Unit 3A Mt Vernon, NY | 2.0 | 1.0 | 600 | $2,200 | $3.67 | 19d | 1 | 1.24mi |
| 257 S 2nd Ave Mount Vernon, NY | 1.0 | 1.0 | 800 | $2,250 | $2.81 | 24d | 1 | 1.27mi |
| 255 Bronx River Rd Unit 4R Yonkers, NY | 1.0 | 1.0 | 800 | $2,250 | $2.81 | 24d | 1 | 1.27mi |
| 635 E Lincoln Ave Mount Vernon, NY | 2.0 | 1.0 | 1000 | $3,150 | $3.15 | 7d | 1 | 1.33mi |
| 216 1st St Unit 1 Yonkers, NY | 1.0 | 1.0 | 600 | $2,000 | $3.33 | 43d | 1 | 1.41mi |
HOA detail condo
- Monthly dues
- $257 · $3,084/yr
- Likely covers
- watergassnow removal
- Assessments
- None detected in remarks — confirm with the listing agent.
Listing history 4 events
-
2026-03-10status Pending
-
2026-01-16status Active
-
2025-08-27status Pending
-
2025-08-05$225,000 Active
ⓘ Source: listings_history table (triggers on properties + properties_extension) + one-shot
backfill from property_details.listing_events for pre-trigger history.
Climate risk First Street
- Flood 6/10 Major FEMA zone X (unshaded) · 74% chance over 30 yrs
- Wildfire 1/10 Low
- Heat 6/10 Major 7 d/yr ≥98°F today · 15 d/yr by 30 yrs out
- Wind 6/10 Major 27% chance of damaging wind over 30 yrs
- Air quality 5/10 Major 6 unhealthy d/yr today · 8 by 30 yrs out
Nearby sold comps map
Loading sold comps map…
Walkable amenities ~0.75 mi
Loading nearby amenities…
Taxation est. · year 1
- Rental income
- $32,812
- − Mortgage interest
- −$12,603
- − Property taxes
- −$3,375
- − Insurance
- −$1,125
- − Repairs & maintenance
- −$2,625
- − Management
- −$2,625
- − HOA
- −$3,084
- − Depreciation
- −$6,545
- Taxable income
- $829
- Est. tax owed @ 24.0%
- −$199
- After-tax cash flow
- $3,979/yr
For passive investors: Depreciation is non-cash, so a rental often shows a tax loss while cash-flowing — sheltering income. Rental losses are passive: they offset passive income freely, and up to $25,000/yr can offset ordinary (W-2) income if you actively participate and your MAGI is under $100k (phasing out to $0 by $150k); unused losses carry forward. On sale, claimed depreciation is recaptured at up to 25%, and gains may owe capital-gains tax (a 1031 exchange can defer both). Figures are a year-1 estimate at your 24.0% rate — not tax advice; consult a CPA.
Schools (NCES district)
- District
- Mount Vernon School District
- NCES district ID
- 3620100
- Math proficiency
- 35% ▼ -3.00%
- Reading proficiency
- 50% ▲ 6.00%
- Median HH income
- $50,890
- Composite
- 36.59/100
- National rank
- #4631
- State rank
- #485 of 590 in NY
Livability — Mount Vernon
- Score
- 71/100
- State rank
- #397
- US rank
- #6876
Category grades
Schools grade is shown separately in the Schools card above.
Census & demographics
- Census place
- Mount Vernon, NY
- County
- Westchester County · 709,332 people
- City population
- 61,313
- Metro
- New York-Newark-Jersey City, NY-NJ-PA
- Population (ZIP)
- 22,341
- Household income
- $96,717
- Rent vs Own
- Severe rent burden
- 652.0
Population outlook (Westchester County) Hauer SSP2
- Today (2025)
- 1,028,035 people
- By 2030
- 1,051,636 · +2.3%
- By 2040
- 1,098,520 · +6.9%
- By 2050
- 1,136,044 · +10.5%
- By 2075
- 1,196,925 · +16.4%
- By 2100
- 1,175,147 · +14.3%
Race, ethnicity, and origin ACS 2023
- Neighborhood character
- Highly diverse neighborhood (Simpson 0.72)
- Race & ethnicity
- Black 39% White 31% Hispanic / Latino 17% Two or more races 7% Asian 5%
- Hispanic origin (detail)
- Puerto Rican 5% Dominican 6%
- Common ancestry
- Russian 2% Estonian 2% Hispanic 1%
- Foreign-born
- 27% · Canada, China
- Languages at home
- 74% English-only · Spanish 12% Other Indo-European 7% French/Haitian/Cajun 2%
Political lean MEDSL · Westchester
- 2024 margin
- Strong D (+26.3) · D 63.1% · R 36.9%
- 2008→2024 swing
- -1.3pp toward R · 2008: 27.6pp · 2024: 26.3pp
- All cycles
- 2024: D+26.3 2020: D+36.3 2016: D+32.8 2012: D+22.2 2008: D+27.6
Not yet ingested
- Civics
- —
Market trends
- HPI YoY
- ▼ -393.94%
- Current HPI
- 244.3166
- Rent YoY
- ▲ 7.04%
- Metro
- New York-Newark-Jersey City, NY-NJ-PA
- State GDP YoY
- ▲ 2.60%
- F500 in state
- 92
Industry mix (Fortune 500 HQ in NY)
| Industry | F500 HQs | Revenue |
|---|---|---|
| Financial Services | 10 | $950B |
|
||
| Consumer Goods | 9 | $162B |
|
||
| Insurance | 4 | $225B |
|
||
| Telecommunications | 2 | $144B |
|
||
| Pharmaceuticals | 2 | $112B |
|
||
| Media / Entertainment | 2 | $69B |
|
||
Price history
4 events — show timeline
- 2026-03-10 Pending — OneKey® MLS as Distributed by MLS Grid
- 2026-01-16 Relisted — OneKey® MLS as Distributed by MLS Grid
- 2025-08-27 Pending — OneKey® MLS as Distributed by MLS Grid
- 2025-08-05 Listed $225,000 OneKey® MLS as Distributed by MLS Grid
Cash-flow waterfall
monthlySold comps — $/sqft
last 12 mo · ≤1 miLoading sold comps…