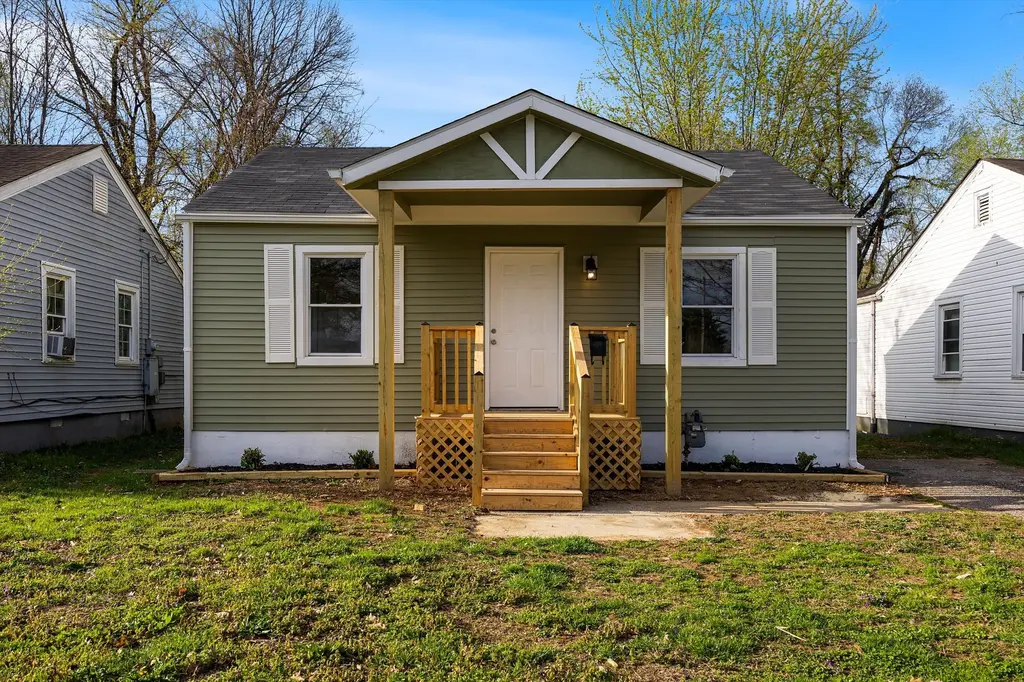
2726 Algonquin Pkwy · Louisville, KY
Flood risk 1/10 · Minimal
- FEMA flood zone
- X (unshaded)
- Chance of flooding over 30 yrs
- 0.0%
- Est. flood insurance / yr
- $507 – $1,088
Fire risk 1/10 · Minimal
- Est. fire insurance / yr
- $839 – $1,559
Heat risk 5/10 · Moderate
- Hot days now (above 104°F)
- 7 days/yr
- Hot days in 30 yrs
- 18 days/yr
Wind risk 2/10 · Minimal
- Chance of severe wind over 30 yrs
- 1.0%
Air-quality risk 2/10 · Minimal
- Unhealthy air days now
- 1 days/yr
- Unhealthy air days in 30 yrs
- 3 days/yr
Risk factors via First Street. Map © Google.
Why this score? — see what drove the D grade
The composite is a weighted blend of 9 inputs, each scored 0–100. Each bar is that input's sub-score; the figure is the points it added to the 100-point composite (weight × sub-score).
- Cash flow +13.1/30.0
- Appreciation +10.0/10.0
- Rent growth +4.5/5.0
- DSCR +3.9/10.0
- Livability +3.2/5.0
- 1% rule +2.5/10.0
- Condition / age +2.5/5.0
- Schools +2.3/10.0
- ARV discount +0.0/15.0
$139,000
🖨 Deal sheet (PDF) 📄 Offer letter ✓ Due diligence
Listing remarks
Welcome to 2627 Algonquin Pkwy—where modern updates meet classic charm! FULL APPLIANCE PACKAGE OFFERED! This beautifully renovated home is move-in ready and perfect for buyers seeking style, comfort, and convenience. Step inside to discover a fresh, updated interior featuring a fully renovated kitchen complete with brand-new appliances, offering both functionality and a sleek, modern feel—perfect for everyday living & entertaining. The home also boasts a completely updated bathroom with contemporary finishes designed for comfort and style. Enjoy relaxing mornings or evening unwinding on the brand-new front porch, adding both curb appeal and a welcoming outdoor space. Every
Key facts
- Updated bathroom
- 5,088 sq ft lot
- Parking
Tags
Property features AI
Finance
- Other: Subdivision: ALGONQUIN PLACE
- HOA & community: No association fee
Exterior
- Parking: Driveway
- Utilities: Electricity connected
- Home design: Single-family residence; Bungalow/Ranch style; 1 story
- Construction: Built in 1951; Vinyl siding with wood frame construction; Shingle roof; Crawl space foundation
- Exterior features: Partial wood fencing; Level lot
Interior
- Kitchen: Kitchen (appliances not specified)
- Bedrooms: 2 bedrooms (both on the first floor)
- Bathrooms: 1 full bathroom
- Heating & cooling: Electric heating; Central air conditioning; 1 HVAC unit
- Interior features: First-floor primary bedroom; First-floor laundry; Living room; Kitchen
- Laundry & utility: First-floor laundry
Neighborhood map
What this means for you Summary
Snapshot
- This is a 2-bed/1.0-bath single-family listed at $139k.
Deal economics
- At list price, monthly cash flow is $-5 ($-54/yr) — negative.
- To cash-flow at today's rent, offer at most $138k (0.6% below list).
- To meet the 1% rule (rent ≥ 1% of price), the offer needs to be $105k (24.6% below list).
- Recommended offer: $105k (24.6% below list) — sets the bar for 1% rule.
Location & tenants
- Location reads 63/100 on livability (#333 in KY) — a middle-class / working-renter tenant base. Strengths: cost of living A+, housing A+; Watch: employment C-, health & safety D+, crime F.
- Jefferson County (urban): math 19% / reading 35% proficiency, ranked #121 of 165 in KY (top 73%) — low school quality limits family demand, transient renter base, plan for 1-2y turnover.
- Zoned schools: Cane Run Elementary (math 2% / reading 12%, grade F, #662 of 676 statewide, top 99%, 377 students, 80% FRL); Stuart Academy (math 4% / reading 17%, grade F, #216 of 217 statewide, top 100%, 1,105 students, 72% FRL); Valley High (math 17% / reading 22%, grade F, #213 of 254 statewide, top 86%, 964 students, 70% FRL) — zoned schools average 74% FRL vs 56% district-wide (18 pts higher); higher-poverty schools than district average — tighter screening recommended.
- Zoned-school proficiency averages 12% at this address vs 27% district-wide (-15 pts) — the specific schools serving this property underperform the Jefferson County average; the district grade overstates school quality for this exact location.
- Market conditions: Rents rising fast (+8.1%/yr); 93 active listings in the ZIP; 19 comparable units currently listed for rent nearby; rentals at typical pace (median 18d on market — plan ~3-4 weeks tenant-placement turnaround); lower-income renter base — watch delinquency; 2,836 units permitted in Jefferson County in 2024 (1,558 in 5+ unit buildings).
Forward outlook
- In year one you build about $15k of equity ($961 loan paydown + $14k appreciation (10.0% local appreciation)).
- Jefferson County population projected at +13% by 2050 — modest demand growth; plan on rents tracking national, not racing it.
- At projected returns (10.0% appreciation + 8.0% rent growth), your $39k cash investment doubles in ~3 years — after that, you're playing with house money.
- By year 3, paydown + projected appreciation supports a ~$38k cash-out refi (75% LTV) — recoverable capital for the next deal without selling this one.
Negotiation context
- It's been on market 79 days — a 6% lower offer ($131k) is reasonable based on typical stale-listing flexibility.
- 2 sale attempts since 3y ago; this cycle's ask has dropped $9k (6%) from the opening price — seller is motivated, your offer sets the floor, not the list.
Risks & watch-outs
- Watch-outs: built in 1951 — expect roof / HVAC / electrical / plumbing capex.
- Climate carrying-cost: extreme-heat days projected 7→18/yr by 2055 (HVAC capex compounding) — expect insurance premiums to compound above CPI over the hold.
Questions for the listing agent
- What do current leases actually rent for vs. the listed asking? Can we see a recent rent roll and the last 12 months of T-12 income?
- It's been on market 79 days. Have you received any prior offers? Is the seller open to a 25% concession, seller financing, or rate buy-down credit?
- Built in 1951 — when were the roof, HVAC, electrical panel, plumbing, and water heater last replaced?
- Why hasn't it sold? Are there any deal-killer items the seller is aware of (foundation, flood, title, zoning, code violations)?
- Is there a deadline driving the sale (1031 exchange, divorce, estate, relocation)? That informs how much negotiation room exists.
- Schools are D-rated, which usually means shorter tenancies and higher turnover. Who's the typical renter profile here, and what's been the actual vacancy rate?
- Crime grade is F in this area — have there been break-ins, vandalism, or insurance claims at this property in the last 3 years? What carrier currently insures it and at what premium?
- The area grade is low — what's the realistic commute time and amenity access for the typical tenant pool here? Any planned neighborhood developments (good or bad) we should know about?
- What's the average days-on-market for RENTAL listings here right now (not sales)? A rising rental-DOM trend means longer vacancies and softer asking-rent achievability than the comps imply.
- What's the recent tenant-quality profile in this submarket — average credit score on applications, eviction rate, late-payment / NSF rate, and stable-employment percentage? A property-management company in the area should have these aggregated.
- How much new for-sale + rental construction is in the pipeline within 1–3 miles? Heavy new supply typically softens prices + rents 12–24 months out; constrained supply supports both.
Investment metrics
- 1% rule
- 0.75% ✗
- Cap rate
- 6.25%
- Cash-on-cash
- -0.14%
- DSCR
- 0.99
- GRM
- 11.1
CMA / ARV
- ARV (on-the-fly)
- $105,000
- Comps found
- 12
Show comp detail 12 sales within ~0.75 mi
| Address | Dist | Beds/Ba | Sqft | Sold | Price | $/sf | Match |
|---|---|---|---|---|---|---|---|
| 3020 Penway Ave | 0.07mi | 2/1.0 | 700 (0%) | 10mo | $47,750 | $68 | 89 |
| 2703 Algonquin Pkwy | 0.10mi | 2/1.0 | 700 (0%) | 14mo | $155,000 | $221 | 84 |
| 1936 S 28th St | 0.20mi | 2/1.0 | 708 (+1%) | 8mo | $94,000 | $133 | 82 |
| 2601 Dixdale Ave | 0.38mi | 2/1.0 | 700 (0%) | 2mo | $106,000 | $151 | 81 |
| 2606 Dixdale Ave | 0.35mi | 2/1.0 | 700 (0%) | 6mo | $134,900 | $193 | 78 |
| 3505 Hudson Ave | 0.42mi | 2/1.0 | 728 (+4%) | 1mo | $92,000 | $126 | 73 |
| 3515 Bells Ln | 0.48mi | 2/1.0 | 700 (0%) | 7mo | $143,000 | $204 | 72 |
| 2312 S 35th St | 0.40mi | 2/1.0 | 700 (0%) | 13mo | $85,000 | $121 | 70 |
| 2809 Wyandotte Ave | 0.24mi | 2/1.0 | 750 (+7%) | 12mo | $80,000 | $107 | 67 |
| 2811 Narragansett Dr | 0.26mi | 2/1.0 | 771 (+10%) | 5mo | $115,500 | $150 | 67 |
| 2611 Narragansett Dr | 0.37mi | 2/1.0 | 754 (+8%) | 5mo | $152,900 | $203 | 66 |
| 2505 Bolling Ave | 0.74mi | 2/1.0 | 624 (-11%) | 6mo | $65,000 | $104 | 42 |
Match score weights: distance 35% · size 25% · config 20% · recency 20%. Top-matched comps best support the ARV.
Projected returns pro-forma
10.0% appreciation · 8.0% rent growth · sell at horizon
- IRR
- 25.7%
- Equity multiple
- 3.08×
- Total profit
- $80,888
- Equity at exit
- $125,222
- IRR
- 23.8%
- Equity multiple
- 7.48×
- Total profit
- $252,017
- Equity at exit
- $270,046
Cash invested: $38,920 (down + closing). Projections, not guarantees.
Landlord ↔ Tenant lean methodology
- Overall (STATE)
- 83 Strongly Landlord-Friendly
- State Kentucky
- 83 Strongly Landlord-Friendly · R+16
- County
- — inherits STATE
- City
- — inherits STATE
ZIP-level market 40210
- Home prices YoY
- 12.1%
- Rents YoY
- 8.1%
- Active inventory
- 93
- Price-to-rent
- 11.1×
Monthly cashflow live
- Estimated rent
- $1,048 high interval (Pro) →
- Mortgage (P&I)
- −$729
- Tax from tax record
- −$45 /mo · $542/yr
- Insurance
- −$58
- HOA
- −$0
- Vacancy / Maint / Mgmt
- −$220
- Net cashflow
- $-5
Break-even live
Sensitivity live
| Price | -10% $74 | -5% $35 | +0% $-5 | +5% $-44 | +10% $-83 |
|---|---|---|---|---|---|
| Rent | -10% $-87 | -5% $-46 | +0% $-5 | +5% $37 | +10% $78 |
| Rate | -1.0pp $65 | -0.5pp $31 | base $-5 | +0.5pp $-41 | +1.0pp $-77 |
UW: 25.0% down · 7.5% · 30yr · 1.5% tax · 5.0% vac · 8.0% maint · 8.0% mgmt
Financing live
Cash to close
- Down payment
- $34,750
- Closing costs
- $4,170
- Reserves months
- —
- Total cash needed
- —
Loan-product check · same deal, 3 products live
Conventional
25% down · 7.5% · 30yr
- Down + closing
- —
- Monthly P&I
- —
- Monthly cashflow
- —
- DSCR
- —
- Eligible?
- —
Personal DTI + credit; lowest rate.
DSCR
20% down · 8.5% · 30yr
- Down + closing
- —
- Monthly P&I
- —
- Monthly cashflow
- —
- DSCR
- —
- Eligible?
- —
No personal income docs; deal must DSCR.
Hard money
10% down · 12.0% · 12mo
- Down + closing
- —
- Monthly P&I
- —
- Monthly cashflow
- —
- DSCR
- —
- Eligible?
- —
Short-term bridge; refi at stabilization.
Rent comps 19 comps
| Address | Beds | Baths | Sqft | Rent | $/sqft | DOM | Units | Dist |
|---|---|---|---|---|---|---|---|---|
| 3019 Penway Ave Louisville, KY | 2.0 | 1.0 | 700 | $960 | $1.37 | 13d | 1 | 0.05mi |
| 3004 Wyandotte Ave Louisville, KY | 2.0 | 1.0 | 700 | $1,200 | $1.71 | 17d | 1 | 0.09mi |
| 3005 Linwood Ave Louisville, KY | 2.0 | 1.0 | 700 | $1,025 | $1.46 | 17d | 1 | 0.09mi |
| 1927 S 28th St Louisville, KY | 2.0 | 1.0 | 700 | $1,200 | $1.71 | 25d | 1 | 0.19mi |
| 1443 S 32nd St Unit 2 Louisville, KY | 1.0 | 1.0 | 550 | $780 | $1.42 | 25d | 1 | 0.57mi |
| 1804 Russell Lee Dr Louisville, KY | 1.0–3.0 | 1.0–1.5 | 810 | $1,124 | $1.39 | 3d | 1 | 0.67mi |
| 1836 Algonquin Pkwy Unit 2 Louisville, KY | 1.0 | 1.0 | 600 | $650 | $1.08 | 25d | 1 | 0.68mi |
| 1836 Algonquin Pkwy Unit 1 Louisville, KY | 1.0 | 1.0 | 650 | $650 | $1.00 | 16d | 1 | 0.68mi |
| 1349 Olive St Unit 4 Louisville, KY | 1.0 | 1.0 | 600 | $725 | $1.21 | 25d | 1 | 0.86mi |
| 1349 Olive St Unit 4 Louisville, KY | 1.0 | 1.0 | 550 | $650 | $1.18 | 4d | 1 | 0.86mi |
| 1349 Olive St Unit 3 Louisville, KY | 1.0 | 1.0 | 600 | $695 | $1.16 | 4d | 1 | 0.86mi |
| 2016 S 40th St Louisville, KY | 2.0 | 1.0 | 700 | $980 | $1.40 | 17d | 1 | 0.87mi |
| 2807 Dumesnil St Unit 101 Louisville, KY | 1.0 | 1.0 | 750 | $950 | $1.27 | 25d | 1 | 0.95mi |
| 1768 W Hill St Louisville, KY | 2.0 | 1.0 | 675 | $925 | $1.37 | 25d | 1 | 1.05mi |
| 1333 S 22nd St Louisville, KY | 2.0 | 1.0 | 744 | $1,200 | $1.61 | 25d | 1 | 1.15mi |
| 1710 Saint Louis Ave Louisville, KY | 2.0 | 1.0 | 720 | $1,000 | $1.39 | 4d | 1 | 1.28mi |
| 1606 Algonquin Pkwy Unit 22 Louisville, KY | 2.0 | 1.0 | 626 | $750 | $1.20 | 25d | 1 | 1.28mi |
| 1724 W Ormsby Ave #4 Louisville, KY | 1.0 | 1.0 | 520 | $750 | $1.44 | 4d | 1 | 1.47mi |
| 3515 W Kentucky St Unit 3515-12 Louisville, KY | 1.0 | 1.0 | 700 | $695 | $0.99 | 25d | 1 | 1.47mi |
Listing history 18 events
-
2026-06-21days on market $139,000 Active 79 DOM
-
2026-06-18days on market $139,000 Active 76 DOM
-
2026-06-17days on market $139,000 Active 75 DOM
-
2026-06-16days on market $139,000 Active 74 DOM
-
2026-06-15days on market $139,000 Active 73 DOM
-
2026-06-13days on market $139,000 Active 71 DOM
-
2026-06-10days on market $139,000 Active 68 DOM
-
2026-06-09days on market $139,000 Active 67 DOM
-
2026-06-08days on market $139,000 Active 66 DOM
-
2026-06-07days on market $139,000 Active 65 DOM
-
2026-06-03days on market $139,000 Active 61 DOM
-
2026-06-02days on market $139,000 Active 60 DOM
-
2026-06-01days on market $139,000 Active 59 DOM
-
2026-05-31days on market $139,000 Active 58 DOM
-
2026-04-27price $139,000
-
2026-04-03$148,000 Active
-
2023-07-21historical $799
-
2023-07-13$799
ⓘ Source: listings_history table (triggers on properties + properties_extension) + one-shot
backfill from property_details.listing_events for pre-trigger history.
Tax reassessment forecast KY · Resets to sale price
- Current annual tax
- $542 · $45/mo
- Projected year-2 tax
- $1,195 · $100/mo
- Expected delta
- +$653/yr (+$54/mo · 120.4%)
ⓘ Screening estimate from a state-policy table — verify with the county assessor before closing.
Climate risk First Street
- Flood 1/10 Low FEMA zone X (unshaded) · 0% chance over 30 yrs
- Wildfire 1/10 Low
- Heat 5/10 Major 7 d/yr ≥104°F today · 18 d/yr by 30 yrs out
- Wind 2/10 Low 100% chance of damaging wind over 30 yrs
- Air quality 2/10 Low 1 unhealthy d/yr today · 3 by 30 yrs out
Nearby sold comps map
Loading sold comps map…
Walkable amenities ~0.75 mi
Loading nearby amenities…
Taxation est. · year 1
- Rental income
- $12,570
- − Mortgage interest
- −$7,786
- − Property taxes
- −$542
- − Insurance
- −$695
- − Repairs & maintenance
- −$1,006
- − Management
- −$1,006
- − Depreciation
- −$4,044
- Taxable loss
- −$2,508
- Est. tax savings @ 24.0%
- +$602
- After-tax cash flow
- $548/yr
For passive investors: Depreciation is non-cash, so a rental often shows a tax loss while cash-flowing — sheltering income. Rental losses are passive: they offset passive income freely, and up to $25,000/yr can offset ordinary (W-2) income if you actively participate and your MAGI is under $100k (phasing out to $0 by $150k); unused losses carry forward. On sale, claimed depreciation is recaptured at up to 25%, and gains may owe capital-gains tax (a 1031 exchange can defer both). Figures are a year-1 estimate at your 24.0% rate — not tax advice; consult a CPA.
Schools (NCES district)
- District
- Jefferson County
- NCES district ID
- 2102990
- Math proficiency
- 19% ▼ -17.00%
- Reading proficiency
- 35% ▼ -11.00%
- Median HH income
- $47,885
- Composite
- 23.45/100
- National rank
- #7884
- State rank
- #121 of 165 in KY
Livability — Louisville
- Score
- 63/100
- State rank
- #333
- US rank
- #15887
Category grades
Schools grade is shown separately in the Schools card above.
Census & demographics
- Census place
- Louisville, KY
- County
- Jefferson County · 790,184 people
- City population
- 769,292
- Metro
- Louisville/Jefferson County, KY-IN
- Population (ZIP)
- 13,518
- Household income
- $35,347
- Rent vs Own
- Severe rent burden
- 815.0
Population outlook (Jefferson County) Hauer SSP2
- Today (2025)
- 823,112 people
- By 2030
- 849,343 · +3.2%
- By 2040
- 895,696 · +8.8%
- By 2050
- 933,630 · +13.4%
- By 2075
- 1,028,262 · +24.9%
- By 2100
- 1,072,675 · +30.3%
Race, ethnicity, and origin ACS 2023
- Neighborhood character
- Predominantly Black (84%)
- Race & ethnicity
- Black 84% White 8% Two or more races 5% Hispanic / Latino 3%
- Common ancestry
- Iranian 1%
- Foreign-born
- 4% · Canada
- Languages at home
- 93% English-only · Spanish 3%
Political lean MEDSL · Jefferson
- 2024 margin
- D (+16.6) · D 57.4% · R 40.9% · Other 1.7%
- 2008→2024 swing
- +4.5pp toward D · 2008: 12.0pp · 2024: 16.6pp
- All cycles
- 2024: D+16.6 2020: D+20.1 2016: D+13.3 2012: D+11.1 2008: D+12.0
Not yet ingested
- Civics
- —
Market trends
- HPI YoY
- ▲ 28.45%
- Current HPI
- 264.0146
- Rent YoY
- ▲ 8.05%
- Metro
- Louisville/Jefferson County, KY-IN
- State GDP YoY
- ▲ 1.81%
- F500 in state
- 4
Industry mix (Fortune 500 HQ in KY)
| Industry | F500 HQs | Revenue |
|---|---|---|
| Healthcare | 1 | $118B |
|
||
| Food / Beverage | 1 | $7B |
|
||
Price history
-6.1% since first listed4 events — show timeline
- 2026-04-27 Price Changed $139,000 Metro Search MLS
- 2026-04-03 Listed $148,000 Metro Search MLS
- 2023-07-21 Rental Removed $799 BUILDIUM
- 2023-07-13 Listed for Rent $799 BUILDIUM
Property tax history
+2.8%/yrLatest (2025): $542 · -1.9% YoY. Source: county tax records.
Cash-flow waterfall
monthlySold comps — $/sqft
last 12 mo · ≤1 miLoading sold comps…