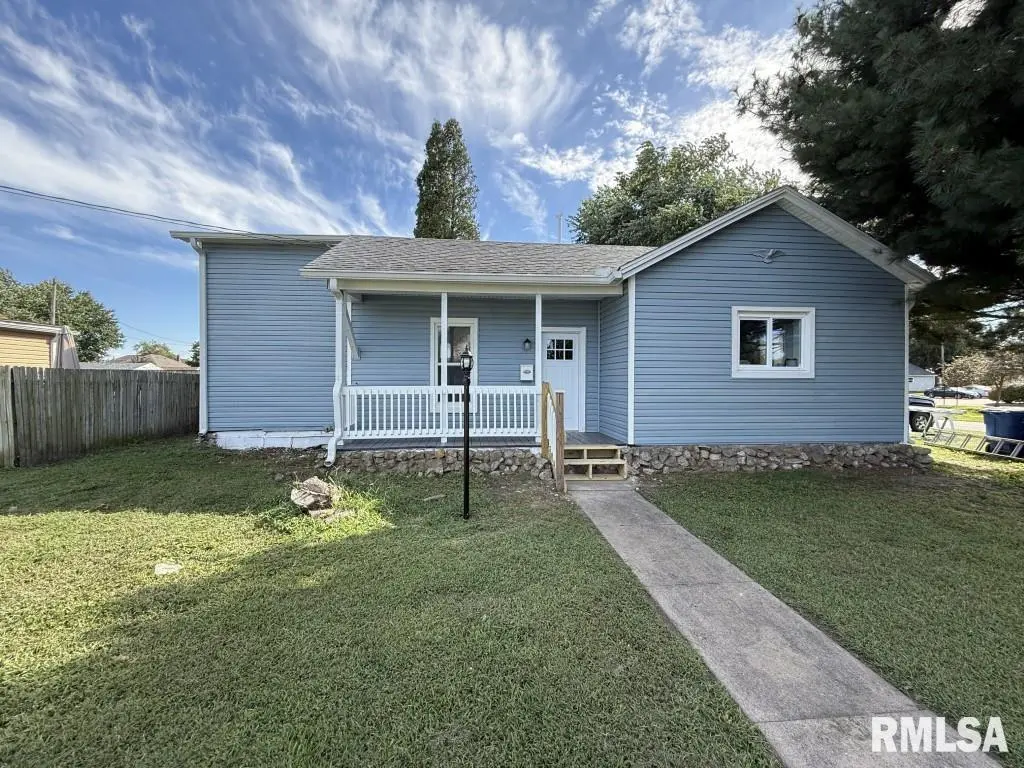
603 E Euclid Ave · Monmouth, IL
Flood risk 1/10 · Minimal
- FEMA flood zone
- X (unshaded)
- Chance of flooding over 30 yrs
- 0.0%
- Est. flood insurance / yr
- $473 – $860
Fire risk 1/10 · Minimal
- Est. fire insurance / yr
- $804 – $1,492
Heat risk 3/10 · Minor
- Hot days now (above 106°F)
- 7 days/yr
- Hot days in 30 yrs
- 17 days/yr
Wind risk 2/10 · Minimal
- Chance of severe wind over 30 yrs
- —
Air-quality risk 2/10 · Minimal
- Unhealthy air days now
- 1 days/yr
- Unhealthy air days in 30 yrs
- 1 days/yr
Risk factors via First Street. Map © Google.
Why this score? — see what drove the C- grade
The composite is a weighted blend of 9 inputs, each scored 0–100. Each bar is that input's sub-score; the figure is the points it added to the 100-point composite (weight × sub-score).
- Cash flow +23.1/30.0
- DSCR +7.4/10.0
- 1% rule +6.5/10.0
- ARV discount +4.5/15.0
- Livability +3.5/5.0
- Rent growth +2.5/5.0
- Condition / age +2.5/5.0
- Schools +1.3/10.0
- Appreciation +0.0/10.0
$86,500
🖨 Deal sheet (PDF) 📄 Offer letter ✓ Due diligence
Listing remarks
Home is in move in condition and has recently been rehabbed. Recent repairs include; most interior and exterior light fixtures, some new windows, drive way, exterior and interior doors, interior paint, some electrical and plumbing, floor coverings, bath, kitchen w/ granite counter tops, central air and quite a bit more.
Key facts
- Interior paint
- Move in condition
- New windows
Tags
Property features AI
Finance
- Other: Located in unincorporated area; Directions: N Main St to E Euclid Ave
- HOA & community: No master association fee required
Exterior
- Parking: Attached garage (garage owned) — 1 garage space, 1 total parking space
- Utilities: Public water; Public sewer; Electric with circuit breakers
- Home design: Detached single-family home; 1.5-story design; Fee simple ownership; Rehab completed in 2025; Property over 100 years old
- Construction: Vinyl siding with frame construction; Asphalt roof; Block foundation; Approximately 1,140 finished living area (reported)
- Exterior features: Corner, level lot (approx. 75 x 66); Lot less than 0.25 acre
Interior
- Kitchen: Kitchen on main level (15 x 13) with luxury vinyl flooring; Microwave; Range
- Bedrooms: Main-level master bedroom (12 x 13) with carpet; Second-level bedroom (17 x 11) with carpet; Additional bedrooms listed
- Flooring: Carpet in primary living areas and some bedrooms; Luxury vinyl in kitchen, dining room, and laundry
- Bathrooms: One full bathroom
- Heating & cooling: Forced air heating (natural gas); Central air conditioning
- Interior features: Five total rooms; Separate dining room; Unfinished partial cellar basement
- Laundry & utility: Main-level laundry room (7 x 8) with luxury vinyl flooring
Neighborhood map
What this means for you Summary
Snapshot
- This is a 2-bed/1.0-bath single-family listed at $86k.
Deal economics
- At list price, monthly cash flow is $156 ($2k/yr) — positive.
- The deal already cash-flows at list — no discount required.
- Meets the 1% rule at list price ($995 rent vs $86k).
- Recommended offer: $84k (3.0% below list) — sets the bar for market timing.
Location & tenants
- Location reads 70/100 on livability (#372 in IL) — a middle-class / working-renter tenant base. Strengths: cost of living A+, housing A+; Watch: health & safety D+, employment D, amenities F.
- Monmouth-Roseville CUSD 238 (town): math 10% / reading 21% proficiency, ranked #511 of 620 in IL (top 82%) — low school quality limits family demand, transient renter base, plan for 1-2y turnover; 61% free/reduced lunch — lower-income household profile, screen leases tightly.
- Zoned schools: Lincoln Early Childhood School (354 students, 0% FRL); Central Intermediate School (math 5% / reading 20%, grade F, #545 of 665 statewide, top 83%, 311 students, 0% FRL); Monmouth-Roseville High Sch (math 22% / reading 27%, grade F, #256 of 693 statewide, top 44%, 519 students, 0% FRL) — zoned schools average 0% FRL vs 61% district-wide (61 pts lower); this property's tenant base skews higher-income than the district average.
- Market conditions: 13 active listings in the ZIP; 43 units permitted in Warren County in 2024 (0 in 5+ unit buildings).
Forward outlook
- Local home prices are declining (-3.0%/yr); year-one equity from $598 of loan paydown is wiped out by about $3k of value loss. Plan a longer hold.
- Warren County population projected to shrink 10% by 2050 — rents likely to lag national; underwrite the cash flow, not the appreciation.
Negotiation context
- It's been on market 31 days — a 3% lower offer ($84k) is reasonable based on typical stale-listing flexibility.
- 4 sale attempts with the ask held roughly flat each time — persistent listings suggest the price (not the market) is what's stuck; bring a comps-based counter.
Risks & watch-outs
- Watch-outs: built in 1910 — expect roof / HVAC / electrical / plumbing capex.
Questions for the listing agent
- It's been on market 31 days. Have you received any prior offers? Is the seller open to a 3% concession, seller financing, or rate buy-down credit?
- Built in 1910 — when were the roof, HVAC, electrical panel, plumbing, and water heater last replaced?
- Is there a deadline driving the sale (1031 exchange, divorce, estate, relocation)? That informs how much negotiation room exists.
- Schools are D-rated, which usually means shorter tenancies and higher turnover. Who's the typical renter profile here, and what's been the actual vacancy rate?
- What's the average days-on-market for RENTAL listings here right now (not sales)? A rising rental-DOM trend means longer vacancies and softer asking-rent achievability than the comps imply.
- What's the recent tenant-quality profile in this submarket — average credit score on applications, eviction rate, late-payment / NSF rate, and stable-employment percentage? A property-management company in the area should have these aggregated.
- How much new for-sale + rental construction is in the pipeline within 1–3 miles? Heavy new supply typically softens prices + rents 12–24 months out; constrained supply supports both.
Investment metrics
- 1% rule
- 1.15% ✓
- Cap rate
- 8.45%
- Cash-on-cash
- 7.71%
- DSCR
- 1.34
- GRM
- 7.2
CMA / ARV
- ARV (median comp)
- $81,111
- List price
- $86,500
- Delta
- 14.66%
- Verdict
- OVERPRICED
- Comps
- 20 within 1.0 mi
Show comp detail 2 sales within ~0.75 mi
| Address | Dist | Beds/Ba | Sqft | Sold | Price | $/sf | Match |
|---|---|---|---|---|---|---|---|
| 424 N 6th St | 0.08mi | 2/1.5 | 1,089 (-4%) | 11mo | $121,500 | $112 | 77 |
| 620 N D St | 0.63mi | 3/1.0 (+1) | 1,142 (+0%) | 2mo | $87,000 | $76 | 64 |
Match score weights: distance 35% · size 25% · config 20% · recency 20%. Top-matched comps best support the ARV.
Projected returns pro-forma
-3.0% appreciation · 3.0% rent growth · sell at horizon
- IRR
- -4.5%
- Equity multiple
- 0.83×
- Total profit
- $-4,065
- Equity at exit
- $12,897
- IRR
- 5.2%
- Equity multiple
- 1.39×
- Total profit
- $9,371
- Equity at exit
- $7,479
Cash invested: $24,220 (down + closing). Projections, not guarantees.
Landlord ↔ Tenant lean methodology
- Overall (STATE)
- 43 Moderately Tenant-Leaning
- State Illinois
- 43 Moderately Tenant-Leaning · D+7
- County
- — inherits STATE
- City
- — inherits STATE
ZIP-level market 61462
- Home prices YoY
- -22.1%
- Active inventory
- 13
- Price-to-rent
- 7.2×
Monthly cashflow live
- Estimated rent
- $995 medium interval (Pro) →
- Mortgage (P&I)
- −$454
- Tax from tax record
- −$141 /mo · $1,689/yr
- Insurance
- −$36
- HOA
- −$0
- Vacancy / Maint / Mgmt
- −$209
- Net cashflow
- $156
Break-even live
Sensitivity live
| Price | -10% $205 | -5% $180 | +0% $156 | +5% $131 | +10% $107 |
|---|---|---|---|---|---|
| Rent | -10% $77 | -5% $116 | +0% $156 | +5% $195 | +10% $234 |
| Rate | -1.0pp $199 | -0.5pp $178 | base $156 | +0.5pp $133 | +1.0pp $110 |
UW: 25.0% down · 7.5% · 30yr · 1.5% tax · 5.0% vac · 8.0% maint · 8.0% mgmt
Financing live
Cash to close
- Down payment
- $21,625
- Closing costs
- $2,595
- Reserves months
- —
- Total cash needed
- —
Loan-product check · same deal, 3 products live
Conventional
25% down · 7.5% · 30yr
- Down + closing
- —
- Monthly P&I
- —
- Monthly cashflow
- —
- DSCR
- —
- Eligible?
- —
Personal DTI + credit; lowest rate.
DSCR
20% down · 8.5% · 30yr
- Down + closing
- —
- Monthly P&I
- —
- Monthly cashflow
- —
- DSCR
- —
- Eligible?
- —
No personal income docs; deal must DSCR.
Hard money
10% down · 12.0% · 12mo
- Down + closing
- —
- Monthly P&I
- —
- Monthly cashflow
- —
- DSCR
- —
- Eligible?
- —
Short-term bridge; refi at stabilization.
Listing history 29 events
-
2026-06-21days on market $86,500 Active 31 DOM
-
2026-06-21days on market $86,500 Active 30 DOM
-
2026-06-18days on market $86,500 Active 28 DOM
-
2026-06-17days on market $86,500 Active 27 DOM
-
2026-06-16days on market $86,500 Active 26 DOM
-
2026-06-15days on market $86,500 Active 25 DOM
-
2026-06-13days on market $86,500 Active 23 DOM
-
2026-06-12days on market $86,500 Active 22 DOM
-
2026-06-09days on market $86,500 Active 19 DOM
-
2026-06-08days on market $86,500 Active 18 DOM
-
2026-06-07days on market $86,500 Active 17 DOM
-
2026-06-07days on market $86,500 Active 16 DOM
-
2026-06-04days on market $86,500 Active 13 DOM
-
2026-06-02days on market $86,500 Active 12 DOM
-
2026-06-01days on market $86,500 Active 11 DOM
-
2026-05-31days on market $86,500 Active 10 DOM
-
2026-05-31days on market $86,500 Active 9 DOM
-
2026-05-13historical
-
2026-01-17status Active
-
2026-01-17price
-
2026-01-14historical
-
2026-01-08status Active
-
2026-01-06historical
-
2026-01-05historical
-
2025-12-24price
-
2025-12-19price
-
2025-11-20price
-
2025-10-21price
-
2025-09-24Active
ⓘ Source: listings_history table (triggers on properties + properties_extension) + one-shot
backfill from property_details.listing_events for pre-trigger history.
Tax reassessment forecast IL · Partial reset (capped growth)
- Current annual tax
- $1,689 · $141/mo
- Projected year-2 tax
- $1,826 · $152/mo
- Expected delta
- +$137/yr (+$11/mo · 8.1%)
ⓘ Screening estimate from a state-policy table — verify with the county assessor before closing.
Climate risk First Street
- Flood 1/10 Low FEMA zone X (unshaded) · 0% chance over 30 yrs
- Wildfire 1/10 Low
- Heat 3/10 Moderate 7 d/yr ≥106°F today · 17 d/yr by 30 yrs out
- Wind 2/10 Low
- Air quality 2/10 Low 1 unhealthy d/yr today · 1 by 30 yrs out
Nearby sold comps map
Loading sold comps map…
Walkable amenities ~0.75 mi
Loading nearby amenities…
Taxation est. · year 1
- Rental income
- $11,941
- − Mortgage interest
- −$4,845
- − Property taxes
- −$1,689
- − Insurance
- −$432
- − Repairs & maintenance
- −$955
- − Management
- −$955
- − Depreciation
- −$2,516
- Taxable income
- $547
- Est. tax owed @ 24.0%
- −$131
- After-tax cash flow
- $1,737/yr
For passive investors: Depreciation is non-cash, so a rental often shows a tax loss while cash-flowing — sheltering income. Rental losses are passive: they offset passive income freely, and up to $25,000/yr can offset ordinary (W-2) income if you actively participate and your MAGI is under $100k (phasing out to $0 by $150k); unused losses carry forward. On sale, claimed depreciation is recaptured at up to 25%, and gains may owe capital-gains tax (a 1031 exchange can defer both). Figures are a year-1 estimate at your 24.0% rate — not tax advice; consult a CPA.
Schools (NCES district)
- District
- Monmouth-Roseville CUSD 238
- NCES district ID
- 1700320
- Math proficiency
- 10% ▼ -6.00%
- Reading proficiency
- 21% ▼ -8.00%
- Median HH income
- $40,228
- Composite
- 13.21/100
- National rank
- #9552
- State rank
- #511 of 620 in IL
Livability — Monmouth
- Score
- 70/100
- State rank
- #372
- US rank
- #7739
Category grades
Schools grade is shown separately in the Schools card above.
Census & demographics
- Census place
- Monmouth, IL
- City population
- 10,640
- Population (ZIP)
- 10,640
Population outlook (Warren County) Hauer SSP2
- Today (2025)
- 17,168 people
- By 2030
- 16,771 · -2.3%
- By 2040
- 15,988 · -6.9%
- By 2050
- 15,471 · -9.9%
- By 2075
- 15,053 · -12.3%
- By 2100
- 14,513 · -15.5%
Race, ethnicity, and origin ACS 2023
- Neighborhood character
- Predominantly White (74%)
- Race & ethnicity
- White 74% Hispanic / Latino 16% Two or more races 5% Black 4% Asian 4% Native American 2%
- Hispanic origin (detail)
- Mexican 14%
- Common ancestry
- Lithuanian 3% Slovak 2% Romanian 2%
- Foreign-born
- 9% · Canada, Philippines, United Kingdom
- Languages at home
- 85% English-only · Spanish 10% Other Asian/Pacific 2% French/Haitian/Cajun 2%
Political lean MEDSL · Warren
- 2024 margin
- Strong R (+25.1) · D 36.5% · R 61.6% · Other 1.9%
- 2008→2024 swing
- -33.2pp toward R · 2008: 8.1pp · 2024: -25.1pp
- All cycles
- 2024: R+25.1 2020: R+20.0 2016: R+16.7 2012: D+5.8 2008: D+8.1
Not yet ingested
- Civics
- —
Market trends
- HPI YoY
- ▼ -39.51%
- Current HPI
- 139.0562
- Rent YoY
- —
- Metro
- —
- State GDP YoY
- ▲ 1.59%
- F500 in state
- 60
Industry mix (Fortune 500 HQ in IL)
| Industry | F500 HQs | Revenue |
|---|---|---|
| Insurance | 4 | $201B |
|
||
| Consumer Goods | 4 | $87B |
|
||
| Industrial Machinery | 3 | $64B |
|
||
| Healthcare | 2 | $55B |
|
||
| Retail / Pharmacy | 1 | $148B |
|
||
| Agriculture / Food | 1 | $86B |
|
||
Price history
13 events — show timeline
- 2026-05-20 Listed $86,500 MRED as Distributed by MLS Grid
- 2026-05-13 Listing Removed — MRED as Distributed by MLS Grid
- 2026-01-17 Relisted — MRED as Distributed by MLS Grid
- 2026-01-17 Price Changed — MRED as Distributed by MLS Grid
- 2026-01-14 Listing Removed — MRED as Distributed by MLS Grid
- 2026-01-08 Relisted — MRED as Distributed by MLS Grid
- 2026-01-06 Listing Removed — RMLSA as Distributed by MLS Grid
- 2026-01-05 Listing Removed — MRED as Distributed by MLS Grid
- 2025-12-24 Price Changed — MRED as Distributed by MLS Grid
- 2025-12-19 Price Changed — MRED as Distributed by MLS Grid
- 2025-11-20 Price Changed — RMLSA as Distributed by MLS Grid
- 2025-10-21 Price Changed — RMLSA as Distributed by MLS Grid
- 2025-09-24 Listed — RMLSA as Distributed by MLS Grid
Property tax history
+8.8%/yrLatest (2024): $1,689 · +4.9% YoY. Source: county tax records.
Cash-flow waterfall
monthlySold comps — $/sqft
last 12 mo · ≤1 miLoading sold comps…