3915 Pearl St · Columbia, SC
Flood risk 1/10 · Minimal
- FEMA flood zone
- X (unshaded)
- Chance of flooding over 30 yrs
- 0.0%
- Est. flood insurance / yr
- $507 – $1,088
Fire risk 4/10 · Minor
- Est. fire insurance / yr
- $783 – $1,453
Heat risk 6/10 · Moderate
- Hot days now (above 108°F)
- 7 days/yr
- Hot days in 30 yrs
- 16 days/yr
Wind risk 6/10 · Moderate
- Chance of severe wind over 30 yrs
- 64.0%
Air-quality risk 3/10 · Minor
- Unhealthy air days now
- 2 days/yr
- Unhealthy air days in 30 yrs
- 2 days/yr
Risk factors via First Street. Map © Google.
Why this score? — see what drove the D grade
The composite is a weighted blend of 9 inputs, each scored 0–100. Each bar is that input's sub-score; the figure is the points it added to the 100-point composite (weight × sub-score).
- Cash flow +15.3/30.0
- ARV discount +7.1/15.0
- DSCR +4.7/10.0
- 1% rule +4.3/10.0
- Livability +3.9/5.0
- Rent growth +3.1/5.0
- Schools +2.6/10.0
- Condition / age +2.5/5.0
- Appreciation +0.0/10.0
$174,900
🖨 Deal sheet (PDF) 📄 Offer letter ✓ Due diligence
Listing remarks
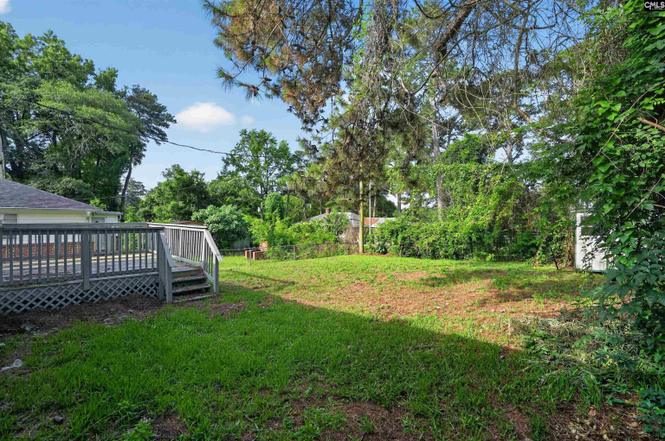
Charming 3BR/2BA home offering over 1,422 square feet of comfortable living space. This single-story residence features a functional floor plan, spacious living areas, and generously sized bedrooms. Enjoy the covered front porch, ample yard space, and convenient location just minutes from downtown Columbia, shopping, dining, schools, and major highways. Disclaimer: CMLS has not reviewed and, therefore, does not endorse vendors who may appear in listings.
Key facts
- Covered front porch
- Convenient location
- Ample yard space
Tags
Property features AI
Exterior
- Parking: Attached carport; One covered parking space; One total parking space
- Utilities: Public water; Public sewer
- Home design: Single-story home
- Construction: Crawlspace foundation
- Exterior features: Partial brick exterior above foundation; Paved road access
Interior
- Kitchen: Kitchen on main level
- Bedrooms: Main-level primary bedroom; All bedrooms located on main level
- Bathrooms: Two full bathrooms
- Heating & cooling: Central heating; Central air conditioning
- Interior features: Formal living room; Family room; Dining room; Kitchen on main level
Neighborhood map
What this means for you Summary
Snapshot
- This is a 3-bed/2.0-bath single-family listed at $175k.
Deal economics
- At list price, monthly cash flow is $63 ($752/yr) — positive.
- The deal already cash-flows at list — no discount required.
- To meet the 1% rule (rent ≥ 1% of price), the offer needs to be $163k (7.0% below list).
- Recommended offer: $163k (7.0% below list) — sets the bar for 1% rule.
- Cap rate 6.7% vs local median 5.1% in Columbia — top-decile yield for the area; either an underpriced asset or a hidden risk that comps aren't pricing in. Stress-test before assuming the spread holds.
Location & tenants
- Location reads 78/100 on livability (#18 in SC, #2,436 nationally) — a middle-class / working-renter tenant base. Strengths: amenities A+, commute A+, cost of living A+; Watch: employment D, crime F.
- Richland 01 (urban): math 26% / reading 36% proficiency, ranked #54 of 80 in SC (top 68%) — families likely to look elsewhere, expect single-tenant / working-renter base with shorter leases; 64% free/reduced lunch — lower-income household profile, screen leases tightly.
- Zoned schools: Edward E. Taylor Elementary (math 5% / reading 24%, grade F, #549 of 597 statewide, top 92%, 225 students, 100% FRL); St. Andrews Middle (math 9% / reading 18%, grade F, #207 of 229 statewide, top 91%, 706 students, 100% FRL); Columbia High (math 17% / reading 67%, grade F, #174 of 196 statewide, top 90%, 665 students, 100% FRL) — zoned schools average 100% FRL vs 64% district-wide (36 pts higher); higher-poverty schools than district average — tighter screening recommended.
- Market conditions: Rents rising (+2.5%/yr); 241 active listings in the ZIP; 22 comparable units currently listed for rent nearby; rentals at typical pace (median 16d on market — plan ~3-4 weeks tenant-placement turnaround); 3,472 units permitted in Richland County in 2024 (1,096 in 5+ unit buildings).
- This rent runs 42% of the median local income ($46k/yr) — at the standard rent-burdened threshold; future hikes will face affordability resistance.
Forward outlook
- Local home prices are declining (-3.0%/yr); year-one equity from $1k of loan paydown is wiped out by about $5k of value loss. Plan a longer hold.
- Richland County population projected at +30% by 2050 — long-run rental-demand tailwind backs the buy-and-hold thesis.
Negotiation context
- Only 11 days on market — expect competitive offers; lowballing is unlikely to land.
- 2 sale attempts since 12y ago with the ask held roughly flat each time — persistent listings suggest the price (not the market) is what's stuck; bring a comps-based counter.
Risks & watch-outs
- Climate carrying-cost: major wind risk, 64% chance of damaging wind over 30y; extreme-heat days projected 7→16/yr by 2055 (HVAC capex compounding) — expect insurance premiums to compound above CPI over the hold.
Questions for the listing agent
- Built in 1965 — when were the roof, HVAC, electrical panel, plumbing, and water heater last replaced?
- Is there a deadline driving the sale (1031 exchange, divorce, estate, relocation)? That informs how much negotiation room exists.
- Schools are D-rated, which usually means shorter tenancies and higher turnover. Who's the typical renter profile here, and what's been the actual vacancy rate?
- Crime grade is F in this area — have there been break-ins, vandalism, or insurance claims at this property in the last 3 years? What carrier currently insures it and at what premium?
- The area grade is low — what's the realistic commute time and amenity access for the typical tenant pool here? Any planned neighborhood developments (good or bad) we should know about?
- What's the average days-on-market for RENTAL listings here right now (not sales)? A rising rental-DOM trend means longer vacancies and softer asking-rent achievability than the comps imply.
- What's the recent tenant-quality profile in this submarket — average credit score on applications, eviction rate, late-payment / NSF rate, and stable-employment percentage? A property-management company in the area should have these aggregated.
- How much new for-sale + rental construction is in the pipeline within 1–3 miles? Heavy new supply typically softens prices + rents 12–24 months out; constrained supply supports both.
Investment metrics
- 1% rule
- 0.93% ✗
- Cap rate
- 6.72%
- Cash-on-cash
- 1.54%
- DSCR
- 1.07
- GRM
- 9.0
CMA / ARV
- ARV (on-the-fly)
- $173,484
- Comps found
- 1
Show comp detail 1 sale within ~0.75 mi
| Address | Dist | Beds/Ba | Sqft | Sold | Price | $/sf | Match |
|---|---|---|---|---|---|---|---|
| 116 Summerlea Dr | 0.66mi | 3/2.0 | 1,628 (+14%) | 23mo | $199,000 | $122 | 25 |
Match score weights: distance 35% · size 25% · config 20% · recency 20%. Top-matched comps best support the ARV.
Projected returns pro-forma
-3.0% appreciation · 2.5% rent growth · sell at horizon
- IRR
- -14.4%
- Equity multiple
- 0.49×
- Total profit
- $-25,129
- Equity at exit
- $26,078
- IRR
- -6.5%
- Equity multiple
- 0.59×
- Total profit
- $-19,913
- Equity at exit
- $15,122
Cash invested: $48,972 (down + closing). Projections, not guarantees.
Landlord ↔ Tenant lean methodology
- Overall (STATE)
- 90 Strongly Landlord-Friendly
- State South Carolina
- 90 Strongly Landlord-Friendly · R+6
- County
- — inherits STATE
- City
- — inherits STATE
ZIP-level market 29203
- Home prices YoY
- -31.6%
- Rents YoY
- 2.5%
- Active inventory
- 241
- Price-to-rent
- 9.0×
Monthly cashflow live
- Estimated rent
- $1,627 high interval (Pro) →
- Mortgage (P&I)
- −$917
- Tax from tax record
- −$232 /mo · $2,790/yr
- Insurance
- −$73
- HOA
- −$0
- Vacancy / Maint / Mgmt
- −$342
- Net cashflow
- $63
Break-even live
Sensitivity live
| Price | -10% $162 | -5% $112 | +0% $63 | +5% $13 | +10% $-36 |
|---|---|---|---|---|---|
| Rent | -10% $-66 | -5% $-2 | +0% $63 | +5% $127 | +10% $191 |
| Rate | -1.0pp $151 | -0.5pp $107 | base $63 | +0.5pp $17 | +1.0pp $-29 |
UW: 25.0% down · 7.5% · 30yr · 1.5% tax · 5.0% vac · 8.0% maint · 8.0% mgmt
Financing live
Cash to close
- Down payment
- $43,725
- Closing costs
- $5,247
- Reserves months
- —
- Total cash needed
- —
Loan-product check · same deal, 3 products live
Conventional
25% down · 7.5% · 30yr
- Down + closing
- —
- Monthly P&I
- —
- Monthly cashflow
- —
- DSCR
- —
- Eligible?
- —
Personal DTI + credit; lowest rate.
DSCR
20% down · 8.5% · 30yr
- Down + closing
- —
- Monthly P&I
- —
- Monthly cashflow
- —
- DSCR
- —
- Eligible?
- —
No personal income docs; deal must DSCR.
Hard money
10% down · 12.0% · 12mo
- Down + closing
- —
- Monthly P&I
- —
- Monthly cashflow
- —
- DSCR
- —
- Eligible?
- —
Short-term bridge; refi at stabilization.
Rent comps 22 comps
| Address | Beds | Baths | Sqft | Rent | $/sqft | DOM | Units | Dist |
|---|---|---|---|---|---|---|---|---|
| 3638 Falling Springs Rd Columbia, SC | 3.0 | 2.0 | 1080 | $1,332 | $1.23 | 25d | 1 | 0.43mi |
| 3900 Bentley Dr Columbia, SC | 1.0–2.0 | 1.0–2.0 | 873 | $1,330 | $1.52 | 13d | 40 | 0.56mi |
| 1850 Atlantic Dr #524 Columbia, SC | 2.0 | 2.0 | 1630 | $2,400 | $1.47 | 16d | 1 | 0.59mi |
| 4501 Bentley Dr Columbia, SC | 1.0–3.0 | 1.0–2.0 | 946 | $1,730 | $1.83 | 13d | 18 | 0.65mi |
| 100 Bryton Trce Columbia, SC | 2.0 | 1.0–2.0 | 950 | $1,215 | $1.28 | 23d | 4 | 0.75mi |
| 98 Riverview Ct Columbia, SC | 3.0 | 2.0 | 1257 | $1,800 | $1.43 | 16d | 1 | 0.80mi |
| 1100 Skyland Dr Unit R1 Columbia, SC | 2.0 | 2.0 | 1100 | $1,300 | $1.18 | 25d | 1 | 0.88mi |
| 328 Northwood St Columbia, SC | 3.0 | 2.5 | 1461 | $2,395 | $1.64 | 25d | 1 | 0.93mi |
| 2901 Park St Columbia, SC | 3.0 | 2.0 | 1288 | $2,750 | $2.14 | 25d | 1 | 1.05mi |
| 215 Northwood St Columbia, SC | 3.0 | 2.5 | 1288 | $1,849 | $1.44 | 25d | 1 | 1.05mi |
| 168 Canal Place Cir Columbia, SC | 3.0 | 2.5 | 1437 | $2,250 | $1.57 | 25d | 1 | 1.09mi |
| 1800 Longcreek Dr Columbia, SC | 1.0–3.0 | 1.0–2.0 | 986 | $1,080 | $1.10 | 13d | 62 | 1.16mi |
| 167 Stoneridge Dr Columbia, SC | 1.0–2.0 | 1.0–2.0 | 900 | $1,071 | $1.19 | 13d | 27 | 1.17mi |
| 200 Saluda River Rd Columbia, SC | 1.0–2.0 | 1.0–1.5 | 900 | $1,120 | $1.24 | 13d | 8 | 1.19mi |
| 1000 Watermark Pl Columbia, SC | 1.0–2.0 | 1.0–2.0 | 944 | $1,100 | $1.17 | 13d | 14 | 1.29mi |
| 151 Moore Hopkins Ln Unit 303 Columbia, SC | 2.0 | 1.5 | 953 | $700 | $0.73 | 25d | 1 | 1.30mi |
| 214 Hanover Ave Unit A Columbia, SC | 2.0 | 1.0 | 1400 | $1,450 | $1.04 | 25d | 1 | 1.31mi |
| 313 Cambout St Columbia, SC | 2.0 | 2.0 | 1100 | $1,450 | $1.32 | 25d | 1 | 1.31mi |
| 2617 River Dr Columbia, SC | 2.0–3.0 | 1.0–2.0 | 1038 | $993 | $0.96 | 16d | 2 | 1.34mi |
| 606 Muller Ave Columbia, SC | 2.0 | 1.0 | 1240 | $1,349 | $1.09 | 13d | 1 | 1.35mi |
| 1340 Longcreek Dr Columbia, SC | 1.0–2.0 | 1.0–2.0 | 875 | $1,180 | $1.35 | 13d | 25 | 1.39mi |
| 1401 Longcreek Dr Columbia, SC | 1.0–3.0 | 1.0–2.0 | 1000 | $1,287 | $1.29 | 16d | 9 | 1.46mi |
Listing history 7 events
-
2026-06-21days on market $174,900 Active 11 DOM
-
2026-06-18days on market $174,900 Active 8 DOM
-
2026-06-17days on market $174,900 Active 7 DOM
-
2026-06-16days on market $174,900 Active 6 DOM
-
2026-06-15days on market $174,900 Active 5 DOM
-
2026-06-14remarks 459-char remark
-
2026-06-14$174,900 Active 3 DOM
ⓘ Source: listings_history table (triggers on properties + properties_extension) + one-shot
backfill from property_details.listing_events for pre-trigger history.
Tax reassessment forecast SC · Resets to sale price
- Current annual tax
- $2,790 · $232/mo
- Projected year-2 tax
- $2,790 · $232/mo
- Expected delta
- $0/yr ($0/mo · 0.0%)
ⓘ Screening estimate from a state-policy table — verify with the county assessor before closing.
Climate risk First Street
- Flood 1/10 Low FEMA zone X (unshaded) · 0% chance over 30 yrs
- Wildfire 4/10 Moderate
- Heat 6/10 Major 7 d/yr ≥108°F today · 16 d/yr by 30 yrs out
- Wind 6/10 Major 64% chance of damaging wind over 30 yrs
- Air quality 3/10 Moderate 2 unhealthy d/yr today · 2 by 30 yrs out
Nearby sold comps map
Loading sold comps map…
Walkable amenities ~0.75 mi
Loading nearby amenities…
Taxation est. · year 1
- Rental income
- $19,523
- − Mortgage interest
- −$9,797
- − Property taxes
- −$2,790
- − Insurance
- −$874
- − Repairs & maintenance
- −$1,562
- − Management
- −$1,562
- − Depreciation
- −$5,088
- Taxable loss
- −$2,150
- Est. tax savings @ 24.0%
- +$516
- After-tax cash flow
- $1,269/yr
For passive investors: Depreciation is non-cash, so a rental often shows a tax loss while cash-flowing — sheltering income. Rental losses are passive: they offset passive income freely, and up to $25,000/yr can offset ordinary (W-2) income if you actively participate and your MAGI is under $100k (phasing out to $0 by $150k); unused losses carry forward. On sale, claimed depreciation is recaptured at up to 25%, and gains may owe capital-gains tax (a 1031 exchange can defer both). Figures are a year-1 estimate at your 24.0% rate — not tax advice; consult a CPA.
Schools (NCES district)
- District
- Richland 01
- NCES district ID
- 4503360
- Math proficiency
- 26% ▼ -7.00%
- Reading proficiency
- 36% ▼ -5.00%
- Median HH income
- $38,931
- Composite
- 25.94/100
- National rank
- #7335
- State rank
- #54 of 80 in SC
Livability — Columbia
- Score
- 78/100
- State rank
- #18
- US rank
- #2436
Category grades
Schools grade is shown separately in the Schools card above.
Census & demographics
- County
- Richland County · 389,530 people
- City population
- 335,994
- Metro
- Columbia, SC
- Population (ZIP)
- 40,653
- Household income
- $46,054
- Rent vs Own
- Severe rent burden
- 1980.0
Population outlook (Richland County) Hauer SSP2
- Today (2025)
- 459,667 people
- By 2030
- 487,524 · +6.1%
- By 2040
- 542,035 · +17.9%
- By 2050
- 595,371 · +29.5%
- By 2075
- 732,998 · +59.5%
- By 2100
- 820,415 · +78.5%
Race, ethnicity, and origin ACS 2023
- Neighborhood character
- Predominantly Black (80%)
- Race & ethnicity
- Black 80% White 13% Hispanic / Latino 5% Two or more races 2%
- Common ancestry
- Serbian 1%
- Foreign-born
- 3% · Canada
- Languages at home
- 93% English-only · Spanish 5%
Political lean MEDSL · Richland
- 2024 margin
- Solid D (+34.6) · D 66.4% · R 31.8% · Other 1.8%
- 2008→2024 swing
- +5.7pp toward D · 2008: 28.9pp · 2024: 34.6pp
- All cycles
- 2024: D+34.6 2020: D+38.3 2016: D+32.9 2012: D+33.3 2008: D+28.9
Not yet ingested
- Civics
- —
Market trends
- HPI YoY
- ▼ -77.52%
- Current HPI
- 168.2114
- Rent YoY
- ▲ 2.50%
- Metro
- Columbia, SC
- State GDP YoY
- ▲ 4.51%
- F500 in state
- 2
Industry mix (Fortune 500 HQ in SC)
| Industry | F500 HQs | Revenue |
|---|---|---|
| Packaging | 1 | $7B |
|
||
Price history
+69.8% since first listed6 events — show timeline
- 2026-06-10 Listed $174,900 Consolidated MLS
- 2022-08-29 Sold (Public Records) $12,990,681 Public Records
- 2018-07-20 Sold (Public Records) $6,786,370 Public Records
- 2014-01-30 Sold (MLS) $50,000 Charleston Trident MLS
- 2014-01-11 Listed $50,000 Charleston Trident MLS
- 2007-11-02 Sold (Public Records) $103,000 Public Records
Property tax history
+12.6%/yrLatest (2025): $2,790 · +2.5% YoY. Source: county tax records.
Cash-flow waterfall
monthlySold comps — $/sqft
last 12 mo · ≤1 miLoading sold comps…