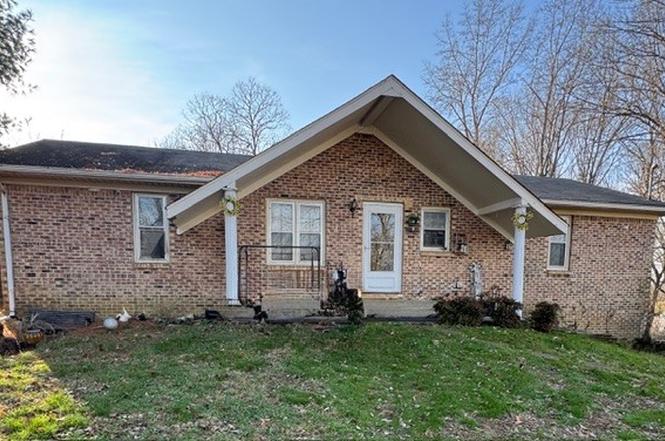
2332 Huckaby Rd · Columbia, TN
Flood risk 1/10 · Minimal
- FEMA flood zone
- X (unshaded)
- Chance of flooding over 30 yrs
- 0.0%
- Est. flood insurance / yr
- $473 – $860
Fire risk 3/10 · Minor
- Est. fire insurance / yr
- $949 – $1,763
Heat risk 5/10 · Moderate
- Hot days now (above 106°F)
- 7 days/yr
- Hot days in 30 yrs
- 19 days/yr
Wind risk 4/10 · Minor
- Chance of severe wind over 30 yrs
- 11.0%
Air-quality risk 2/10 · Minimal
- Unhealthy air days now
- 0 days/yr
- Unhealthy air days in 30 yrs
- 1 days/yr
Risk factors via First Street. Map © Google.
Why this score? — see what drove the D+ grade
The composite is a weighted blend of 9 inputs, each scored 0–100. Each bar is that input's sub-score; the figure is the points it added to the 100-point composite (weight × sub-score).
- ARV discount +15.0/15.0
- Cash flow +13.8/30.0
- DSCR +4.2/10.0
- Rent growth +3.7/5.0
- Livability +3.2/5.0
- 1% rule +2.6/10.0
- Condition / age +2.5/5.0
- Schools +1.8/10.0
- Appreciation +0.0/10.0
$225,000
🖨 Deal sheet 📄 Offer letter ✓ Due diligence
Listing remarks
FOR COMP PURPOSES ONLY.
Key facts
- 0.65 acre lot
- 2 garage spots
- Built 1983
Neighborhood map
What this means for you Summary
Snapshot
- This is a 3-bed/2.0-bath single-family listed at $225k.
Deal economics
- At list price, monthly cash flow is $22 ($268/yr) — positive.
- The deal already cash-flows at list — no discount required.
- To meet the 1% rule (rent ≥ 1% of price), the offer needs to be $172k (23.5% below list).
- Recommended offer: $172k (23.5% below list) — sets the bar for 1% rule.
- Cap rate 6.4% vs local median 2.8% in Columbia — top-decile yield for the area; either an underpriced asset or a hidden risk that comps aren't pricing in. Stress-test before assuming the spread holds.
Location & tenants
- Location reads 63/100 on livability (#207 in TN) — a middle-class / working-renter tenant base. Strengths: cost of living A+, housing A+; Watch: employment C-, health & safety C-, crime F.
- Maury County (town): math 19% / reading 21% proficiency, ranked #108 of 139 in TN (top 78%) — low school quality limits family demand, transient renter base, plan for 1-2y turnover.
- Zoned schools: R Howell Elementary (math 22% / reading 17%, grade F, #654 of 952 statewide, top 72%, 645 students, 0% FRL) — zoned schools average 0% FRL vs 48% district-wide (48 pts lower); this property's tenant base skews higher-income than the district average.
- Market conditions: Rents rising fast (+5.0%/yr); 1118 active listings in the ZIP; 1,650 units permitted in Maury County in 2024 (60 in 5+ unit buildings).
- This rent runs 30% of the median local income ($68k/yr) — at the standard rent-burdened threshold; future hikes will face affordability resistance.
Forward outlook
- Local home prices are declining (-3.0%/yr); year-one equity from $2k of loan paydown is wiped out by about $7k of value loss. Plan a longer hold.
- Maury County population projected at +34% by 2050 — long-run rental-demand tailwind backs the buy-and-hold thesis.
Negotiation context
- Only 0 days on market — expect competitive offers; lowballing is unlikely to land.
- Current owner paid $131k; list at $225k implies a 72% gain — meaningful room to come down on a strong offer.
Risks & watch-outs
- Climate carrying-cost: extreme-heat days projected 7→19/yr by 2055 (HVAC capex compounding) — expect insurance premiums to compound above CPI over the hold.
Questions for the listing agent
- Is there a deadline driving the sale (1031 exchange, divorce, estate, relocation)? That informs how much negotiation room exists.
- Schools are F-rated, which usually means shorter tenancies and higher turnover. Who's the typical renter profile here, and what's been the actual vacancy rate?
- Crime grade is F in this area — have there been break-ins, vandalism, or insurance claims at this property in the last 3 years? What carrier currently insures it and at what premium?
- The area grade is low — what's the realistic commute time and amenity access for the typical tenant pool here? Any planned neighborhood developments (good or bad) we should know about?
- What's the average days-on-market for RENTAL listings here right now (not sales)? A rising rental-DOM trend means longer vacancies and softer asking-rent achievability than the comps imply.
- What's the recent tenant-quality profile in this submarket — average credit score on applications, eviction rate, late-payment / NSF rate, and stable-employment percentage? A property-management company in the area should have these aggregated.
- How much new for-sale + rental construction is in the pipeline within 1–3 miles? Heavy new supply typically softens prices + rents 12–24 months out; constrained supply supports both.
Investment metrics
- 1% rule
- 0.76% ✗
- Cap rate
- 6.41%
- Cash-on-cash
- 0.43%
- DSCR
- 1.02
- GRM
- 10.9
CMA / ARV
- ARV (on-the-fly)
- $344,500
- Comps found
- 6
Show comp detail 6 sales within ~0.75 mi
| Address | Dist | Beds/Ba | Sqft | Sold | Price | $/sf | Match |
|---|---|---|---|---|---|---|---|
| 2323 Huckaby Rd S | 0.07mi | 3/2.0 | 1,250 (-4%) | 1mo | $312,999 | $250 | 89 |
| 2327 Huckaby Rd | 0.05mi | 3/2.0 | 1,316 (+1%) | 16mo | $325,000 | $247 | 82 |
| 2321 Sowell Mill Pike | 0.22mi | 3/2.0 | 1,196 (-8%) | 3mo | $345,000 | $288 | 74 |
| 2322 Huckaby Rd | 0.04mi | 3/2.0 | 1,255 (-4%) | 23mo | $333,000 | $265 | 73 |
| 2475 Rock Springs Cemetery Rd | 0.52mi | 3/2.0 | 1,260 (-3%) | 23mo | $392,000 | $311 | 52 |
| 2194 Sowell Mill Pike | 0.69mi | 2/1.0 (-1) | 1,282 (-1%) | 13mo | $280,000 | $218 | 45 |
Match score weights: distance 35% · size 25% · config 20% · recency 20%. Top-matched comps best support the ARV.
Projected returns pro-forma
-3.0% appreciation · 4.97% rent growth · sell at horizon
- IRR
- -13.8%
- Equity multiple
- 0.50×
- Total profit
- $-31,665
- Equity at exit
- $33,548
- IRR
- -2.5%
- Equity multiple
- 0.82×
- Total profit
- $-11,319
- Equity at exit
- $19,454
Cash invested: $63,000 (down + closing). Projections, not guarantees.
Landlord ↔ Tenant lean methodology
- Overall (STATE)
- 87 Strongly Landlord-Friendly
- State Tennessee
- 87 Strongly Landlord-Friendly · R+13
- County
- — inherits STATE
- City
- — inherits STATE
ZIP-level market 38401
- Home prices YoY
- -22.7%
- Rents YoY
- 5.0%
- Active inventory
- 1118
- Price-to-rent
- 10.9×
Monthly cashflow live
- Estimated rent
- $1,721 medium interval (Pro) →
- Mortgage (P&I)
- −$1,180
- Tax from tax record
- −$64 /mo · $762/yr
- Insurance
- −$94
- HOA
- −$0
- Vacancy / Maint / Mgmt
- −$361
- Net cashflow
- $22
Break-even live
UW: 25.0% down · 7.5% · 30yr · 1.5% tax · 5.0% vac · 8.0% maint · 8.0% mgmt
Financing live
Cash to close
- Down payment
- $56,250
- Closing costs
- $6,750
- Reserves months
- —
- Total cash needed
- —
Loan-product check · same deal, 3 products live
Conventional
25% down · 7.5% · 30yr
- Down + closing
- —
- Monthly P&I
- —
- Monthly cashflow
- —
- DSCR
- —
- Eligible?
- —
Personal DTI + credit; lowest rate.
DSCR
20% down · 8.5% · 30yr
- Down + closing
- —
- Monthly P&I
- —
- Monthly cashflow
- —
- DSCR
- —
- Eligible?
- —
No personal income docs; deal must DSCR.
Hard money
10% down · 12.0% · 12mo
- Down + closing
- —
- Monthly P&I
- —
- Monthly cashflow
- —
- DSCR
- —
- Eligible?
- —
Short-term bridge; refi at stabilization.
Listing history 6 events
-
2026-02-24$225,000
-
2026-02-24historical
-
2009-01-29soldstatus $131,000
-
2008-09-25soldstatus $82,000
-
2005-04-19soldstatus $118,900
-
2003-01-15soldstatus $110,000
ⓘ Source: listings_history table (triggers on properties + properties_extension) + one-shot
backfill from property_details.listing_events for pre-trigger history.
Tax reassessment forecast TN · Resets to sale price
- Current annual tax
- $762 · $64/mo
- Projected year-2 tax
- $1,598 · $133/mo
- Expected delta
- +$836/yr (+$70/mo · 109.6%)
ⓘ Screening estimate from a state-policy table — verify with the county assessor before closing.
Climate risk First Street
- Flood 1/10 Low FEMA zone X (unshaded) · 0% chance over 30 yrs
- Wildfire 3/10 Moderate
- Heat 5/10 Major 7 d/yr ≥106°F today · 19 d/yr by 30 yrs out
- Wind 4/10 Moderate 11% chance of damaging wind over 30 yrs
- Air quality 2/10 Low 0 unhealthy d/yr today · 1 by 30 yrs out
Nearby sold comps map
Loading sold comps map…
Walkable amenities ~0.75 mi
Loading nearby amenities…
Taxation est. · year 1
- Rental income
- $20,651
- − Mortgage interest
- −$12,603
- − Property taxes
- −$762
- − Insurance
- −$1,125
- − Repairs & maintenance
- −$1,652
- − Management
- −$1,652
- − Depreciation
- −$6,545
- Taxable loss
- −$3,689
- Est. tax savings @ 24.0%
- +$885
- After-tax cash flow
- $1,154/yr
For passive investors: Depreciation is non-cash, so a rental often shows a tax loss while cash-flowing — sheltering income. Rental losses are passive: they offset passive income freely, and up to $25,000/yr can offset ordinary (W-2) income if you actively participate and your MAGI is under $100k (phasing out to $0 by $150k); unused losses carry forward. On sale, claimed depreciation is recaptured at up to 25%, and gains may owe capital-gains tax (a 1031 exchange can defer both). Figures are a year-1 estimate at your 24.0% rate — not tax advice; consult a CPA.
Schools (NCES district)
- District
- Maury County
- NCES district ID
- 4702760
- Math proficiency
- 19% ▼ -5.00%
- Reading proficiency
- 21% ▼ -4.00%
- Median HH income
- $47,668
- Composite
- 17.69/100
- National rank
- #9024
- State rank
- #108 of 139 in TN
Livability — Columbia
- Score
- 63/100
- State rank
- #207
- US rank
- #16090
Category grades
Schools grade is shown separately in the Schools card above.
Census & demographics
- County
- Maury County · 121,382 people
- City population
- 67,482
- Metro
- Nashville-Davidson--Murfreesboro--Franklin, TN
- Population (ZIP)
- 67,482
- Household income
- $68,475
- Rent vs Own
- Severe rent burden
- 2026.0
Population outlook (Maury County) Hauer SSP2
- Today (2025)
- 102,894 people
- By 2030
- 110,269 · +7.2%
- By 2040
- 124,426 · +20.9%
- By 2050
- 137,543 · +33.7%
- By 2075
- 167,438 · +62.7%
- By 2100
- 184,489 · +79.3%
Race, ethnicity, and origin ACS 2023
- Neighborhood character
- Predominantly White (74%)
- Race & ethnicity
- White 74% Black 12% Hispanic / Latino 9% Two or more races 7%
- Hispanic origin (detail)
- Mexican 7%
- Common ancestry
- Slovak 1% Serbian 1% Romanian 1%
- Foreign-born
- 4% · Canada
- Languages at home
- 94% English-only · Spanish 5%
Political lean MEDSL · Maury
- 2024 margin
- Solid R (+44.6) · D 27.1% · R 71.8% · Other 1.1%
- 2008→2024 swing
- -6.2pp toward R · 2008: -38.4pp · 2024: -44.6pp
- All cycles
- 2024: R+44.6 2020: R+36.5 2016: R+39.2 2012: R+26.9 2008: R+38.4
Not yet ingested
- Civics
- —
Market trends
- HPI YoY
- ▼ -100.75%
- Current HPI
- 343.0362
- Rent YoY
- ▲ 4.97%
- Metro
- Nashville-Davidson--Murfreesboro--Franklin, TN
- State GDP YoY
- ▲ 2.78%
- F500 in state
- 22
Industry mix (Fortune 500 HQ in TN)
| Industry | F500 HQs | Revenue |
|---|---|---|
| Healthcare | 3 | $91B |
|
||
| Retail | 3 | $72B |
|
||
| Transportation / Logistics | 1 | $88B |
|
||
| Paper / Packaging | 1 | $19B |
|
||
| Insurance | 1 | $13B |
|
||
| Energy | 1 | $12B |
|
||
Price history
+104.5% since first listed6 events — show timeline
- 2026-02-24 Listed $225,000 REALTRACS as Distributed by MLS Grid
- 2026-02-24 Listing Removed — REALTRACS as Distributed by MLS Grid
- 2009-01-29 Sold (Public Records) $131,000 Public Records
- 2008-09-25 Sold (Public Records) $82,000 Public Records
- 2005-04-19 Sold (Public Records) $118,900 Public Records
- 2003-01-15 Sold (Public Records) $110,000 Public Records
Property tax history
+0.5%/yrLatest (2025): $762 · +0.0% YoY. Source: county tax records.
Cash-flow waterfall
monthlySold comps — $/sqft
last 12 mo · ≤1 miLoading sold comps…