777 Tess St · Burnettown, SC
Flood risk No data
- FEMA flood zone
- —
- Chance of flooding over 30 yrs
- —
- Est. flood insurance / yr
- —
Fire risk No data
- Est. fire insurance / yr
- —
Heat risk No data
- Hot days now (above threshold)
- —
- Hot days in 30 yrs
- —
Wind risk No data
- Chance of severe wind over 30 yrs
- —
Air-quality risk No data
- Unhealthy air days now
- —
- Unhealthy air days in 30 yrs
- —
Risk factors via First Street. Map © Google.
Why this score? — see what drove the C- grade
The composite is a weighted blend of 9 inputs, each scored 0–100. Each bar is that input's sub-score; the figure is the points it added to the 100-point composite (weight × sub-score).
- Cash flow +15.1/30.0
- Appreciation +9.2/10.0
- ARV discount +6.2/15.0
- Condition / age +5.0/5.0
- DSCR +4.6/10.0
- 1% rule +4.2/10.0
- Schools +3.2/10.0
- Livability +3.2/5.0
- Rent growth +2.5/5.0
$318,800
🖨 Deal sheet 📄 Offer letter ✓ Due diligence
Listing remarks
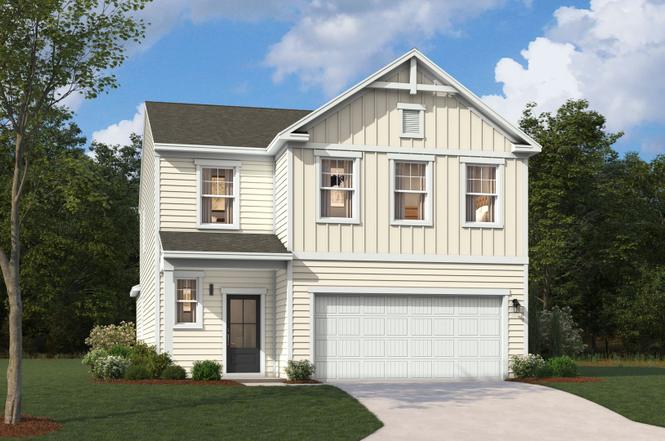
Meet the Yarmouth at Clairbourne, a new construction neighborhood with a swimming pool, cabana, and sidewalks, minutes from commuter routes and dining. This move-in ready Yarmouth spans two floors with roughly 2,500 square feet, four bedrooms, two full baths, a powder room, and a two-car garage. The main level opens into a connected kitchen, dining area, and family room that move as one continuous space, with GE gas appliances anchoring the cooking wall and a built-in pocket office desk tucked nearby. The covered patio extends the main level outward, a natural place to wind down or stretch an evening past sunset. The primary suite sits on the main level, set apart from the rest of the home,
Key facts
- Swimming pool
- Cabana
- Connected kitchen
Tags
Property features AI
Finance
- Financial info: List price $318,800
Exterior
- Parking: 2 total parking spaces; 2-car garage
- Home design: Single-family home (The Yarmouth); Address: 777 Tess St, Graniteville, SC 29829
- Exterior features: Living area approximately 2500
Interior
- Bedrooms: 4 bedrooms
- Bathrooms: 2 full bathrooms, 1 half bathroom (2.5 total)
- Interior features: Spec home (The Yarmouth plan); Active listing
Neighborhood map
What this means for you Summary
Snapshot
- This is a 4-bed/2.5-bath single-family listed at $319k. Condition is rated excellent.
Deal economics
- At list price, monthly cash flow is $102 ($1k/yr) — positive.
- The deal already cash-flows at list — no discount required.
- To meet the 1% rule (rent ≥ 1% of price), the offer needs to be $292k (8.5% below list).
- Recommended offer: $292k (8.5% below list) — sets the bar for 1% rule.
- Cap rate 6.7% vs local median 5.5% in Burnettown — meaningfully above typical; check what's discounted (condition, days-on-market, listing class) to confirm the premium yield is real.
Location & tenants
- Location reads 64/100 on livability (#159 in SC) — a middle-class / working-renter tenant base. Strengths: crime A+, cost of living A+, housing A+; Watch: schools D-, amenities F, commute F.
- Aiken 01 (suburban): math 31% / reading 44% proficiency, ranked #36 of 80 in SC (top 45%) — families likely to look elsewhere, expect single-tenant / working-renter base with shorter leases.
- Market conditions: 299 active listings in the ZIP; 2 comparable units currently listed for rent nearby; solid renter incomes; 2,500 units permitted in Aiken County in 2024 (1,023 in 5+ unit buildings).
- This rent runs 42% of the median local income ($84k/yr) — at the standard rent-burdened threshold; future hikes will face affordability resistance.
Forward outlook
- In year one you build about $29k of equity ($2k loan paydown + $27k appreciation (8.4% local appreciation)).
- Aiken County population projected at +9% by 2050 — modest demand growth; plan on rents tracking national, not racing it.
- At projected returns (8.4% appreciation + 3.0% rent growth), your $89k cash investment doubles in ~3 years — after that, you're playing with house money.
- By year 2, paydown + projected appreciation supports a ~$46k cash-out refi (75% LTV) — recoverable capital for the next deal without selling this one.
Negotiation context
- Only 3 days on market — expect competitive offers; lowballing is unlikely to land.
Questions for the listing agent
- Is there a deadline driving the sale (1031 exchange, divorce, estate, relocation)? That informs how much negotiation room exists.
- Schools are D-rated, which usually means shorter tenancies and higher turnover. Who's the typical renter profile here, and what's been the actual vacancy rate?
- What's the average days-on-market for RENTAL listings here right now (not sales)? A rising rental-DOM trend means longer vacancies and softer asking-rent achievability than the comps imply.
- What's the recent tenant-quality profile in this submarket — average credit score on applications, eviction rate, late-payment / NSF rate, and stable-employment percentage? A property-management company in the area should have these aggregated.
- How much new for-sale + rental construction is in the pipeline within 1–3 miles? Heavy new supply typically softens prices + rents 12–24 months out; constrained supply supports both.
Investment metrics
- 1% rule
- 0.92% ✗
- Cap rate
- 6.68%
- Cash-on-cash
- 1.37%
- DSCR
- 1.06
- GRM
- 9.1
CMA / ARV
- ARV (on-the-fly)
- $310,000
- Comps found
- 12
Show comp detail 12 sales within ~0.75 mi
| Address | Dist | Beds/Ba | Sqft | Sold | Price | $/sf | Match |
|---|---|---|---|---|---|---|---|
| 915 Tess St | 0.10mi | 4/2.5 | 2,505 (+0%) | 1mo | $304,900 | $122 | 94 |
| 935 Tess St | 0.12mi | 4/2.5 | 2,505 (+0%) | 2mo | $303,795 | $121 | 92 |
| 926 Tess St | 0.12mi | 4/2.5 | 2,505 (+0%) | 3mo | $310,000 | $124 | 92 |
| 955 Tess St | 0.14mi | 4/2.5 | 2,505 (+0%) | 2mo | $289,900 | $116 | 91 |
| 875 Tess St | 0.08mi | 4/3.5 | 2,386 (-5%) | 1mo | $316,805 | $133 | 84 |
| 908 Tess St | 0.11mi | 4/3.5 | 2,386 (-5%) | 1mo | $289,900 | $122 | 83 |
| 945 Tess St | 0.13mi | 4/3.5 | 2,386 (-5%) | 1mo | $279,900 | $117 | 82 |
| 985 Tess St | 0.17mi | 4/3.5 | 2,386 (-5%) | 2mo | $284,900 | $119 | 79 |
| 6240 Whirlaway Rd | 0.46mi | 4/2.5 | 2,431 (-3%) | 2mo | $314,400 | $129 | 72 |
| 350 Country Glen Ave | 0.46mi | 4/2.5 | 2,184 (-13%) | 1mo | $275,000 | $126 | 57 |
| 139 Midland Pines Dr | 0.39mi | 3/2.5 (-1) | 2,200 (-12%) | 2mo | $315,000 | $143 | 55 |
| 3109 Brevard Dr | 0.67mi | 4/2.5 | 2,246 (-10%) | 1mo | $360,000 | $160 | 51 |
Match score weights: distance 35% · size 25% · config 20% · recency 20%. Top-matched comps best support the ARV.
Projected returns pro-forma
8.38% appreciation · 3.0% rent growth · sell at horizon
- IRR
- 21.9%
- Equity multiple
- 2.63×
- Total profit
- $145,673
- Equity at exit
- $250,490
- IRR
- 20.0%
- Equity multiple
- 5.69×
- Total profit
- $418,394
- Equity at exit
- $505,342
Cash invested: $89,264 (down + closing). Projections, not guarantees.
Landlord ↔ Tenant lean methodology
- Overall (STATE)
- 90 Strongly Landlord-Friendly
- State South Carolina
- 90 Strongly Landlord-Friendly · R+6
- County
- — inherits STATE
- City
- — inherits STATE
ZIP-level market 29829
- Home prices YoY
- 3.0%
- Active inventory
- 299
- Price-to-rent
- 9.1×
Monthly cashflow live
- Estimated rent
- $2,918 medium interval (Pro) →
- Mortgage (P&I)
- −$1,672
- Tax est. 1.5%
- −$398 /mo · $4,782/yr
- Insurance
- −$133
- HOA
- −$0
- Vacancy / Maint / Mgmt
- −$613
- Net cashflow
- $102
Break-even live
UW: 25.0% down · 7.5% · 30yr · 1.5% tax · 5.0% vac · 8.0% maint · 8.0% mgmt
Financing live
Cash to close
- Down payment
- $79,700
- Closing costs
- $9,564
- Reserves months
- —
- Total cash needed
- —
Loan-product check · same deal, 3 products live
Conventional
25% down · 7.5% · 30yr
- Down + closing
- —
- Monthly P&I
- —
- Monthly cashflow
- —
- DSCR
- —
- Eligible?
- —
Personal DTI + credit; lowest rate.
DSCR
20% down · 8.5% · 30yr
- Down + closing
- —
- Monthly P&I
- —
- Monthly cashflow
- —
- DSCR
- —
- Eligible?
- —
No personal income docs; deal must DSCR.
Hard money
10% down · 12.0% · 12mo
- Down + closing
- —
- Monthly P&I
- —
- Monthly cashflow
- —
- DSCR
- —
- Eligible?
- —
Short-term bridge; refi at stabilization.
Rent comps 2 comps
| Address | Beds | Baths | Sqft | Rent | $/sqft | DOM | Units | Dist |
|---|---|---|---|---|---|---|---|---|
| 6370 Whirlaway Rd Graniteville, SC | 5.0 | 3.0 | 2830 | $2,755 | $0.97 | 13d | 1 | 0.24mi |
| 618 Count Fleet Ct Graniteville, SC | 4.0 | 2.5 | 2362 | $2,299 | $0.97 | 21d | 1 | 0.43mi |
Listing history 4 events
-
2026-06-18days on market $318,800 Active 3 DOM
-
2026-06-17days on market $318,800 Active 2 DOM
-
2026-06-15remarks 699-char remark
-
2026-06-15$318,800 Active 1 DOM
ⓘ Source: listings_history table (triggers on properties + properties_extension) + one-shot
backfill from property_details.listing_events for pre-trigger history.
Nearby sold comps map
Loading sold comps map…
Walkable amenities ~0.75 mi
Loading nearby amenities…
Taxation est. · year 1
- Rental income
- $35,018
- − Mortgage interest
- −$17,858
- − Property taxes
- −$4,782
- − Insurance
- −$1,594
- − Repairs & maintenance
- −$2,801
- − Management
- −$2,801
- − Depreciation
- −$9,274
- Taxable loss
- −$4,093
- Est. tax savings @ 24.0%
- +$982
- After-tax cash flow
- $2,209/yr
For passive investors: Depreciation is non-cash, so a rental often shows a tax loss while cash-flowing — sheltering income. Rental losses are passive: they offset passive income freely, and up to $25,000/yr can offset ordinary (W-2) income if you actively participate and your MAGI is under $100k (phasing out to $0 by $150k); unused losses carry forward. On sale, claimed depreciation is recaptured at up to 25%, and gains may owe capital-gains tax (a 1031 exchange can defer both). Figures are a year-1 estimate at your 24.0% rate — not tax advice; consult a CPA.
Condition & rehab AI · 12 photos
This move-in ready home is in excellent condition with modern finishes and a well-maintained exterior. It offers a great opportunity for a buyer seeking a turnkey property.
Value-add opportunities
- Both landscaping — enhances curb appeal and adds value
- Both smart home integration — increases home's marketability and convenience
Renovation cost estimate screening
Value-add ROI direction
- Both landscaping — enhances curb appeal and adds value ↑
- Both smart home integration — increases home's marketability and convenience ↑
ⓘ Cost ranges are severity-bucket heuristics (US national rule-of-thumb). Get contractor quotes + a written scope before underwriting a rehab budget.
Schools (NCES district)
- District
- Aiken 01
- NCES district ID
- 4500720
- Math proficiency
- 31% ▼ -11.00%
- Reading proficiency
- 44% ▼ -1.00%
- Median HH income
- $45,081
- Composite
- 31.91/100
- National rank
- #5857
- State rank
- #36 of 80 in SC
Livability — Burnettown
- Score
- 64/100
- State rank
- #159
- US rank
- #14711
Category grades
Schools grade is shown separately in the Schools card above.
Census & demographics
- County
- Aiken County · 116,534 people
- City population
- 12,385
- Metro
- Augusta-Richmond County, GA-SC
- Population (ZIP)
- 12,385
- Household income
- $84,228
- Rent vs Own
- Severe rent burden
- 213.0
Population outlook (Aiken County) Hauer SSP2
- Today (2025)
- 178,003 people
- By 2030
- 182,876 · +2.7%
- By 2040
- 189,970 · +6.7%
- By 2050
- 193,840 · +8.9%
- By 2075
- 199,453 · +12.1%
- By 2100
- 192,403 · +8.1%
Race, ethnicity, and origin ACS 2023
- Neighborhood character
- Diverse neighborhood (Simpson 0.58)
- Race & ethnicity
- White 59% Black 26% Hispanic / Latino 12% Two or more races 9% Asian 1%
- Hispanic origin (detail)
- Mexican 8% Puerto Rican 1%
- Common ancestry
- Italian 2% Swedish 2% Slovak 1%
- Foreign-born
- 6% · Canada
- Languages at home
- 89% English-only · Spanish 10% Other Indo-European 1%
Political lean MEDSL · Aiken
- 2024 margin
- Strong R (+25.9) · D 36.4% · R 62.2% · Other 1.4%
- 2008→2024 swing
- -1.9pp toward R · 2008: -24.0pp · 2024: -25.9pp
- All cycles
- 2024: R+25.9 2020: R+22.7 2016: R+27.5 2012: R+26.0 2008: R+24.0
Not yet ingested
- Civics
- —
Market trends
- HPI YoY
- ▲ 8.38%
- Current HPI
- 286.4155
- Rent YoY
- —
- Metro
- Augusta-Richmond County, GA-SC
- State GDP YoY
- ▲ 4.51%
- F500 in state
- 2
Industry mix (Fortune 500 HQ in SC)
| Industry | F500 HQs | Revenue |
|---|---|---|
| Packaging | 1 | $7B |
|
||
Cash-flow waterfall
monthlySold comps — $/sqft
last 12 mo · ≤1 miLoading sold comps…