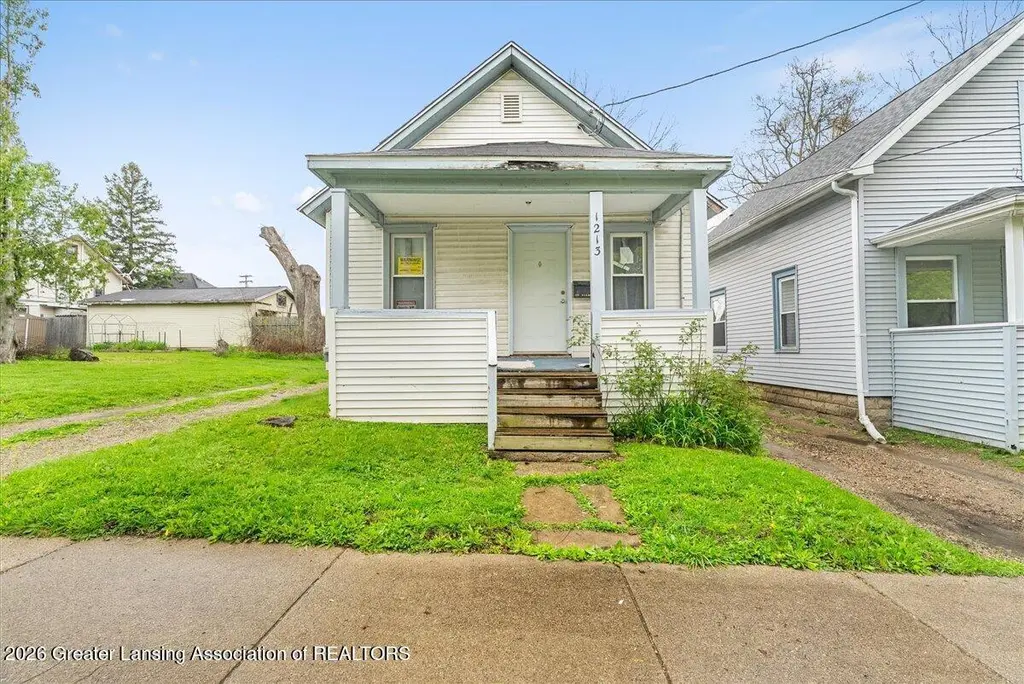
1213 E Kalamazoo St · Lansing, MI
Flood risk 1/10 · Minimal
- FEMA flood zone
- X (unshaded)
- Chance of flooding over 30 yrs
- 0.0%
- Est. flood insurance / yr
- $473 – $860
Fire risk 1/10 · Minimal
- Est. fire insurance / yr
- $784 – $1,456
Heat risk 2/10 · Minimal
- Hot days now (above 96°F)
- 7 days/yr
- Hot days in 30 yrs
- 14 days/yr
Wind risk 2/10 · Minimal
- Chance of severe wind over 30 yrs
- —
Air-quality risk 2/10 · Minimal
- Unhealthy air days now
- 1 days/yr
- Unhealthy air days in 30 yrs
- 2 days/yr
Risk factors via First Street. Map © Google.
Why this score? — see what drove the B- grade
The composite is a weighted blend of 9 inputs, each scored 0–100. Each bar is that input's sub-score; the figure is the points it added to the 100-point composite (weight × sub-score).
- Cash flow +23.0/30.0
- ARV discount +14.8/15.0
- 1% rule +9.3/10.0
- DSCR +7.4/10.0
- Rent growth +4.3/5.0
- Livability +4.0/5.0
- Condition / age +2.5/5.0
- Schools +1.9/10.0
- Appreciation +0.0/10.0
$74,500
🖨 Deal sheet (PDF) 📄 Offer letter ✓ Due diligence
Listing remarks MLS
Why rent when you can own? This charming 2-bedroom, 1-bath home offers an affordable opportunity to start building equity for less than the cost of rent. Step inside to find a functional layout with comfortable living space, a bright kitchen, and cozy bedrooms. Whether you're a first-time buyer, downsizing, or looking for an investment property, this home checks all the boxes for budget-friendly living. ADDITIONAL LOT INCLUDED. Don't miss your chance to own for less!
Key facts
- 4,356 sq ft lot
- Built 1904
- Listed 53 days
Property features AI
Exterior
- Parking: Driveway parking (no attached garage)
- Utilities: 100 amp electric service; Public sewer
- Home design: One-story property; Built in 1904; Located in the Green Oak subdivision; Directions: E on Kalamazoo
- Construction: Vinyl siding exterior; Shingle roof; Built in 1904
- Exterior features: Shingle roof; Vinyl siding; Lot about 0.1 acre (approx. 64 x 66)
Interior
- Kitchen: Range; Refrigerator
- Bedrooms: 2 bedrooms (Primary bedroom included)
- Bathrooms: 1 full bathroom
- Heating & cooling: Forced air heating; No central cooling
- Interior features: Basement is partial with concrete floor; Dining room; Living room
- Laundry & utility: Laundry located in basement
Neighborhood map
What this means for you Summary
Snapshot
- This is a 2-bed/1.0-bath single-family listed at $74k.
Deal economics
- At list price, monthly cash flow is $132 ($2k/yr) — positive.
- The deal already cash-flows at list — no discount required.
- Meets the 1% rule at list price ($1k rent vs $74k).
- Recommended offer: $72k (3.0% below list) — sets the bar for market timing.
- Cap rate 8.4% vs local median 6.0% in Lansing — top-decile yield for the area; either an underpriced asset or a hidden risk that comps aren't pricing in. Stress-test before assuming the spread holds.
Location & tenants
- Location reads 79/100 on livability (#94 in MI, #2,182 nationally) — a middle-class / working-renter tenant base. Strengths: amenities A+, commute A+, cost of living A+; Watch: employment D, crime F.
- Lansing Public School District (urban): math 14% / reading 23% proficiency, ranked #650 of 760 in MI (top 86%) — low school quality limits family demand, transient renter base, plan for 1-2y turnover; 68% free/reduced lunch — lower-income household profile, screen leases tightly.
- Zoned schools: Pattengill School (600 students, 88% FRL) — zoned schools average 88% FRL vs 68% district-wide (21 pts higher); higher-poverty schools than district average — tighter screening recommended.
- Market conditions: Rents rising fast (+7.0%/yr); 98 active listings in the ZIP; 30 comparable units currently listed for rent nearby; rentals lingering (median 46d on market — plan ~5-8 weeks vacancy on turnover, expect pricing pressure); 63% of comp listings sitting > 30 days — soft ceiling on asking rent; 350 units permitted in Ingham County in 2024 (186 in 5+ unit buildings).
Forward outlook
- Local home prices are declining (-3.0%/yr); year-one equity from $515 of loan paydown is wiped out by about $2k of value loss. Plan a longer hold.
- Ingham County population projected at +11% by 2050 — modest demand growth; plan on rents tracking national, not racing it.
- At projected returns (-3.0% appreciation + 7.0% rent growth), your $21k cash investment doubles in ~8 years — after that, you're playing with house money.
Negotiation context
- It's been on market 53 days — a 3% lower offer ($72k) is reasonable based on typical stale-listing flexibility.
- 5 sale attempts since 4y ago with the ask held roughly flat each time — persistent listings suggest the price (not the market) is what's stuck; bring a comps-based counter.
- Current owner paid $27k; list at $74k implies a 176% gain — meaningful room to come down on a strong offer.
Risks & watch-outs
- Watch-outs: property tax is 4.6% of price; built in 1904 — expect roof / HVAC / electrical / plumbing capex.
Questions for the listing agent
- It's been on market 53 days. Have you received any prior offers? Is the seller open to a 3% concession, seller financing, or rate buy-down credit?
- Built in 1904 — when were the roof, HVAC, electrical panel, plumbing, and water heater last replaced?
- Property tax is high relative to price — has the assessment been appealed recently, and will the sale trigger a re-assessment?
- Is there a deadline driving the sale (1031 exchange, divorce, estate, relocation)? That informs how much negotiation room exists.
- Schools are F-rated, which usually means shorter tenancies and higher turnover. Who's the typical renter profile here, and what's been the actual vacancy rate?
- Crime grade is F in this area — have there been break-ins, vandalism, or insurance claims at this property in the last 3 years? What carrier currently insures it and at what premium?
- What's the average days-on-market for RENTAL listings here right now (not sales)? A rising rental-DOM trend means longer vacancies and softer asking-rent achievability than the comps imply.
- What's the recent tenant-quality profile in this submarket — average credit score on applications, eviction rate, late-payment / NSF rate, and stable-employment percentage? A property-management company in the area should have these aggregated.
- How much new for-sale + rental construction is in the pipeline within 1–3 miles? Heavy new supply typically softens prices + rents 12–24 months out; constrained supply supports both.
Investment metrics
- 1% rule
- 1.43% ✓
- Cap rate
- 8.43%
- Cash-on-cash
- 7.62%
- DSCR
- 1.34
- GRM
- 5.8
CMA / ARV
- ARV (median comp)
- $88,934
- List price
- $74,500
- Delta
- -16.23%
- Verdict
- UNDERPRICED
- Comps
- 20 within 1.0 mi
Show comp detail 11 sales within ~0.75 mi
| Address | Dist | Beds/Ba | Sqft | Sold | Price | $/sf | Match |
|---|---|---|---|---|---|---|---|
| 906 Bensch St | 0.35mi | 2/1.0 | 704 (+9%) | 8mo | $50,000 | $71 | 62 |
| 515 S Clemens Ave | 0.62mi | 1/1.0 (-1) | 659 (+2%) | 5mo | $42,000 | $64 | 59 |
| 517 S Clemens Ave | 0.62mi | 2/1.0 | 693 (+7%) | 2mo | $58,000 | $84 | 57 |
| 506 S East St | 0.47mi | 2/1.0 | 720 (+12%) | 2mo | $52,000 | $72 | 57 |
| 1809 E Kalamazoo St | 0.49mi | 2/1.0 | 640 (-1%) | 23mo | $90,000 | $141 | 57 |
| 1245 Parkview St | 0.57mi | 3/1.0 (+1) | 702 (+9%) | 1mo | $112,000 | $160 | 54 |
| 2010 Prospect St | 0.62mi | 1/1.0 (-1) | 624 (-3%) | 14mo | $70,000 | $112 | 48 |
| 1231 S Holmes St | 0.70mi | 2/1.0 | 618 (-4%) | 16mo | $62,177 | $101 | 47 |
| 412 S Clemens Ave | 0.58mi | 2/1.0 | 701 (+8%) | 18mo | $104,900 | $150 | 43 |
| 1208 Lathrop St | 0.70mi | 3/1.0 (+1) | 670 (+4%) | 18mo | $60,000 | $90 | 41 |
| 423 S Magnolia Ave | 0.73mi | 2/1.0 | 732 (+13%) | 22mo | $81,000 | $111 | 25 |
Match score weights: distance 35% · size 25% · config 20% · recency 20%. Top-matched comps best support the ARV.
Projected returns pro-forma
-3.0% appreciation · 7.02% rent growth · sell at horizon
- IRR
- 1.2%
- Equity multiple
- 1.05×
- Total profit
- $981
- Equity at exit
- $11,108
- IRR
- 15.4%
- Equity multiple
- 2.55×
- Total profit
- $32,248
- Equity at exit
- $6,441
Cash invested: $20,860 (down + closing). Projections, not guarantees.
Landlord ↔ Tenant lean methodology
- Overall (STATE)
- 62 Landlord-Friendly
- State Michigan
- 62 Landlord-Friendly · EVEN
- County
- — inherits STATE
- City
- — inherits STATE
ZIP-level market 48912
- Rents YoY
- 7.0%
- Active inventory
- 98
- Price-to-rent
- 5.8×
Monthly cashflow live
- Estimated rent
- $1,065 high interval (Pro) →
- Mortgage (P&I)
- −$391
- Tax from tax record
- −$287 /mo · $3,447/yr
- Insurance
- −$31
- HOA
- −$0
- Lot rent
- −$0
- Vacancy / Maint / Mgmt
- −$224
- Net cashflow
- $132
Break-even live
Sensitivity live
| Price | -10% $378 | -5% $154 | +0% $132 | +5% $111 | +10% $90 |
|---|---|---|---|---|---|
| Rent | -10% $48 | -5% $90 | +0% $132 | +5% $175 | +10% $217 |
| Rate | -1.0pp $170 | -0.5pp $151 | base $132 | +0.5pp $113 | +1.0pp $94 |
UW: 25.0% down · 7.5% · 30yr · 1.5% tax · 5.0% vac · 8.0% maint · 8.0% mgmt
Financing live
Cash to close
- Down payment
- $18,625
- Closing costs
- $2,235
- Reserves months
- —
- Total cash needed
- —
Loan-product check · same deal, 3 products live
Conventional
25% down · 7.5% · 30yr
- Down + closing
- —
- Monthly P&I
- —
- Monthly cashflow
- —
- DSCR
- —
- Eligible?
- —
Personal DTI + credit; lowest rate.
DSCR
20% down · 8.5% · 30yr
- Down + closing
- —
- Monthly P&I
- —
- Monthly cashflow
- —
- DSCR
- —
- Eligible?
- —
No personal income docs; deal must DSCR.
Hard money
10% down · 12.0% · 12mo
- Down + closing
- —
- Monthly P&I
- —
- Monthly cashflow
- —
- DSCR
- —
- Eligible?
- —
Short-term bridge; refi at stabilization.
Rent comps 30 comps
| Address | Beds | Baths | Sqft | Rent | $/sqft | DOM | Units | Dist |
|---|---|---|---|---|---|---|---|---|
| 129 S Hosmer St Unit 1 Lansing, MI | 1.0 | 1.0 | 500 | $795 | $1.59 | 23d | 1 | 0.39mi |
| 2010 E Michigan Ave Unit 209 Lansing, MI | 1.0 | 1.0 | 730 | $1,350 | $1.85 | 16d | 1 | 0.65mi |
| 335 E Saint Joseph St Unit 6 Lansing, MI | 2.0 | 1.0 | 700 | $949 | $1.36 | 46d | 1 | 0.74mi |
| 2208 Marcus St Lansing, MI | 3.0 | 1.0 | 616 | $1,175 | $1.91 | 23d | 1 | 0.74mi |
| 509 Cherry St Unit 2 Lansing, MI | 1.0 | 1.0 | 550 | $975 | $1.77 | 23d | 1 | 0.77mi |
| 313 E Saint Joseph St Lansing, MI | 2.0 | 1.0 | 475 | $1,150 | $2.42 | 16d | 7 | 0.78mi |
| 1420 S Pennsylvania Ave Lansing, MI | 1.0 | 1.0 | 700 | $750 | $1.07 | 23d | 3 | 0.91mi |
| 1424 S Pennsylvania Ave Lansing, MI | 1.0 | 1.0 | 700 | $915 | $1.31 | 46d | 1 | 0.93mi |
| 825 S Washington Ave Apt 103 Lansing, MI | 1.0 | 1.0 | 520 | $1,095 | $2.11 | 46d | 1 | 0.97mi |
| 855 S Washington Ave Lansing, MI | 1.0 | 1.0 | 576 | $1,245 | $2.16 | 23d | 3 | 0.99mi |
| 855 S Washington Ave Lansing, MI | 1.0 | 1.0 | 576 | $1,245 | $2.16 | 46d | 9 | 0.99mi |
| 920 S Washington Ave Lansing, MI | 1.0–2.0 | 1.0–2.0 | 900 | $1,250 | $1.39 | 16d | 1 | 1.06mi |
| 936 N Fairview Ave Lansing, MI | 1.0–2.0 | 1.0 | 825 | $1,245 | $1.51 | 46d | 2 | 1.21mi |
| 420 S Walnut St Lansing, MI | 1.0 | 1.0 | 525 | $875 | $1.67 | 46d | 1 | 1.21mi |
| 515 S Chestnut St Lansing, MI | 1.0 | 1.0 | 646 | $942 | $1.46 | 16d | 8 | 1.24mi |
| 427 Seymour Ave Unit 205 Lansing, MI | 1.0 | 1.0 | 570 | $1,100 | $1.93 | 46d | 1 | 1.24mi |
| 427 Seymour Ave Unit 102 Lansing, MI | 1.0 | 1.0 | 540 | $850 | $1.57 | 23d | 1 | 1.24mi |
| 427 Seymour Ave Unit 315 Lansing, MI | 2.0 | 1.0 | 550 | $1,300 | $2.36 | 23d | 1 | 1.24mi |
| 427 Seymour Ave Unit 315 Lansing, MI | 2.0 | 1.0 | 550 | $1,300 | $2.36 | 46d | 1 | 1.24mi |
| 307 N Walnut St Unit 307 Lansing, MI | 1.0 | 1.0 | 550 | $1,100 | $2.00 | 46d | 1 | 1.26mi |
| 220 W Lapeer St Unit 3 Lansing, MI | 1.0 | 1.0 | 450 | $850 | $1.89 | 46d | 1 | 1.27mi |
| 801 N Capitol Ave Unit 1 Lansing, MI | 1.0 | 1.0 | 550 | $950 | $1.73 | 46d | 1 | 1.33mi |
| 801 N Capitol Ave Unit 4 Lansing, MI | 1.0 | 1.0 | 600 | $1,000 | $1.67 | 46d | 1 | 1.33mi |
| 316 W Saginaw St Unit 318 Lansing, MI | 1.0 | 1.0 | 750 | $950 | $1.27 | 46d | 1 | 1.37mi |
| 1025 N Washington Ave Unit 9 Lansing, MI | 1.0 | 1.0 | 670 | $1,000 | $1.49 | 46d | 1 | 1.43mi |
| 504 W Lapeer St Apt A Lansing, MI | 2.0 | 1.0 | 600 | $895 | $1.49 | 46d | 1 | 1.44mi |
| 1016 N Capitol Ave Unit 1 Lansing, MI | 1.0 | 1.0 | 700 | $850 | $1.21 | 46d | 1 | 1.45mi |
| 1016 N Capitol Ave Unit 3 Lansing, MI | 1.0 | 1.0 | 500 | $800 | $1.60 | 46d | 1 | 1.45mi |
| 826 N Walnut St Lansing, MI | 1.0 | 1.0 | 700 | $700 | $1.00 | 46d | 2 | 1.46mi |
| 917 Seymour Ave Unit 3 Lansing, MI | 1.0 | 1.0 | 475 | $800 | $1.68 | 46d | 1 | 1.47mi |
Listing history 29 events
-
2026-06-23days on market $74,500 Active 53 DOM
-
2026-06-21days on market $74,500 Active 52 DOM
-
2026-06-18days on market $74,500 Active 49 DOM
-
2026-06-17days on market $74,500 Active 48 DOM
-
2026-06-16days on market $74,500 Active 47 DOM
-
2026-06-15days on market $74,500 Active 46 DOM
-
2026-06-14days on market $74,500 Active 44 DOM
-
2026-06-13days on market $74,500 Active 43 DOM
-
2026-06-10days on market $74,500 Active 41 DOM
-
2026-06-09days on market $74,500 Active 40 DOM
-
2026-06-08days on market $74,500 Active 39 DOM
-
2026-06-07days on market $74,500 Active 38 DOM
-
2026-06-05days on market $74,500 Active 35 DOM
-
2026-06-03days on market $74,500 Active 34 DOM
-
2026-06-02days on market $74,500 Active 33 DOM
-
2026-06-01days on market $74,500 Active 32 DOM
-
2026-05-31days on market $74,500 Active 31 DOM
-
2026-05-30days on market $74,500 Active 30 DOM
-
2026-04-30$74,500 Active 471-char remark
Show marketing remark (471 chars)
Why rent when you can own? This charming 2-bedroom, 1-bath home offers an affordable opportunity to start building equity for less than the cost of rent. Step inside to find a functional layout with comfortable living space, a bright kitchen, and cozy bedrooms. Whether you're a first-time buyer, downsizing, or looking for an investment property, this home checks all the boxes for budget-friendly living. ADDITIONAL LOT INCLUDED. Don't miss your chance to own for less!
-
2026-04-30$74,500 Active 472-char remark
Show marketing remark (471 chars)
Why rent when you can own? This charming 2-bedroom, 1-bath home offers an affordable opportunity to start building equity for less than the cost of rent. Step inside to find a functional layout with comfortable living space, a bright kitchen, and cozy bedrooms. Whether you're a first-time buyer, downsizing, or looking for an investment property, this home checks all the boxes for budget-friendly living. ADDITIONAL LOT INCLUDED. Don't miss your chance to own for less!
-
2025-12-15historical
-
2025-12-15historical
-
2025-11-07price $75,000
-
2025-11-06price $75,000
-
2025-10-29$80,000 Active
-
2025-10-29$80,000 Active
-
2022-06-13historical
-
2022-03-09$69,900
-
2004-08-13soldstatus $27,000
ⓘ Source: listings_history table (triggers on properties + properties_extension) + one-shot
backfill from property_details.listing_events for pre-trigger history.
Tax reassessment forecast MI · Partial reset (capped growth)
- Current annual tax
- $3,447 · $287/mo
- Projected year-2 tax
- $3,447 · $287/mo
- Expected delta
- $0/yr ($0/mo · 0.0%)
ⓘ Screening estimate from a state-policy table — verify with the county assessor before closing.
Climate risk First Street
- Flood 1/10 Low FEMA zone X (unshaded) · 0% chance over 30 yrs
- Wildfire 1/10 Low
- Heat 2/10 Low 7 d/yr ≥96°F today · 14 d/yr by 30 yrs out
- Wind 2/10 Low
- Air quality 2/10 Low 1 unhealthy d/yr today · 2 by 30 yrs out
Nearby sold comps map
Loading sold comps map…
Walkable amenities ~0.75 mi
Loading nearby amenities…
Taxation est. · year 1
- Rental income
- $12,781
- − Mortgage interest
- −$4,173
- − Property taxes
- −$3,447
- − Insurance
- −$372
- − Repairs & maintenance
- −$1,022
- − Management
- −$1,022
- − Depreciation
- −$2,167
- Taxable income
- $576
- Est. tax owed @ 24.0%
- −$138
- After-tax cash flow
- $1,451/yr
For passive investors: Depreciation is non-cash, so a rental often shows a tax loss while cash-flowing — sheltering income. Rental losses are passive: they offset passive income freely, and up to $25,000/yr can offset ordinary (W-2) income if you actively participate and your MAGI is under $100k (phasing out to $0 by $150k); unused losses carry forward. On sale, claimed depreciation is recaptured at up to 25%, and gains may owe capital-gains tax (a 1031 exchange can defer both). Figures are a year-1 estimate at your 24.0% rate — not tax advice; consult a CPA.
Schools (NCES district)
- District
- Lansing Public School District
- NCES district ID
- 2621150
- Math proficiency
- 14% ▲ 1.00%
- Reading proficiency
- 23% ▲ 3.00%
- Median HH income
- $37,453
- Composite
- 18.76/100
- National rank
- #14002
- State rank
- #650 of 760 in MI
Livability — Lansing
- Score
- 79/100
- State rank
- #94
- US rank
- #2182
Category grades
Schools grade is shown separately in the Schools card above.
Census & demographics
- Census place
- Lansing, MI
- County
- Ingham County · 237,052 people
- City population
- 161,269
- Metro
- Lansing-East Lansing, MI
- Population (ZIP)
- 17,674
- Household income
- $54,429
- Rent vs Own
- Severe rent burden
- 1171.0
Population outlook (Ingham County) Hauer SSP2
- Today (2025)
- 300,362 people
- By 2030
- 307,808 · +2.5%
- By 2040
- 320,492 · +6.7%
- By 2050
- 333,223 · +10.9%
- By 2075
- 373,693 · +24.4%
- By 2100
- 392,021 · +30.5%
Race, ethnicity, and origin ACS 2023
- Neighborhood character
- Diverse neighborhood (Simpson 0.62)
- Race & ethnicity
- White 56% Black 22% Two or more races 12% Hispanic / Latino 10% Asian 4%
- Hispanic origin (detail)
- Mexican 6% Cuban 1%
- Common ancestry
- Romanian 5% Iranian 4% Lithuanian 3%
- Foreign-born
- 12% · Canada, Vietnam, China
- Languages at home
- 84% English-only · Spanish 5% French/Haitian/Cajun 1% Korean 1%
Political lean MEDSL · Ingham
- 2024 margin
- Strong D (+29.7) · D 63.9% · R 34.2% · Other 2.0%
- 2008→2024 swing
- -3.6pp toward R · 2008: 33.3pp · 2024: 29.7pp
- All cycles
- 2024: D+29.7 2020: D+32.2 2016: D+27.6 2012: D+27.9 2008: D+33.3
Not yet ingested
- Civics
- —
Market trends
- HPI YoY
- ▼ -167.67%
- Current HPI
- 171.1549
- Rent YoY
- ▲ 7.02%
- Metro
- Lansing-East Lansing, MI
- State GDP YoY
- ▲ 1.37%
- F500 in state
- 28
Industry mix (Fortune 500 HQ in MI)
| Industry | F500 HQs | Revenue |
|---|---|---|
| Automotive Parts | 3 | $48B |
|
||
| Automotive | 2 | $372B |
|
||
| Chemicals | 1 | $45B |
|
||
| Automotive Retail | 1 | $29B |
|
||
| Healthcare / Medical Devices | 1 | $23B |
|
||
| Automotive Technology | 1 | $20B |
|
||
Price history
+175.9% since first listed11 events — show timeline
- 2026-04-30 Listed $74,500 Greater Lansing AoR
- 2026-04-30 Listed $74,500 REALCOMP
- 2025-12-15 Listing Removed — MiRealSource-MiMLS
- 2025-12-15 Listing Removed — REALCOMP
- 2025-11-07 Price Changed $75,000 MiRealSource-MiMLS
- 2025-11-06 Price Changed $75,000 REALCOMP
- 2025-10-29 Listed $80,000 MiRealSource-MiMLS
- 2025-10-29 Listed $80,000 REALCOMP
- 2022-06-13 Listing Removed — REALCOMP
- 2022-03-09 Listed $69,900 REALCOMP
- 2004-08-13 Sold (Public Records) $27,000 Public Records
Property tax history
+12.1%/yrLatest (2025): $3,447 · -54.8% YoY. Source: county tax records.
Cash-flow waterfall
monthlySold comps — $/sqft
last 12 mo · ≤1 miLoading sold comps…