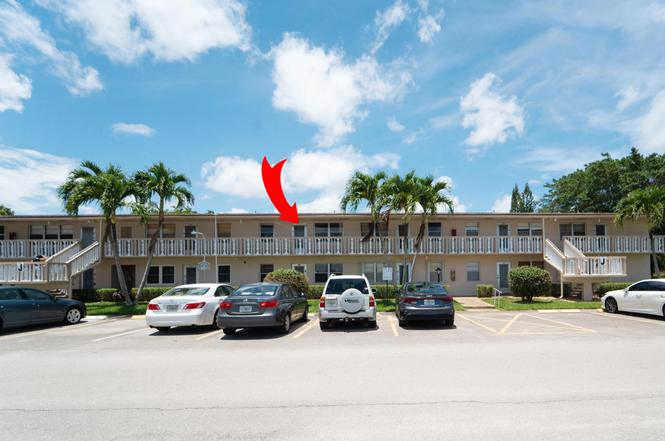
170 Kent J · West Palm Beach, FL
Flood risk 1/10 · Minimal
- FEMA flood zone
- X (unshaded)
- Chance of flooding over 30 yrs
- 0.0%
- Est. flood insurance / yr
- $507 – $1,088
Fire risk 5/10 · Moderate
- Est. fire insurance / yr
- $947 – $1,759
Heat risk 9/10 · Severe
- Hot days now (above 105°F)
- 7 days/yr
- Hot days in 30 yrs
- 24 days/yr
Wind risk 10/10 · Severe
- Chance of severe wind over 30 yrs
- 99.0%
Air-quality risk 2/10 · Minimal
- Unhealthy air days now
- 1 days/yr
- Unhealthy air days in 30 yrs
- 1 days/yr
Risk factors via First Street. Map © Google.
Why this score? — see what drove the D grade
The composite is a weighted blend of 9 inputs, each scored 0–100. Each bar is that input's sub-score; the figure is the points it added to the 100-point composite (weight × sub-score).
- Cash flow +10.4/30.0
- ARV discount +7.5/15.0
- 1% rule +6.2/10.0
- Schools +4.3/10.0
- Livability +4.1/5.0
- DSCR +3.0/10.0
- Rent growth +2.5/5.0
- Condition / age +2.5/5.0
- Appreciation +0.0/10.0
$135,000
🖨 Deal sheet 📄 Offer letter ✓ Due diligence
Listing remarks
Welcome home to this beautifully updated 2-bedroom, 1.5-bath residence located in the sought-after Century Village. Situated on the second floor, this move-in-ready unit features an updated kitchen, renovated bathrooms, updated flooring throughout, and an enclosed patio complete with a wall A/C unit, creating the perfect space for a sitting room, office, or additional living area. The Kent J building has already completed major improvements, including a new roof and exterior painting in 2021, and there are currently no assessments, offering added peace of mind for future owners. Century Village is one of West Palm Beach's premier 55+ communities, known for its resort-style amenities and act
Key facts
- $384 HOA
- Parking
- Community pool
Property features AI
Finance
- Financial info: Pets not allowed
- HOA & community: Association fees include cable TV, insurance, grounds maintenance, pest control, security, trash, common areas, reserve funds, roof repairs and recreation facility; Monthly HOA fee; Association amenities: boating, billiard room, clubhouse, fitness center, indoor pool, jogging path, laundry, picnic area, parking, outdoor pool, sauna, shuffleboard court, spa/hot tub, storage, tennis courts, community room, courtesy bus, heated pool, library, pickleball courts, sidewalks, gated access, security, recreation facilities
Exterior
- Parking: Assigned parking; Guest parking; One parking space
- Security: Gated community with guard
- Utilities: Public water; Public sewer; Cable available
- Home design: Condominium; Resale condition; Two-story building; Faces south
- Construction: CBS construction
- Exterior features: No waterfront; Shingle roof
Interior
- Kitchen: Electric range; Microwave; Refrigerator; Electric water heater
- Bedrooms: Two bedrooms on the main level
- Flooring: Ceramic tile
- Bathrooms: One full bathroom; One half bathroom
- Heating & cooling: Central heating; Central air; Ceiling fans; Central individual cooling
- Interior features: Walk-in closets; Partially furnished; Blinds on windows
- Laundry & utility: Common area laundry
Neighborhood map
What this means for you Summary
Snapshot
- This is a 2-bed/1.5-bath condo listed at $135k.
Deal economics
- At list price, monthly cash flow is $-71 ($-851/yr) — negative.
- To cash-flow at today's rent, offer at most $122k (9.3% below list).
- Meets the 1% rule at list price ($2k rent vs $135k).
- Recommended offer: $122k (9.3% below list) — sets the bar for cash-flow.
- Cap rate 5.7% vs local median 3.8% in West Palm Beach — top-decile yield for the area; either an underpriced asset or a hidden risk that comps aren't pricing in. Stress-test before assuming the spread holds.
Location & tenants
- Location reads 82/100 on livability (#75 in FL, #1,255 nationally) — a professional / high-income tenant draw. Strengths: commute A+, housing A+, health & safety A+; Watch: employment C-, crime F.
- Palm Beach (suburban): math 46% / reading 53% proficiency, ranked #34 of 73 in FL (top 47%) — families likely to look elsewhere, expect single-tenant / working-renter base with shorter leases.
- Market conditions: Rents flat; 473 active listings in the ZIP; 40 comparable units currently listed for rent nearby; rentals at typical pace (median 24d on market — plan ~3-4 weeks tenant-placement turnaround); 3,974 units permitted in Palm Beach County in 2024 (1,012 in 5+ unit buildings).
- This rent runs 35% of the median local income ($52k/yr) — at the standard rent-burdened threshold; future hikes will face affordability resistance.
Forward outlook
- Local home prices are declining (-3.0%/yr); year-one equity from $933 of loan paydown is wiped out by about $4k of value loss. Plan a longer hold.
- Palm Beach County population projected at +30% by 2050 — long-run rental-demand tailwind backs the buy-and-hold thesis.
Negotiation context
- Only 2 days on market — expect competitive offers; lowballing is unlikely to land.
- 2 sale attempts since 9y ago with the ask held roughly flat each time — persistent listings suggest the price (not the market) is what's stuck; bring a comps-based counter.
- Current owner paid $63k; list at $135k implies a 114% gain — meaningful room to come down on a strong offer.
Risks & watch-outs
- Watch-outs: HOA is 25% of rent.
- Climate carrying-cost: severe wind risk, 99% chance of damaging wind over 30y; moderate wildfire risk; extreme-heat days projected 7→24/yr by 2055 (HVAC capex compounding) — expect insurance premiums to compound above CPI over the hold.
Questions for the listing agent
- What do current leases actually rent for vs. the listed asking? Can we see a recent rent roll and the last 12 months of T-12 income?
- Built in 1973 — when were the roof, HVAC, electrical panel, plumbing, and water heater last replaced?
- What does the HOA fee cover, when was the last increase, and are there any pending special assessments or reserve-fund shortfalls?
- Any open or pending special assessments — roof, HVAC, plumbing, elevator, façade? What's the per-unit balance and payoff schedule, and is the seller paying it off at close or rolling it to the buyer?
- Is there a deadline driving the sale (1031 exchange, divorce, estate, relocation)? That informs how much negotiation room exists.
- Crime grade is F in this area — have there been break-ins, vandalism, or insurance claims at this property in the last 3 years? What carrier currently insures it and at what premium?
- The area grade is low — what's the realistic commute time and amenity access for the typical tenant pool here? Any planned neighborhood developments (good or bad) we should know about?
- What's the average days-on-market for RENTAL listings here right now (not sales)? A rising rental-DOM trend means longer vacancies and softer asking-rent achievability than the comps imply.
- What's the recent tenant-quality profile in this submarket — average credit score on applications, eviction rate, late-payment / NSF rate, and stable-employment percentage? A property-management company in the area should have these aggregated.
- How much new apartment / multifamily construction is in the pipeline within 1–3 miles? Heavy new supply (>2% of stock underway) typically softens rents 12–24 months out; light construction supports rent growth.
Investment metrics
- 1% rule
- 1.12% ✓
- Cap rate
- 5.66%
- Cash-on-cash
- -2.25%
- DSCR
- 0.90
- GRM
- 7.4
CMA / ARV
No comps found within radius.
Projected returns pro-forma
-3.0% appreciation · 0.02% rent growth · sell at horizon
- IRR
- -24.6%
- Equity multiple
- 0.19×
- Total profit
- $-30,581
- Equity at exit
- $20,129
- IRR
- -40.3%
- Equity multiple
- -0.29×
- Total profit
- $-48,592
- Equity at exit
- $11,672
Cash invested: $37,800 (down + closing). Projections, not guarantees.
Landlord ↔ Tenant lean methodology
- Overall (STATE)
- 87 Strongly Landlord-Friendly
- State Florida
- 87 Strongly Landlord-Friendly · R+3
- County
- — inherits STATE
- City
- — inherits STATE
ZIP-level market 33417
- Home prices YoY
- -29.2%
- Rents YoY
- 0.0%
- Active inventory
- 473
- Price-to-rent
- 7.4×
Monthly cashflow live
- Estimated rent
- $1,517 high interval (Pro) →
- Mortgage (P&I)
- −$708
- Tax from tax record
- −$121 /mo · $1,455/yr
- Insurance
- −$56
- HOA
- −$384
- Vacancy / Maint / Mgmt
- −$319
- Net cashflow
- $-71
Break-even live
UW: 25.0% down · 7.5% · 30yr · 1.5% tax · 5.0% vac · 8.0% maint · 8.0% mgmt
Financing live
Cash to close
- Down payment
- $33,750
- Closing costs
- $4,050
- Reserves months
- —
- Total cash needed
- —
Loan-product check · same deal, 3 products live
Conventional
25% down · 7.5% · 30yr
- Down + closing
- —
- Monthly P&I
- —
- Monthly cashflow
- —
- DSCR
- —
- Eligible?
- —
Personal DTI + credit; lowest rate.
DSCR
20% down · 8.5% · 30yr
- Down + closing
- —
- Monthly P&I
- —
- Monthly cashflow
- —
- DSCR
- —
- Eligible?
- —
No personal income docs; deal must DSCR.
Hard money
10% down · 12.0% · 12mo
- Down + closing
- —
- Monthly P&I
- —
- Monthly cashflow
- —
- DSCR
- —
- Eligible?
- —
Short-term bridge; refi at stabilization.
Rent comps 40 comps
| Address | Beds | Baths | Sqft | Rent | $/sqft | DOM | Units | Dist |
|---|---|---|---|---|---|---|---|---|
| 118 Kent H West Palm Beach, FL | 1.0 | 1.0 | 570 | $1,325 | $2.32 | 24d | 1 | 0.07mi |
| 107 Kent St Unit 107* West Palm Beach, FL | 1.0 | 1.0 | 570 | $1,500 | $2.63 | 24d | 1 | 0.10mi |
| 142 Kent I West Palm Beach, FL | 1.0 | 1.5 | 684 | $1,475 | $2.16 | 24d | 1 | 0.10mi |
| 210 Canterbury E Unit 1 West Palm Beach, FL | 1.0 | 1.0 | 570 | $1,375 | $2.41 | 12d | 1 | 0.15mi |
| 11 Cambridge E Unit 11 West Palm Beach, FL | 1.0 | 1.5 | 684 | $1,500 | $2.19 | 24d | 1 | 0.16mi |
| 51 Dorchester E Unit 51 West Palm Beach, FL | 1.0 | 1.0 | 570 | $1,400 | $2.46 | 24d | 1 | 0.16mi |
| 49 Cambridge B Unit B West Palm Beach, FL | 1.0 | 1.5 | 684 | $1,350 | $1.97 | 3d | 1 | 0.16mi |
| 49 Cambridge B Unit B West Palm Beach, FL | 1.0 | 1.5 | 684 | $1,450 | $2.12 | 24d | 1 | 0.16mi |
| 17 Cambridge a West Palm Beach, FL | 1.0 | 1.5 | 684 | $1,200 | $1.75 | 24d | 1 | 0.16mi |
| 175 Canterbury H #175 West Palm Beach, FL | 1.0 | 1.0 | 570 | $1,250 | $2.19 | 14d | 1 | 0.17mi |
| 201 Canterbury I Unit I West Palm Beach, FL | 1.0 | 1.0 | 570 | $1,250 | $2.19 | 24d | 1 | 0.17mi |
| 50 Canterbury B West Palm Beach, FL | 1.0 | 1.5 | 774 | $1,250 | $1.61 | 13d | 1 | 0.17mi |
| 1 Canterbury A Unit A West Palm Beach, FL | 2.0 | 1.5 | 798 | $1,595 | $2.00 | 24d | 1 | 0.17mi |
| 204 Canterbury I Unit I West Palm Beach, FL | 1.0 | 1.0 | 570 | $1,350 | $2.37 | 24d | 1 | 0.17mi |
| 333 Northampton Q Unit 333 West Palm Beach, FL | 1.0 | 1.0 | 570 | $1,300 | $2.28 | 24d | 1 | 0.18mi |
| 358 Chatham R Unit R West Palm Beach, FL | 1.0 | 1.5 | 684 | $1,295 | $1.89 | 24d | 1 | 0.19mi |
| 358 Chatham R Unit R West Palm Beach, FL | 1.0 | 1.5 | 684 | $1,200 | $1.75 | 18d | 1 | 0.19mi |
| 179 Canterbury H Unit H West Palm Beach, FL | 2.0 | 1.5 | 798 | $1,200 | $1.50 | 24d | 1 | 0.19mi |
| 179 Canterbury H West Palm Beach, FL | 2.0 | 1.5 | 798 | $1,200 | $1.50 | 1d | 1 | 0.19mi |
| 294 Chatham S Unit O West Palm Beach, FL | 1.0 | 1.0 | 645 | $1,300 | $2.02 | 24d | 1 | 0.19mi |
| 235 Northampton L #235 West Palm Beach, FL | 1.0 | 1.0 | 615 | $1,300 | $2.11 | 10d | 1 | 0.20mi |
| 188 Cambridge H Unit H West Palm Beach, FL | 1.0 | 1.5 | 684 | $1,345 | $1.97 | 5d | 1 | 0.22mi |
| 79 Dorchester E Unit 79 West Palm Beach, FL | 2.0 | 1.5 | 798 | $1,500 | $1.88 | 24d | 1 | 0.23mi |
| 245 Northampton M West Palm Beach, FL | 2.0 | 1.5 | 798 | $1,700 | $2.13 | 5d | 1 | 0.23mi |
| 243 Northampton M Unit M West Palm Beach, FL | 1.0 | 1.0 | 570 | $1,400 | $2.46 | 7d | 1 | 0.23mi |
| 145 Dorchester E Unit 145 West Palm Beach, FL | 1.0 | 1.5 | 646 | $1,300 | $2.01 | 7d | 1 | 0.23mi |
| 144 Dorchester G West Palm Beach, FL | 2.0 | 1.5 | 798 | $1,700 | $2.13 | 10d | 1 | 0.25mi |
| 144 Dorchester G West Palm Beach, FL | 2.0 | 1.5 | 798 | $1,700 | $2.13 | 12d | 1 | 0.25mi |
| 166 Sussex I Unit I West Palm Beach, FL | 1.0 | 1.0 | 570 | $1,500 | $2.63 | 24d | 1 | 0.25mi |
| 176 Sussex I Unit I West Palm Beach, FL | 1.0 | 1.0 | 570 | $1,400 | $2.46 | 17d | 1 | 0.25mi |
| 4 Sussex a West Palm Beach, FL | 1.0 | 1.0 | 615 | $1,350 | $2.20 | 14d | 1 | 0.25mi |
| 172 Sussex I Unit I West Palm Beach, FL | 1.0 | 1.0 | 570 | $1,500 | $2.63 | 24d | 1 | 0.25mi |
| 176 Sussex I Unit I West Palm Beach, FL | 1.0 | 1.0 | 570 | $1,400 | $2.46 | 24d | 1 | 0.25mi |
| 159 Sussex H West Palm Beach, FL | 1.0 | 1.0 | 570 | $1,350 | $2.37 | 24d | 1 | 0.25mi |
| 145 Northampton H Unit H West Palm Beach, FL | 2.0 | 1.5 | 798 | $1,800 | $2.26 | 7d | 1 | 0.26mi |
| 92 Berkshire Cres Unit 92 West Palm Beach, FL | 1.0 | 1.0 | 615 | $1,350 | $2.20 | 24d | 1 | 0.26mi |
| 110 Stratford N West Palm Beach, FL | 1.0 | 1.5 | 740 | $1,600 | $2.16 | 18d | 1 | 0.28mi |
| 149 Stratford N West Palm Beach, FL | 2.0 | 2.0 | 978 | $1,650 | $1.69 | 24d | 1 | 0.28mi |
| 74 Sheffield D Unit D West Palm Beach, FL | 2.0 | 1.5 | 798 | $1,400 | $1.75 | 24d | 1 | 0.28mi |
| 16 Sussex E Unit 16 West Palm Beach, FL | 1.0 | 1.0 | 570 | $1,350 | $2.37 | 12d | 1 | 0.28mi |
HOA detail condo
- Monthly dues
- $384 · $4,608/yr
- Assessments
- None detected in remarks — confirm with the listing agent.
Listing history 3 events
-
2026-06-18days on market $135,000 Active 2 DOM
-
2026-06-17remarks 699-char remark
-
2026-06-17$135,000 Active 1 DOM
ⓘ Source: listings_history table (triggers on properties + properties_extension) + one-shot
backfill from property_details.listing_events for pre-trigger history.
Tax reassessment forecast FL · Resets to sale price
- Current annual tax
- $1,455 · $121/mo
- Projected year-2 tax
- $1,455 · $121/mo
- Expected delta
- $0/yr ($0/mo · 0.0%)
ⓘ Screening estimate from a state-policy table — verify with the county assessor before closing.
Climate risk First Street
- Flood 1/10 Low FEMA zone X (unshaded) · 0% chance over 30 yrs
- Wildfire 5/10 Major
- Heat 9/10 Extreme 7 d/yr ≥105°F today · 24 d/yr by 30 yrs out
- Wind 10/10 Extreme 99% chance of damaging wind over 30 yrs
- Air quality 2/10 Low 1 unhealthy d/yr today · 1 by 30 yrs out
Nearby sold comps map
Loading sold comps map…
Walkable amenities ~0.75 mi
Loading nearby amenities…
Taxation est. · year 1
- Rental income
- $18,206
- − Mortgage interest
- −$7,562
- − Property taxes
- −$1,455
- − Insurance
- −$675
- − Repairs & maintenance
- −$1,456
- − Management
- −$1,456
- − HOA
- −$4,608
- − Depreciation
- −$3,927
- Taxable loss
- −$2,935
- Est. tax savings @ 24.0%
- +$704
- After-tax cash flow
- $-147/yr
For passive investors: Depreciation is non-cash, so a rental often shows a tax loss while cash-flowing — sheltering income. Rental losses are passive: they offset passive income freely, and up to $25,000/yr can offset ordinary (W-2) income if you actively participate and your MAGI is under $100k (phasing out to $0 by $150k); unused losses carry forward. On sale, claimed depreciation is recaptured at up to 25%, and gains may owe capital-gains tax (a 1031 exchange can defer both). Figures are a year-1 estimate at your 24.0% rate — not tax advice; consult a CPA.
Schools (NCES district)
- District
- Palm Beach
- NCES district ID
- 1201500
- Math proficiency
- 46% ▼ -16.00%
- Reading proficiency
- 53% ▼ -4.00%
- Median HH income
- $53,943
- Composite
- 42.72/100
- National rank
- #3160
- State rank
- #34 of 73 in FL
Livability — West Palm Beach
- Score
- 82/100
- State rank
- #75
- US rank
- #1255
Category grades
Schools grade is shown separately in the Schools card above.
Census & demographics
- County
- Palm Beach County · 1,438,312 people
- City population
- 222,012
- Metro
- Miami-Fort Lauderdale-Pompano Beach, FL
- Population (ZIP)
- 38,079
- Household income
- $51,605
- Rent vs Own
- Severe rent burden
- 2548.0
Population outlook (Palm Beach County) Hauer SSP2
- Today (2025)
- 1,637,487 people
- By 2030
- 1,743,255 · +6.5%
- By 2040
- 1,948,712 · +19.0%
- By 2050
- 2,132,979 · +30.3%
- By 2075
- 2,530,027 · +54.5%
- By 2100
- 2,706,979 · +65.3%
Race, ethnicity, and origin ACS 2023
- Neighborhood character
- Highly diverse neighborhood (Simpson 0.72)
- Race & ethnicity
- White 34% Black 30% Hispanic / Latino 27% Two or more races 16% Asian 3%
- Hispanic origin (detail)
- Mexican 3% Puerto Rican 6% Cuban 5% Dominican 2%
- Common ancestry
- Hispanic 10% Romanian 3% Scotch-Irish 1%
- Foreign-born
- 34% · Canada, Jamaica
- Languages at home
- 58% English-only · Spanish 24% French/Haitian/Cajun 11% Other Indo-European 3%
Political lean MEDSL · Palm Beach
- 2024 margin
- Toss-up / Even · D 50.0% · R 49.2%
- 2008→2024 swing
- -22.1pp toward R · 2008: 22.9pp · 2024: 0.8pp
- All cycles
- 2024: D+0.8 2020: D+12.8 2016: D+15.3 2012: D+17.0 2008: D+22.9
Not yet ingested
- Civics
- —
Market trends
- HPI YoY
- ▼ -138.62%
- Current HPI
- 335.8396
- Rent YoY
- ▬ 0.02%
- Metro
- Miami-Fort Lauderdale-Pompano Beach, FL
- State GDP YoY
- ▲ 3.28%
- F500 in state
- 36
Industry mix (Fortune 500 HQ in FL)
| Industry | F500 HQs | Revenue |
|---|---|---|
| Industrial Technology | 2 | $29B |
|
||
| Insurance | 2 | $17B |
|
||
| Retail | 1 | $60B |
|
||
| Technology Distribution | 1 | $58B |
|
||
| Homebuilding | 1 | $35B |
|
||
| Technology Manufacturing | 1 | $35B |
|
||
Price history
+487.0% since first listed7 events — show timeline
- 2026-06-15 Listed $135,000 Beaches MLS
- 2018-03-02 Listing Removed — Beaches MLS
- 2017-11-11 Listed $89,500 Beaches MLS
- 2017-08-04 Sold (Public Records) $63,000 Public Records
- 2013-09-03 Sold (Public Records) $18,000 Public Records
- 1998-03-26 Sold (Public Records) $23,000 Public Records
- 1997-12-17 Sold (Public Records) $23,000 Public Records
Property tax history
+6.9%/yrLatest (2025): $1,455 · -18.4% YoY. Source: county tax records.
Cash-flow waterfall
monthlySold comps — $/sqft
last 12 mo · ≤1 miLoading sold comps…