3044 Cesar Chavez Blvd · Fresno, CA
Flood risk No data
- FEMA flood zone
- —
- Chance of flooding over 30 yrs
- —
- Est. flood insurance / yr
- —
Fire risk No data
- Est. fire insurance / yr
- —
Heat risk No data
- Hot days now (above threshold)
- —
- Hot days in 30 yrs
- —
Wind risk No data
- Chance of severe wind over 30 yrs
- —
Air-quality risk No data
- Unhealthy air days now
- —
- Unhealthy air days in 30 yrs
- —
Risk factors via First Street. Map © Google.
Why this score? — see what drove the B grade
The composite is a weighted blend of 9 inputs, each scored 0–100. Each bar is that input's sub-score; the figure is the points it added to the 100-point composite (weight × sub-score).
- Cash flow +30.0/30.0
- DSCR +10.0/10.0
- 1% rule +8.2/10.0
- ARV discount +7.5/15.0
- Appreciation +4.4/10.0
- Livability +3.1/5.0
- Schools +2.7/10.0
- Rent growth +2.5/5.0
- Condition / age +2.5/5.0
$150,000
🖨 Deal sheet 📄 Offer letter ✓ Due diligence
Listing remarks
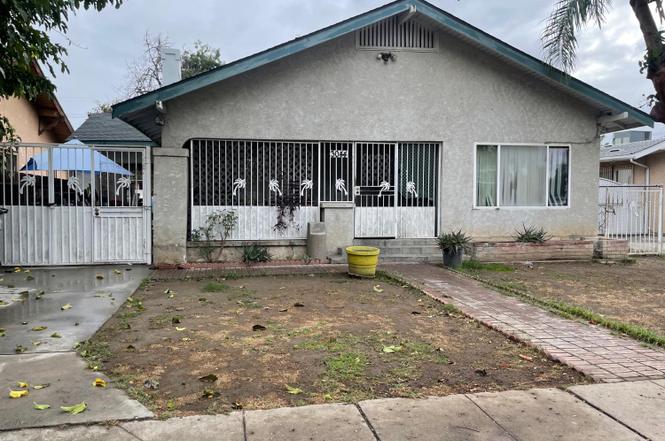
Investor Special - Full Rehab Opportunity!Calling all investors, flippers, and contractors! This 3-bedroom, 2-bathroom home offers over 1,800 sq ft of potential and is ready for a full renovation. Located in a desirable area, this property is perfect for those looking to restore and maximize value. The layout offers a spacious footprint with tons of upside for customization. Whether you're planning a full flip or long-term hold, this is your chance to transform a diamond in the rough into a standout property. Leased solar in place for added energy efficiency. Cash offers only. Property is being sold AS-IS. Buyer to perform all due diligence. Short Sale - Subject to lender approval.
Key facts
- Leased solar
- Spacious footprint
- Energy efficiency
Tags
Neighborhood map
What this means for you Summary
Snapshot
- This is a 3-bed/2.0-bath single-family listed at $150k.
Deal economics
- At list price, monthly cash flow is $622 ($7k/yr) — positive.
- The deal already cash-flows at list — no discount required.
- Meets the 1% rule at list price ($2k rent vs $150k).
- Cap rate 11.3% vs local median 3.7% in Fresno — top-decile yield for the area; either an underpriced asset or a hidden risk that comps aren't pricing in. Stress-test before assuming the spread holds.
Location & tenants
- Location reads 62/100 on livability (#469 in CA) — a middle-class / working-renter tenant base. Strengths: commute A+, housing A+; Watch: amenities D+, employment D+, crime F.
- Fresno Unified (urban): math 18% / reading 47% proficiency, ranked #327 of 517 in CA (top 63%) — families likely to look elsewhere, expect single-tenant / working-renter base with shorter leases; 77% free/reduced lunch — lower-income household profile, screen leases tightly.
- Zoned schools: Winchell Elementary (681 students, 95% FRL); Sequoia Middle (858 students, 97% FRL); Roosevelt High (math 14% / reading 41%, grade F, #780 of 1,170 statewide, top 67%, 2,228 students, 92% FRL) — zoned schools average 95% FRL vs 77% district-wide (18 pts higher); higher-poverty schools than district average — tighter screening recommended.
- Market conditions: 16 active listings in the ZIP; 5 comparable units currently listed for rent nearby; rentals lingering (median 44d on market — plan ~5-8 weeks vacancy on turnover, expect pricing pressure); 60% of comp listings sitting > 30 days — soft ceiling on asking rent; lower-income renter base — watch delinquency; 2,426 units permitted in Fresno County in 2024 (296 in 5+ unit buildings).
- At $1,976/mo this rent would consume 59% of the median local household income ($40k/yr) (locally 490% of renters already pay >50% of income on rent) — very limited rent-growth headroom before tenants either downsize or default.
Forward outlook
- Local home prices are declining (-1.2%/yr); year-one equity from $1k of loan paydown is wiped out by about $2k of value loss. Plan a longer hold.
- Fresno County population projected at +11% by 2050 — modest demand growth; plan on rents tracking national, not racing it.
- At projected returns (-1.2% appreciation + 3.0% rent growth), your $42k cash investment doubles in ~6 years — after that, you're playing with house money.
Negotiation context
- Only 7 days on market — expect competitive offers; lowballing is unlikely to land.
- 2 sale attempts since 2y ago with the ask held roughly flat each time — persistent listings suggest the price (not the market) is what's stuck; bring a comps-based counter.
- Current owner paid $38k; list at $150k implies a 295% gain — meaningful room to come down on a strong offer.
Risks & watch-outs
- Watch-outs: built in 1925 — expect roof / HVAC / electrical / plumbing capex.
Questions for the listing agent
- Built in 1925 — when were the roof, HVAC, electrical panel, plumbing, and water heater last replaced?
- Is there a deadline driving the sale (1031 exchange, divorce, estate, relocation)? That informs how much negotiation room exists.
- Schools are D-rated, which usually means shorter tenancies and higher turnover. Who's the typical renter profile here, and what's been the actual vacancy rate?
- Crime grade is F in this area — have there been break-ins, vandalism, or insurance claims at this property in the last 3 years? What carrier currently insures it and at what premium?
- What's the average days-on-market for RENTAL listings here right now (not sales)? A rising rental-DOM trend means longer vacancies and softer asking-rent achievability than the comps imply.
- What's the recent tenant-quality profile in this submarket — average credit score on applications, eviction rate, late-payment / NSF rate, and stable-employment percentage? A property-management company in the area should have these aggregated.
- How much new for-sale + rental construction is in the pipeline within 1–3 miles? Heavy new supply typically softens prices + rents 12–24 months out; constrained supply supports both.
Investment metrics
- 1% rule
- 1.32% ✓
- Cap rate
- 11.27%
- Cash-on-cash
- 17.76%
- DSCR
- 1.79
- GRM
- 6.3
CMA / ARV
- ARV (on-the-fly)
- $367,236
- Comps found
- 11
Show comp detail 11 sales within ~0.75 mi
| Address | Dist | Beds/Ba | Sqft | Sold | Price | $/sf | Match |
|---|---|---|---|---|---|---|---|
| 555 S Raisina | 0.16mi | 3/1.8 | 1,770 (-3%) | 1mo | $350,000 | $198 | 86 |
| 3042 E Gilbert Ave | 0.10mi | 3/1.8 | 1,904 (+5%) | 14mo | $345,000 | $181 | 75 |
| 3264 E Kerckhoff Ave | 0.45mi | 3/2.0 | 1,773 (-2%) | 11mo | $340,000 | $192 | 66 |
| 3171 E Balch Ave | 0.30mi | 4/1.8 (+1) | 1,708 (-6%) | 8mo | $345,000 | $202 | 63 |
| 3347 E Mono | 0.40mi | 3/2.0 | 1,748 (-4%) | 19mo | $275,000 | $157 | 59 |
| 3525 E Ventura Ave | 0.54mi | 3/2.0 | 1,784 (-2%) | 17mo | $360,000 | $202 | 57 |
| 2917 E Donahoo St | 0.14mi | 3/1.8 | 1,606 (-12%) | 19mo | $365,000 | $227 | 57 |
| 3659 Mono St | 0.69mi | 4/1.8 (+1) | 1,628 (-10%) | 10mo | $355,000 | $218 | 37 |
| 3438 E El Monte Way | 0.48mi | 4/1.0 (+1) | 1,623 (-11%) | 17mo | $245,000 | $151 | 36 |
| 3659 Mono St | 0.69mi | 4/1.0 (+1) | 1,628 (-10%) | 10mo | $355,000 | $218 | 33 |
| 3606 E Platt Ave | 0.73mi | 3/1.0 | 1,561 (-14%) | 16mo | $325,000 | $208 | 25 |
Match score weights: distance 35% · size 25% · config 20% · recency 20%. Top-matched comps best support the ARV.
Projected returns pro-forma
-1.18% appreciation · 3.0% rent growth · sell at horizon
- IRR
- 14.4%
- Equity multiple
- 1.64×
- Total profit
- $27,039
- Equity at exit
- $34,901
- IRR
- 20.5%
- Equity multiple
- 3.03×
- Total profit
- $85,366
- Equity at exit
- $35,546
Cash invested: $42,000 (down + closing). Projections, not guarantees.
Landlord ↔ Tenant lean methodology
- Overall (STATE)
- 18 Strongly Tenant-Friendly
- State California
- 18 Strongly Tenant-Friendly · D+13
- County
- — inherits STATE
- City
- — inherits STATE
ZIP-level market 93721
- Home prices YoY
- -0.3%
- Active inventory
- 16
- Price-to-rent
- 6.3×
Monthly cashflow live
- Estimated rent
- $1,976 high interval (Pro) →
- Mortgage (P&I)
- −$787
- Tax from tax record
- −$90 /mo · $1,079/yr
- Insurance
- −$62
- HOA
- −$0
- Vacancy / Maint / Mgmt
- −$415
- Net cashflow
- $622
Break-even live
UW: 25.0% down · 7.5% · 30yr · 1.5% tax · 5.0% vac · 8.0% maint · 8.0% mgmt
Financing live
Cash to close
- Down payment
- $37,500
- Closing costs
- $4,500
- Reserves months
- —
- Total cash needed
- —
Loan-product check · same deal, 3 products live
Conventional
25% down · 7.5% · 30yr
- Down + closing
- —
- Monthly P&I
- —
- Monthly cashflow
- —
- DSCR
- —
- Eligible?
- —
Personal DTI + credit; lowest rate.
DSCR
20% down · 8.5% · 30yr
- Down + closing
- —
- Monthly P&I
- —
- Monthly cashflow
- —
- DSCR
- —
- Eligible?
- —
No personal income docs; deal must DSCR.
Hard money
10% down · 12.0% · 12mo
- Down + closing
- —
- Monthly P&I
- —
- Monthly cashflow
- —
- DSCR
- —
- Eligible?
- —
Short-term bridge; refi at stabilization.
Rent comps 5 comps
| Address | Beds | Baths | Sqft | Rent | $/sqft | DOM | Units | Dist |
|---|---|---|---|---|---|---|---|---|
| 3154 E Montecito Ave Fresno, CA | 2.0 | 1.0 | 1240 | $1,800 | $1.45 | 23d | 1 | 0.26mi |
| 2890 Huntington Blvd #121 Fresno, CA | 3.0 | 2.5 | 1623 | $2,200 | $1.36 | 43d | 1 | 0.29mi |
| 1525 Van Ness Ave Unit 101FB Fresno, CA | 2.0 | 3.5 | 2383 | $3,150 | $1.32 | 43d | 1 | 1.13mi |
| 1612 Fulton St Unit 103 Fresno, CA | 2.0 | 2.5 | 1613 | $2,250 | $1.39 | 43d | 1 | 1.28mi |
| 1759 Fulton St Fresno, CA | 2.0 | 1.0–2.5 | 882 | $1,900 | $2.15 | 1d | 1 | 1.37mi |
Listing history 5 events
-
2025-10-23status Pending
-
2025-10-16$150,000 Active
-
2024-07-03status Pending
-
2024-06-18$250,000 Active
-
1984-02-21soldstatus $38,000
ⓘ Source: listings_history table (triggers on properties + properties_extension) + one-shot
backfill from property_details.listing_events for pre-trigger history.
Tax reassessment forecast CA · Resets to sale price
- Current annual tax
- $1,079 · $90/mo
- Projected year-2 tax
- $1,140 · $95/mo
- Expected delta
- +$61/yr (+$5/mo · 5.6%)
ⓘ Screening estimate from a state-policy table — verify with the county assessor before closing.
Nearby sold comps map
Loading sold comps map…
Walkable amenities ~0.75 mi
Loading nearby amenities…
Taxation est. · year 1
- Rental income
- $23,707
- − Mortgage interest
- −$8,402
- − Property taxes
- −$1,079
- − Insurance
- −$750
- − Repairs & maintenance
- −$1,897
- − Management
- −$1,897
- − Depreciation
- −$4,364
- Taxable income
- $5,318
- Est. tax owed @ 24.0%
- −$1,276
- After-tax cash flow
- $6,183/yr
For passive investors: Depreciation is non-cash, so a rental often shows a tax loss while cash-flowing — sheltering income. Rental losses are passive: they offset passive income freely, and up to $25,000/yr can offset ordinary (W-2) income if you actively participate and your MAGI is under $100k (phasing out to $0 by $150k); unused losses carry forward. On sale, claimed depreciation is recaptured at up to 25%, and gains may owe capital-gains tax (a 1031 exchange can defer both). Figures are a year-1 estimate at your 24.0% rate — not tax advice; consult a CPA.
Schools (NCES district)
- District
- Fresno Unified
- NCES district ID
- 0614550
- Math proficiency
- 18% ▼ -12.00%
- Reading proficiency
- 47% ▲ 9.00%
- Median HH income
- $36,095
- Composite
- 26.83/100
- National rank
- #7111
- State rank
- #327 of 517 in CA
Livability — Fresno
- Score
- 62/100
- State rank
- #469
- US rank
- #15907
Category grades
Schools grade is shown separately in the Schools card above.
Census & demographics
- Census place
- Fresno, CA
- County
- Fresno County · 834,801 people
- City population
- 593,114
- Metro
- Fresno, CA
- Population (ZIP)
- 7,225
- Household income
- $40,033
- Rent vs Own
- Severe rent burden
- 490.0
Population outlook (Fresno County) Hauer SSP2
- Today (2025)
- 1,042,971 people
- By 2030
- 1,072,198 · +2.8%
- By 2040
- 1,122,408 · +7.6%
- By 2050
- 1,157,251 · +11.0%
- By 2075
- 1,182,575 · +13.4%
- By 2100
- 1,105,899 · +6.0%
Race, ethnicity, and origin ACS 2023
- Neighborhood character
- Diverse neighborhood (Simpson 0.60)
- Race & ethnicity
- Hispanic / Latino 57% White 24% Two or more races 22% Black 13% Asian 2% Native American 2%
- Hispanic origin (detail)
- Mexican 50%
- Common ancestry
- Iranian 1% Romanian 1% Russian 1%
- Foreign-born
- 14% · Canada
- Languages at home
- 62% English-only · Spanish 34% Other Asian/Pacific 2% Other Indo-European 1%
Political lean MEDSL · Fresno
- 2024 margin
- Toss-up / Even · D 46.5% · R 50.9% · Other 2.6%
- 2008→2024 swing
- -6.5pp toward R · 2008: 2.1pp · 2024: -4.4pp
- All cycles
- 2024: R+4.4 2020: D+7.8 2016: D+3.9 2012: R+2.9 2008: D+2.1
Not yet ingested
- Civics
- —
Market trends
- HPI YoY
- ▼ -1.18%
- Current HPI
- 392.4548
- Rent YoY
- —
- Metro
- Fresno, CA
- State GDP YoY
- ▲ 3.21%
- F500 in state
- 116
Industry mix (Fortune 500 HQ in CA)
| Industry | F500 HQs | Revenue |
|---|---|---|
| Technology | 27 | $1,492B |
|
||
| Financial Services | 3 | $174B |
|
||
| Retail | 3 | $44B |
|
||
| Insurance | 3 | $26B |
|
||
| Media / Entertainment | 2 | $115B |
|
||
| Pharmaceuticals / Biotech | 2 | $62B |
|
||
Price history
+294.7% since first listed5 events — show timeline
- 2025-10-23 Pending — FRESNOMLS
- 2025-10-16 Listed $150,000 FRESNOMLS
- 2024-07-03 Pending — FRESNOMLS
- 2024-06-18 Listed $250,000 FRESNOMLS
- 1984-02-21 Sold (Public Records) $38,000 Public Records
Property tax history
+2.3%/yrLatest (2025): $1,079 · +3.9% YoY. Source: county tax records.
Cash-flow waterfall
monthlySold comps — $/sqft
last 12 mo · ≤1 miLoading sold comps…