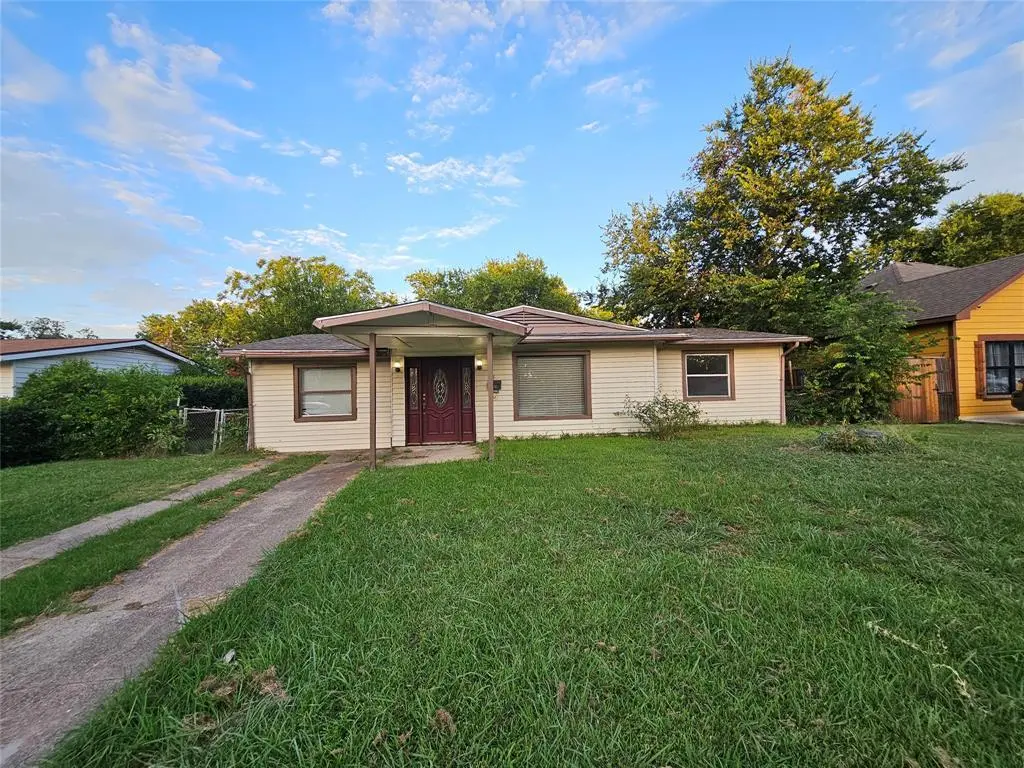
118 Fielding Dr · Mesquite, TX
Flood risk 1/10 · Minimal
- FEMA flood zone
- X (unshaded)
- Chance of flooding over 30 yrs
- 0.0%
- Est. flood insurance / yr
- $507 – $1,088
Fire risk 1/10 · Minimal
- Est. fire insurance / yr
- $1,222 – $2,270
Heat risk 7/10 · Major
- Hot days now (above 111°F)
- 7 days/yr
- Hot days in 30 yrs
- 24 days/yr
Wind risk 6/10 · Moderate
- Chance of severe wind over 30 yrs
- 27.0%
Air-quality risk 2/10 · Minimal
- Unhealthy air days now
- 1 days/yr
- Unhealthy air days in 30 yrs
- 2 days/yr
Risk factors via First Street. Map © Google.
Why this score? — see what drove the C grade
The composite is a weighted blend of 9 inputs, each scored 0–100. Each bar is that input's sub-score; the figure is the points it added to the 100-point composite (weight × sub-score).
- Cash flow +18.7/30.0
- ARV discount +15.0/15.0
- DSCR +5.9/10.0
- 1% rule +5.6/10.0
- Livability +3.5/5.0
- Schools +2.9/10.0
- Rent growth +2.6/5.0
- Condition / age +2.5/5.0
- Appreciation +0.0/10.0
$164,500
🖨 Deal sheet 📄 Offer letter ✓ Due diligence
Listing remarks MLS
Don't miss out on this greatly located 3 bedroom 1 bath home featuring an open floor plan with a spacious backyard! The inviting comfortable layout is sprawling with hardwood floors, upscale lighting and ceiling fans throughout! The living area flows into the kitchen, which features plenty of cabinet space. Step outside to discover a large, fully fenced backyard, perfect for outdoor entertaining, gardening, or simply relaxing under the Texas sky. The ample space is ideal for summer barbecues. Located in a quiet, friendly neighborhood, this home is conveniently close to schools, parks, shopping, and dining. Close to Hypermarkets, and Mesquite Rodeo development. Quick and Easy access to 635 and just 17 minutes away from downtown Dallas. The tax record shows 2 bedrooms However the garage was converted into a 3rd bedroom with an AC unit installed. A slab of concrete is in the backyard perfect for a shed to sit on.
Key facts
- Upscale lighting
- Open floor plan
- Spacious backyard
Tags
Neighborhood map
What this means for you Summary
Snapshot
- This is a 2-bed/1.0-bath single-family listed at $164k.
Deal economics
- At list price, monthly cash flow is $162 ($2k/yr) — positive.
- The deal already cash-flows at list — no discount required.
- Meets the 1% rule at list price ($2k rent vs $164k).
- Recommended offer: $145k (12.0% below list) — sets the bar for market timing.
- Cap rate 7.5% vs local median 4.4% in Mesquite — top-decile yield for the area; either an underpriced asset or a hidden risk that comps aren't pricing in. Stress-test before assuming the spread holds.
Location & tenants
- Location reads 70/100 on livability (#358 in TX) — a middle-class / working-renter tenant base. Strengths: cost of living A+, housing A+, health & safety A-; Watch: schools C-, crime F, commute F.
- Mesquite ISD (suburban): math 35% / reading 32% proficiency, ranked #536 of 826 in TX (top 65%) — families likely to look elsewhere, expect single-tenant / working-renter base with shorter leases; 63% free/reduced lunch — lower-income household profile, screen leases tightly.
- Market conditions: Rents flat; 340 active listings in the ZIP; 15 comparable units currently listed for rent nearby; rentals at typical pace (median 21d on market — plan ~3-4 weeks tenant-placement turnaround); 40% of comp listings sitting > 30 days — soft ceiling on asking rent; 12,577 units permitted in Dallas County in 2024 (6,829 in 5+ unit buildings).
Forward outlook
- Local home prices are declining (-3.0%/yr); year-one equity from $1k of loan paydown is wiped out by about $5k of value loss. Plan a longer hold.
- Dallas County population projected at +35% by 2050 — long-run rental-demand tailwind backs the buy-and-hold thesis.
Negotiation context
- It's been on market 123 days — a 12% lower offer ($145k) is reasonable based on typical stale-listing flexibility.
- 4 sale attempts with the ask held roughly flat each time — persistent listings suggest the price (not the market) is what's stuck; bring a comps-based counter.
Risks & watch-outs
- Watch-outs: built in 1955 — expect roof / HVAC / electrical / plumbing capex.
- Climate carrying-cost: major wind risk, 27% chance of damaging wind over 30y; extreme-heat days projected 7→24/yr by 2055 (HVAC capex compounding) — expect insurance premiums to compound above CPI over the hold.
Questions for the listing agent
- It's been on market 123 days. Have you received any prior offers? Is the seller open to a 12% concession, seller financing, or rate buy-down credit?
- Built in 1955 — when were the roof, HVAC, electrical panel, plumbing, and water heater last replaced?
- Why hasn't it sold? Are there any deal-killer items the seller is aware of (foundation, flood, title, zoning, code violations)?
- Is there a deadline driving the sale (1031 exchange, divorce, estate, relocation)? That informs how much negotiation room exists.
- Crime grade is F in this area — have there been break-ins, vandalism, or insurance claims at this property in the last 3 years? What carrier currently insures it and at what premium?
- What's the average days-on-market for RENTAL listings here right now (not sales)? A rising rental-DOM trend means longer vacancies and softer asking-rent achievability than the comps imply.
- What's the recent tenant-quality profile in this submarket — average credit score on applications, eviction rate, late-payment / NSF rate, and stable-employment percentage? A property-management company in the area should have these aggregated.
- How much new for-sale + rental construction is in the pipeline within 1–3 miles? Heavy new supply typically softens prices + rents 12–24 months out; constrained supply supports both.
Investment metrics
- 1% rule
- 1.06% ✓
- Cap rate
- 7.47%
- Cash-on-cash
- 4.22%
- DSCR
- 1.19
- GRM
- 7.8
CMA / ARV
- ARV (median comp)
- $211,546
- List price
- $164,500
- Delta
- -22.24%
- Verdict
- UNDERPRICED
- Comps
- 20 within 1.0 mi
Show comp detail 3 sales within ~0.75 mi
| Address | Dist | Beds/Ba | Sqft | Sold | Price | $/sf | Match |
|---|---|---|---|---|---|---|---|
| 114 Danbury Dr | 0.24mi | 3/1.0 (+1) | 988 (+11%) | 13mo | $204,900 | $207 | 55 |
| 331 Andover Dr | 0.43mi | 3/1.0 (+1) | 1,019 (+15%) | 9mo | $230,000 | $226 | 44 |
| 329 Meriden Ln | 0.54mi | 3/1.0 (+1) | 828 (-7%) | 22mo | $200,000 | $242 | 40 |
Match score weights: distance 35% · size 25% · config 20% · recency 20%. Top-matched comps best support the ARV.
Projected returns pro-forma
-3.0% appreciation · 0.22% rent growth · sell at horizon
- IRR
- -13.0%
- Equity multiple
- 0.54×
- Total profit
- $-21,026
- Equity at exit
- $24,527
- IRR
- -9.4%
- Equity multiple
- 0.50×
- Total profit
- $-23,197
- Equity at exit
- $14,223
Cash invested: $46,060 (down + closing). Projections, not guarantees.
Landlord ↔ Tenant lean methodology
- Overall (STATE)
- 87 Strongly Landlord-Friendly
- State Texas
- 87 Strongly Landlord-Friendly · R+5
- County
- — inherits STATE
- City
- — inherits STATE
ZIP-level market 75149
- Home prices YoY
- -27.4%
- Rents YoY
- 0.2%
- Active inventory
- 340
- Price-to-rent
- 7.8×
Monthly cashflow live
- Estimated rent
- $1,750 high interval (Pro) →
- Mortgage (P&I)
- −$863
- Tax from tax record
- −$289 /mo · $3,472/yr
- Insurance
- −$69
- HOA
- −$0
- Vacancy / Maint / Mgmt
- −$367
- Net cashflow
- $162
Break-even live
UW: 25.0% down · 7.5% · 30yr · 1.5% tax · 5.0% vac · 8.0% maint · 8.0% mgmt
Financing live
Cash to close
- Down payment
- $41,125
- Closing costs
- $4,935
- Reserves months
- —
- Total cash needed
- —
Loan-product check · same deal, 3 products live
Conventional
25% down · 7.5% · 30yr
- Down + closing
- —
- Monthly P&I
- —
- Monthly cashflow
- —
- DSCR
- —
- Eligible?
- —
Personal DTI + credit; lowest rate.
DSCR
20% down · 8.5% · 30yr
- Down + closing
- —
- Monthly P&I
- —
- Monthly cashflow
- —
- DSCR
- —
- Eligible?
- —
No personal income docs; deal must DSCR.
Hard money
10% down · 12.0% · 12mo
- Down + closing
- —
- Monthly P&I
- —
- Monthly cashflow
- —
- DSCR
- —
- Eligible?
- —
Short-term bridge; refi at stabilization.
Rent comps 15 comps
| Address | Beds | Baths | Sqft | Rent | $/sqft | DOM | Units | Dist |
|---|---|---|---|---|---|---|---|---|
| 112 Derby Ln Mesquite, TX | 3.0 | 1.0 | 1104 | $1,650 | $1.49 | 16d | 1 | 0.27mi |
| 303 Ridgefield Cir Mesquite, TX | 3.0 | 1.0 | 1021 | $2,095 | $2.05 | 12d | 1 | 0.32mi |
| 303 Ridgefield Cir Mesquite, TX | 3.0 | 1.0 | 1021 | $2,095 | $2.05 | 19d | 1 | 0.32mi |
| 303 Ridgefield Cir Mesquite, TX | 3.0 | 1.0 | 1021 | $2,095 | $2.05 | 24d | 1 | 0.32mi |
| 2603 Winter Oak St Dallas, TX | 3.0 | 2.0 | 1004 | $1,921 | $1.91 | 43d | 1 | 0.84mi |
| 2540 Winter Oak St Dallas, TX | 3.0 | 2.0 | 994 | $1,750 | $1.76 | 20d | 1 | 0.89mi |
| 10611 Woodleaf Dr Dallas, TX | 2.0 | 2.0 | 959 | $1,695 | $1.77 | 16d | 1 | 0.90mi |
| 10611 Woodleaf Dr Dallas, TX | 2.0 | 2.0 | 959 | $1,650 | $1.72 | 7d | 1 | 0.90mi |
| 2255 W Bruton Rd Mesquite, TX | 1.0–3.0 | 1.0–2.0 | 957 | $1,568 | $1.64 | 43d | 12 | 1.21mi |
| 9666 Scyene Rd Dallas, TX | 1.0–2.0 | 1.0–2.0 | 753 | $1,286 | $1.71 | 2d | 21 | 1.24mi |
| 2632 Sybil Dr Mesquite, TX | 3.0 | 1.5 | 988 | $1,645 | $1.66 | 43d | 1 | 1.27mi |
| 2255 Nantucket Village Dr Dallas, TX | 3.0 | 2.0 | 1037 | $1,625 | $1.57 | 43d | 1 | 1.28mi |
| 10320 Nantucket Village Ct Dallas, TX | 3.0 | 2.0 | 1037 | $1,645 | $1.59 | 43d | 1 | 1.35mi |
| 940 Military Pkwy Mesquite, TX | 1.0 | 1.0 | 660 | $960 | $1.45 | 2d | 1 | 1.39mi |
| 940 W Kearney St Mesquite, TX | 1.0 | 2.0 | 779 | $1,000 | $1.28 | 43d | 1 | 1.41mi |
Listing history 22 events
-
2026-06-15status $164,500 Pending 123 DOM
-
2026-06-13days on market $164,500 Active 123 DOM
-
2026-06-13days on market $164,500 Active 122 DOM
-
2026-06-09days on market $164,500 Active 119 DOM
-
2026-06-08days on market $164,500 Active 118 DOM
-
2026-06-07days on market $164,500 Active 117 DOM
-
2026-06-04days on market $164,500 Active 114 DOM
-
2026-06-03days on market $164,500 Active 113 DOM
-
2026-06-02days on market $164,500 Active 112 DOM
-
2026-06-01days on market $164,500 Active 111 DOM
-
2026-05-31days on market $164,500 Active 110 DOM
-
2026-02-10$164,500 Active 924-char remark
Show marketing remark (924 chars)
Don't miss out on this greatly located 3 bedroom 1 bath home featuring an open floor plan with a spacious backyard! The inviting comfortable layout is sprawling with hardwood floors, upscale lighting and ceiling fans throughout! The living area flows into the kitchen, which features plenty of cabinet space. Step outside to discover a large, fully fenced backyard, perfect for outdoor entertaining, gardening, or simply relaxing under the Texas sky. The ample space is ideal for summer barbecues. Located in a quiet, friendly neighborhood, this home is conveniently close to schools, parks, shopping, and dining. Close to Hypermarkets, and Mesquite Rodeo development. Quick and Easy access to 635 and just 17 minutes away from downtown Dallas. The tax record shows 2 bedrooms However the garage was converted into a 3rd bedroom with an AC unit installed. A slab of concrete is in the backyard perfect for a shed to sit on.
-
2026-02-10historical
Show marketing remark (924 chars)
Don't miss out on this greatly located 3 bedroom 1 bath home featuring an open floor plan with a spacious backyard! The inviting comfortable layout is sprawling with hardwood floors, upscale lighting and ceiling fans throughout! The living area flows into the kitchen, which features plenty of cabinet space. Step outside to discover a large, fully fenced backyard, perfect for outdoor entertaining, gardening, or simply relaxing under the Texas sky. The ample space is ideal for summer barbecues. Located in a quiet, friendly neighborhood, this home is conveniently close to schools, parks, shopping, and dining. Close to Hypermarkets, and Mesquite Rodeo development. Quick and Easy access to 635 and just 17 minutes away from downtown Dallas. The tax record shows 2 bedrooms However the garage was converted into a 3rd bedroom with an AC unit installed. A slab of concrete is in the backyard perfect for a shed to sit on.
-
2026-01-31$164,500 Active
-
2026-01-28historical
-
2026-01-05status Active
-
2026-01-01historical Active Option Contract
-
2025-10-09price $164,500
-
2025-08-28price $169,500
-
2025-08-13price $174,500
-
2025-07-29$184,500 Active
-
2017-04-19soldstatus
ⓘ Source: listings_history table (triggers on properties + properties_extension) + one-shot
backfill from property_details.listing_events for pre-trigger history.
Tax reassessment forecast TX · Resets to sale price
- Current annual tax
- $3,472 · $289/mo
- Projected year-2 tax
- $3,472 · $289/mo
- Expected delta
- $0/yr ($0/mo · 0.0%)
ⓘ Screening estimate from a state-policy table — verify with the county assessor before closing.
Climate risk First Street
- Flood 1/10 Low FEMA zone X (unshaded) · 0% chance over 30 yrs
- Wildfire 1/10 Low
- Heat 7/10 Severe 7 d/yr ≥111°F today · 24 d/yr by 30 yrs out
- Wind 6/10 Major 27% chance of damaging wind over 30 yrs
- Air quality 2/10 Low 1 unhealthy d/yr today · 2 by 30 yrs out
Nearby sold comps map
Loading sold comps map…
Walkable amenities ~0.75 mi
Loading nearby amenities…
Taxation est. · year 1
- Rental income
- $20,999
- − Mortgage interest
- −$9,215
- − Property taxes
- −$3,472
- − Insurance
- −$822
- − Repairs & maintenance
- −$1,680
- − Management
- −$1,680
- − Depreciation
- −$4,785
- Taxable loss
- −$655
- Est. tax savings @ 24.0%
- +$157
- After-tax cash flow
- $2,101/yr
For passive investors: Depreciation is non-cash, so a rental often shows a tax loss while cash-flowing — sheltering income. Rental losses are passive: they offset passive income freely, and up to $25,000/yr can offset ordinary (W-2) income if you actively participate and your MAGI is under $100k (phasing out to $0 by $150k); unused losses carry forward. On sale, claimed depreciation is recaptured at up to 25%, and gains may owe capital-gains tax (a 1031 exchange can defer both). Figures are a year-1 estimate at your 24.0% rate — not tax advice; consult a CPA.
Schools (NCES district)
- District
- Mesquite ISD
- NCES district ID
- 4830390
- Math proficiency
- 35% ▼ -11.00%
- Reading proficiency
- 32% ▼ -7.00%
- Median HH income
- $49,372
- Composite
- 29.06/100
- National rank
- #6606
- State rank
- #536 of 826 in TX
Livability — Mesquite
- Score
- 70/100
- State rank
- #358
- US rank
- #7743
Category grades
Schools grade is shown separately in the Schools card above.
Census & demographics
- Census place
- Mesquite, TX
- County
- Dallas County · 2,612,404 people
- City population
- 150,788
- Metro
- Dallas-Fort Worth-Arlington, TX
- Population (ZIP)
- 58,262
- Household income
- $70,774
- Rent vs Own
- Severe rent burden
- 2266.0
Population outlook (Dallas County) Hauer SSP2
- Today (2025)
- 2,979,839 people
- By 2030
- 3,191,823 · +7.1%
- By 2040
- 3,619,611 · +21.5%
- By 2050
- 4,026,915 · +35.1%
- By 2075
- 4,957,073 · +66.4%
- By 2100
- 5,508,725 · +84.9%
Race, ethnicity, and origin ACS 2023
- Neighborhood character
- Diverse neighborhood (Simpson 0.65)
- Race & ethnicity
- Hispanic / Latino 49% White 25% Two or more races 21% Black 20% Asian 2% Native American 1%
- Hispanic origin (detail)
- Mexican 42% Cuban 1%
- Common ancestry
- Italian 1% Iranian 1% Serbian 1%
- Foreign-born
- 22% · Canada, Vietnam
- Languages at home
- 58% English-only · Spanish 39% Other Asian/Pacific 1% Vietnamese 1%
Political lean MEDSL · Dallas
- 2024 margin
- Strong D (+22.2) · D 60.2% · R 38.0% · Other 1.8%
- 2008→2024 swing
- +6.9pp toward D · 2008: 15.3pp · 2024: 22.2pp
- All cycles
- 2024: D+22.2 2020: D+31.6 2016: D+26.2 2012: D+15.4 2008: D+15.3
Not yet ingested
- Civics
- —
Market trends
- HPI YoY
- ▼ -130.12%
- Current HPI
- 345.6606
- Rent YoY
- ▲ 0.22%
- Metro
- Dallas-Fort Worth-Arlington, TX
- State GDP YoY
- ▲ 3.95%
- F500 in state
- 110
Industry mix (Fortune 500 HQ in TX)
| Industry | F500 HQs | Revenue |
|---|---|---|
| Energy | 16 | $1,198B |
|
||
| Technology | 5 | $198B |
|
||
| Engineering / Construction | 4 | $72B |
|
||
| Energy Services | 3 | $60B |
|
||
| Utilities | 3 | $41B |
|
||
| Healthcare | 2 | $330B |
|
||
Price history
-10.8% since first listed11 events — show timeline
- 2026-02-10 Listing Removed — NTREIS
- 2026-02-10 Listed $164,500 NTREIS
- 2026-01-31 Listed $164,500 NTREIS
- 2026-01-28 Listing Removed — NTREIS
- 2026-01-05 Relisted — NTREIS
- 2026-01-01 Contingent — NTREIS
- 2025-10-09 Price Changed $164,500 NTREIS
- 2025-08-28 Price Changed $169,500 NTREIS
- 2025-08-13 Price Changed $174,500 NTREIS
- 2025-07-29 Listed $184,500 NTREIS
- 2017-04-19 Sold (Public Records) — Public Records
Property tax history
+6.3%/yrLatest (2025): $3,472 · +1.1% YoY. Source: county tax records.
Cash-flow waterfall
monthlySold comps — $/sqft
last 12 mo · ≤1 miLoading sold comps…