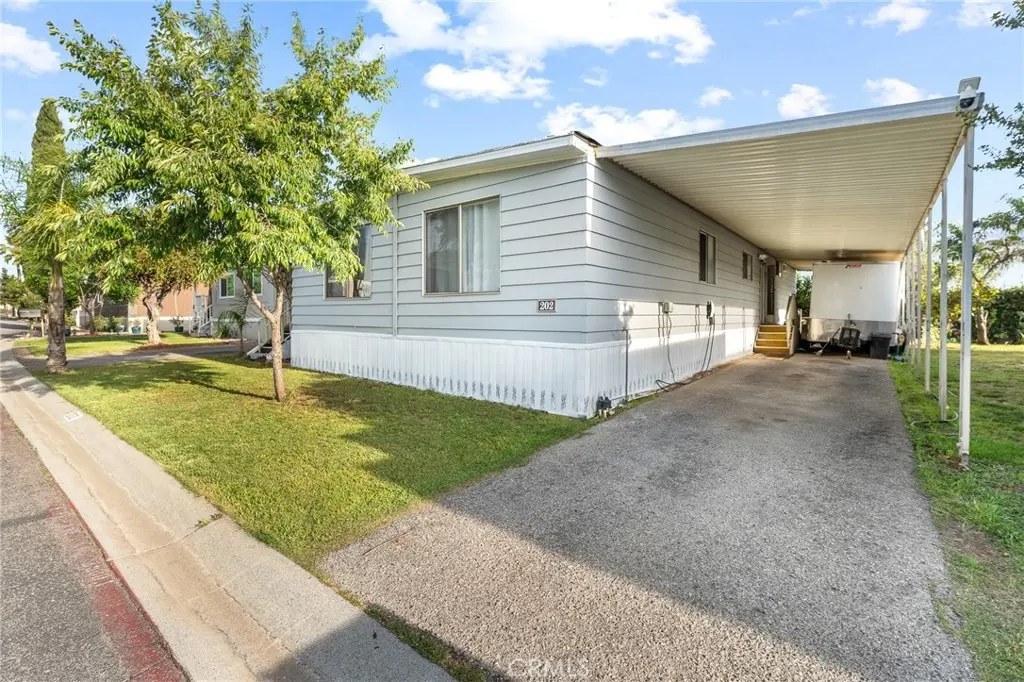
1425 Cherry Ave #202 · Beaumont, CA
Flood risk 1/10 · Minimal
- FEMA flood zone
- X (unshaded)
- Chance of flooding over 30 yrs
- 0.0%
- Est. flood insurance / yr
- $507 – $1,088
Fire risk 10/10 · Severe
- Est. fire insurance / yr
- $659 – $1,223
Heat risk 6/10 · Moderate
- Hot days now (above 100°F)
- 6 days/yr
- Hot days in 30 yrs
- 17 days/yr
Wind risk 1/10 · Minimal
- Chance of severe wind over 30 yrs
- —
Air-quality risk 7/10 · Major
- Unhealthy air days now
- 14 days/yr
- Unhealthy air days in 30 yrs
- 18 days/yr
Risk factors via First Street. Map © Google.
Why this score? — see what drove the B+ grade
The composite is a weighted blend of 9 inputs, each scored 0–100. Each bar is that input's sub-score; the figure is the points it added to the 100-point composite (weight × sub-score).
- Cash flow +30.0/30.0
- ARV discount +15.0/15.0
- 1% rule +10.0/10.0
- DSCR +10.0/10.0
- Schools +4.0/10.0
- Condition / age +4.0/5.0
- Rent growth +3.5/5.0
- Livability +3.2/5.0
- Appreciation +0.0/10.0
$149,999
🖨 Deal sheet (PDF) 📄 Offer letter ✓ Due diligence
Listing remarks
Welcome to this beautifully maintained 3 bedroom, 2 bath mobile home located in a highly desirable area of Beaumont. This inviting home offers a functional and comfortable layout, perfect for families or anyone looking for extra space. One of the standout features is the added bonus room, which can easily serve as a 4th bedroom, private studio, home office, or cozy den, giving you the flexibility to fit your lifestyle needs. The home has been well cared for, showing pride of ownership throughout. Enjoy a peaceful setting while still being conveniently close to local shopping, dining, and easy freeway access. Whether you’re a first-time buyer, downsizing, or investing, this home is a f
Key facts
- Cozy den
- Easy freeway access
- Private studio
Tags
Property features AI
Finance
- Other: Lot characteristics: 0-1 unit per acre; Living area source: public records; Park name: Highlands Mobile Home Park; Parcel number provided
- HOA & community: Land lease at approximately $1,005 per month
Exterior
- Parking: Located in Highlands Mobile Home Park
- Utilities: Public sewer; District/Public water
- Home design: Single-story mobile home; Mobile home remains on site
- Construction: Mobile home with dimensions approximately 72 by 12 feet; Year built as reported by seller
- Exterior features: Community pool; Street lighting in the neighborhood
Interior
- Bathrooms: 2 full bathrooms
- Interior features: Single-level home; Main door entry
- Laundry & utility: Laundry in an individual room
Neighborhood map
What this means for you Summary
Snapshot
- This is a 3-bed/2.0-bath manufactured listed at $150k. Condition is rated good.
Deal economics
- At list price, monthly cash flow is $836 ($10k/yr) — positive.
- The deal already cash-flows at list — no discount required.
- Meets the 1% rule at list price ($2k rent vs $150k).
- Recommended offer: $145k (3.0% below list) — sets the bar for market timing.
- Cap rate 13.0% vs local median 3.5% in Beaumont — top-decile yield for the area; either an underpriced asset or a hidden risk that comps aren't pricing in. Stress-test before assuming the spread holds.
Location & tenants
- Location reads 64/100 on livability (#429 in CA) — a middle-class / working-renter tenant base. Strengths: employment A+, housing A+, crime A-; Watch: amenities F, commute F, cost of living F.
- Beaumont Unified (suburban): math 32% / reading 60% proficiency, ranked #168 of 517 in CA (top 32%) — families likely to look elsewhere, expect single-tenant / working-renter base with shorter leases.
- Zoned schools: Anna Hause Elementary (651 students, 68% FRL); San Gorgonio Middle (1,215 students, 67% FRL); Beaumont Senior High (math 36% / reading 63%, grade D, #352 of 1,170 statewide, top 31%, 3,328 students, 62% FRL) — zoned schools average 66% FRL vs 45% district-wide (20 pts higher); higher-poverty schools than district average — tighter screening recommended.
- Market conditions: Rents rising (+3.9%/yr); 288 active listings in the ZIP; 17 comparable units currently listed for rent nearby; rentals at typical pace (median 21d on market — plan ~3-4 weeks tenant-placement turnaround); solid renter incomes; 9,195 units permitted in Riverside County in 2024 (1,512 in 5+ unit buildings).
Forward outlook
- Local home prices are declining (-3.0%/yr); year-one equity from $1k of loan paydown is wiped out by about $4k of value loss. Plan a longer hold.
- Riverside County population projected at +22% by 2050 — long-run rental-demand tailwind backs the buy-and-hold thesis.
- At projected returns (-3.0% appreciation + 3.9% rent growth), your $42k cash investment doubles in ~5 years — after that, you're playing with house money.
Negotiation context
- It's been on market 59 days — a 3% lower offer ($145k) is reasonable based on typical stale-listing flexibility.
Risks & watch-outs
- Climate carrying-cost: severe wildfire risk; extreme-heat days projected 6→17/yr by 2055 (HVAC capex compounding) — expect insurance premiums to compound above CPI over the hold.
Questions for the listing agent
- It's been on market 59 days. Have you received any prior offers? Is the seller open to a 3% concession, seller financing, or rate buy-down credit?
- Built in 1973 — when were the roof, HVAC, electrical panel, plumbing, and water heater last replaced?
- Is there a deadline driving the sale (1031 exchange, divorce, estate, relocation)? That informs how much negotiation room exists.
- What's the average days-on-market for RENTAL listings here right now (not sales)? A rising rental-DOM trend means longer vacancies and softer asking-rent achievability than the comps imply.
- What's the recent tenant-quality profile in this submarket — average credit score on applications, eviction rate, late-payment / NSF rate, and stable-employment percentage? A property-management company in the area should have these aggregated.
- How much new for-sale + rental construction is in the pipeline within 1–3 miles? Heavy new supply typically softens prices + rents 12–24 months out; constrained supply supports both.
Investment metrics
- 1% rule
- 1.58% ✓
- Cap rate
- 12.98%
- Cash-on-cash
- 23.88%
- DSCR
- 2.06
- GRM
- 5.3
CMA / ARV
- ARV (median comp)
- $288,823
- List price
- $149,999
- Delta
- -48.07%
- Verdict
- UNDERPRICED
- Comps
- 5 within 2.0 mi
Show comp detail 3 sales within ~0.75 mi
| Address | Dist | Beds/Ba | Sqft | Sold | Price | $/sf | Match |
|---|---|---|---|---|---|---|---|
| 1425 Cherry Ave #121 | 0.00mi | 4/3.0 (+1) | 1,664 (-4%) | 20mo | $165,900 | $100 | 69 |
| 1444 Michigan Ave #150 | 0.12mi | 4/2.0 (+1) | 1,620 (-6%) | 14mo | $195,000 | $120 | 67 |
| 1444 Michigan Ave #34 | 0.12mi | 3/2.0 | 1,620 (-6%) | 24mo | $130,000 | $80 | 64 |
Match score weights: distance 35% · size 25% · config 20% · recency 20%. Top-matched comps best support the ARV.
Projected returns pro-forma
-3.0% appreciation · 3.85% rent growth · sell at horizon
- IRR
- 18.0%
- Equity multiple
- 1.74×
- Total profit
- $31,000
- Equity at exit
- $22,365
- IRR
- 27.1%
- Equity multiple
- 3.48×
- Total profit
- $104,211
- Equity at exit
- $12,969
Cash invested: $42,000 (down + closing). Projections, not guarantees.
Landlord ↔ Tenant lean methodology
- Overall (STATE)
- 18 Strongly Tenant-Friendly
- State California
- 18 Strongly Tenant-Friendly · D+13
- County
- — inherits STATE
- City
- — inherits STATE
ZIP-level market 92223
- Rents YoY
- 3.9%
- Active inventory
- 288
- Price-to-rent
- 5.3×
Monthly cashflow live
- Estimated rent
- $2,370 high interval (Pro) →
- Mortgage (P&I)
- −$787
- Tax est. 1.5%
- −$187 /mo · $2,250/yr
- Insurance
- −$62
- HOA
- −$0
- Lot rent leased land?
- −$0
- Vacancy / Maint / Mgmt
- −$498
- Net cashflow
- $836
Break-even live
Sensitivity live
| Price | -10% $939 | -5% $888 | +0% $836 | +5% $784 | +10% $732 |
|---|---|---|---|---|---|
| Rent | -10% $648 | -5% $742 | +0% $836 | +5% $929 | +10% $1,023 |
| Rate | -1.0pp $911 | -0.5pp $874 | base $836 | +0.5pp $797 | +1.0pp $757 |
UW: 25.0% down · 7.5% · 30yr · 1.5% tax · 5.0% vac · 8.0% maint · 8.0% mgmt
Financing live
Cash to close
- Down payment
- $37,500
- Closing costs
- $4,500
- Reserves months
- —
- Total cash needed
- —
Loan-product check · same deal, 3 products live
Conventional
25% down · 7.5% · 30yr
- Down + closing
- —
- Monthly P&I
- —
- Monthly cashflow
- —
- DSCR
- —
- Eligible?
- —
Personal DTI + credit; lowest rate.
DSCR
20% down · 8.5% · 30yr
- Down + closing
- —
- Monthly P&I
- —
- Monthly cashflow
- —
- DSCR
- —
- Eligible?
- —
No personal income docs; deal must DSCR.
Hard money
10% down · 12.0% · 12mo
- Down + closing
- —
- Monthly P&I
- —
- Monthly cashflow
- —
- DSCR
- —
- Eligible?
- —
Short-term bridge; refi at stabilization.
Rent comps 17 comps
| Address | Beds | Baths | Sqft | Rent | $/sqft | DOM | Units | Dist |
|---|---|---|---|---|---|---|---|---|
| 1431 Bittersweet Dr Unit A Beaumont, CA | 3.0 | 2.5 | 1377 | $2,749 | $2.00 | 24d | 1 | 0.37mi |
| 1341 Bittersweet Dr Unit F Beaumont, CA | 3.0 | 2.5 | 1377 | $2,650 | $1.92 | 46d | 1 | 0.38mi |
| 525 Cedar View Dr Beaumont, CA | 4.0 | 2.0 | 1484 | $3,000 | $2.02 | 20d | 1 | 0.40mi |
| 1335 Comfrey Leaf Dr Beaumont, CA | 3.0 | 2.5 | 1720 | $2,835 | $1.65 | 26d | 1 | 0.42mi |
| 1335 Comfrey Leaf Dr Beaumont, CA | 3.0 | 2.5 | 1720 | $2,835 | $1.65 | 7d | 1 | 0.42mi |
| 1420 Allium Ct Beaumont, CA | 4.0 | 3.0 | 1725 | $2,900 | $1.68 | 17d | 1 | 0.46mi |
| 1420 Chinaberry Ln Beaumont, CA | 4.0 | 3.0 | 1762 | $3,200 | $1.82 | 46d | 1 | 0.65mi |
| 1161 Pennsylvania Ave Beaumont, CA | 4.0 | 2.0 | 1426 | $3,400 | $2.38 | 46d | 1 | 0.69mi |
| 201 W Dale St Unit 201 Beaumont, CA | 2.0 | 1.0 | 1200 | $2,300 | $1.92 | 0d | 1 | 0.97mi |
| 1061 Beaumont Ave Unit A Beaumont, CA | 3.0 | 2.0 | 1350 | $2,499 | $1.85 | 0d | 1 | 0.99mi |
| 726 Chestnut Ave Unit C Beaumont, CA | 3.0 | 2.5 | 1400 | $2,800 | $2.00 | 1d | 1 | 1.21mi |
| 39670 Grand Ave Cherry Valley, CA | 3.0 | 2.0 | 1578 | $2,595 | $1.64 | 0d | 1 | 1.26mi |
| 1193 Woodburn Cir Beaumont, CA | 3.0 | 2.0 | 1508 | $3,300 | $2.19 | 46d | 1 | 1.32mi |
| 39559 Cherry Valley Blvd Cherry Valley, CA | 3.0 | 2.0 | 1860 | $2,900 | $1.56 | 46d | 1 | 1.35mi |
| 1695 Larkspur Ln Beaumont, CA | 4.0 | 3.0 | 1959 | $3,300 | $1.68 | 7d | 1 | 1.36mi |
| 1493 Evergreen Ave Beaumont, CA | 3.0 | 1.0 | 1206 | $2,695 | $2.23 | 20d | 1 | 1.41mi |
| 1626 Apollo Way Beaumont, CA | 3.0 | 2.5 | 2141 | $2,900 | $1.35 | 6d | 1 | 1.42mi |
Listing history 17 events
-
2026-06-22days on market $149,999 Active 59 DOM
-
2026-06-21days on market $149,999 Active 58 DOM
-
2026-06-18days on market $149,999 Active 55 DOM
-
2026-06-17days on market $149,999 Active 54 DOM
-
2026-06-16days on market $149,999 Active 53 DOM
-
2026-06-15days on market $149,999 Active 52 DOM
-
2026-06-13days on market $149,999 Active 50 DOM
-
2026-06-13days on market $149,999 Active 49 DOM
-
2026-06-09days on market $149,999 Active 46 DOM
-
2026-06-08days on market $149,999 Active 45 DOM
-
2026-06-07days on market $149,999 Active 44 DOM
-
2026-06-04days on market $149,999 Active 41 DOM
-
2026-06-03days on market $149,999 Active 40 DOM
-
2026-06-02pricedays on market $149,999 Active 39 DOM
-
2026-06-01days on market $154,999 Active 38 DOM
-
2026-05-31days on market $154,999 Active 37 DOM
-
2026-04-24$154,999 Active 749-char remark
ⓘ Source: listings_history table (triggers on properties + properties_extension) + one-shot
backfill from property_details.listing_events for pre-trigger history.
Climate risk First Street
- Flood 1/10 Low FEMA zone X (unshaded) · 0% chance over 30 yrs
- Wildfire 10/10 Extreme
- Heat 6/10 Major 6 d/yr ≥100°F today · 17 d/yr by 30 yrs out
- Wind 1/10 Low
- Air quality 7/10 Severe 14 unhealthy d/yr today · 18 by 30 yrs out
Nearby sold comps map
Loading sold comps map…
Walkable amenities ~0.75 mi
Loading nearby amenities…
Taxation est. · year 1
- Rental income
- $28,440
- − Mortgage interest
- −$8,402
- − Property taxes
- −$2,250
- − Insurance
- −$750
- − Repairs & maintenance
- −$2,275
- − Management
- −$2,275
- − Depreciation
- −$4,364
- Taxable income
- $8,124
- Est. tax owed @ 24.0%
- −$1,950
- After-tax cash flow
- $8,079/yr
For passive investors: Depreciation is non-cash, so a rental often shows a tax loss while cash-flowing — sheltering income. Rental losses are passive: they offset passive income freely, and up to $25,000/yr can offset ordinary (W-2) income if you actively participate and your MAGI is under $100k (phasing out to $0 by $150k); unused losses carry forward. On sale, claimed depreciation is recaptured at up to 25%, and gains may owe capital-gains tax (a 1031 exchange can defer both). Figures are a year-1 estimate at your 24.0% rate — not tax advice; consult a CPA.
Condition & rehab AI · 6 photos
This well-maintained 3-bedroom, 2-bath mobile home in Beaumont is move-in ready with a good condition score and minimal repairs needed.
Value-add opportunities
- Both paint exterior — enhances curb appeal and value
- Both landscaping — improves curb appeal and enhances property value
- Resale replace countertops — modernizes kitchen and adds value
Renovation cost estimate screening
Value-add ROI direction
- Both paint exterior — enhances curb appeal and value ↑
- Both landscaping — improves curb appeal and enhances property value ↑
- Resale replace countertops — modernizes kitchen and adds value ↑
ⓘ Cost ranges are severity-bucket heuristics (US national rule-of-thumb). Get contractor quotes + a written scope before underwriting a rehab budget.
Schools (NCES district)
- District
- Beaumont Unified
- NCES district ID
- 0604290
- Math proficiency
- 32% ▼ -4.00%
- Reading proficiency
- 60% ▲ 11.00%
- Median HH income
- $60,635
- Composite
- 40.37/100
- National rank
- #3736
- State rank
- #168 of 517 in CA
Livability — Beaumont
- Score
- 64/100
- State rank
- #429
- US rank
- #14526
Category grades
Schools grade is shown separately in the Schools card above.
Census & demographics
- Census place
- Beaumont, CA
- County
- Riverside County · 2,287,001 people
- City population
- 63,833
- Metro
- Riverside-San Bernardino-Ontario, CA
- Population (ZIP)
- 63,833
- Household income
- $102,761
- Rent vs Own
- Severe rent burden
- 1096.0
Population outlook (Riverside County) Hauer SSP2
- Today (2025)
- 2,664,475 people
- By 2030
- 2,802,692 · +5.2%
- By 2040
- 3,050,904 · +14.5%
- By 2050
- 3,256,783 · +22.2%
- By 2075
- 3,655,058 · +37.2%
- By 2100
- 3,766,594 · +41.4%
Race, ethnicity, and origin ACS 2023
- Neighborhood character
- Diverse neighborhood (Simpson 0.65)
- Race & ethnicity
- Hispanic / Latino 45% White 37% Two or more races 16% Black 8% Asian 7% Native American 1%
- Hispanic origin (detail)
- Mexican 40%
- Common ancestry
- Lithuanian 1% Romanian 1% Italian 1%
- Foreign-born
- 15% · Canada, China
- Languages at home
- 70% English-only · Spanish 23% Tagalog/Filipino 2% Chinese 1%
Political lean MEDSL · Riverside
- 2024 margin
- Toss-up / Even · D 48.0% · R 49.3% · Other 2.6%
- 2008→2024 swing
- -3.6pp toward R · 2008: 2.3pp · 2024: -1.3pp
- All cycles
- 2024: R+1.3 2020: D+8.0 2016: D+4.3 2012: R+0.4 2008: D+2.3
Not yet ingested
- Civics
- —
Market trends
- HPI YoY
- ▼ -395.13%
- Current HPI
- 373.4608
- Rent YoY
- ▲ 3.85%
- Metro
- Riverside-San Bernardino-Ontario, CA
- State GDP YoY
- ▲ 3.21%
- F500 in state
- 116
Industry mix (Fortune 500 HQ in CA)
| Industry | F500 HQs | Revenue |
|---|---|---|
| Technology | 27 | $1,492B |
|
||
| Financial Services | 3 | $174B |
|
||
| Retail | 3 | $44B |
|
||
| Insurance | 3 | $26B |
|
||
| Media / Entertainment | 2 | $115B |
|
||
| Pharmaceuticals / Biotech | 2 | $62B |
|
||
Price history
-3.2% since first listed2 events — show timeline
- 2026-06-02 Price Changed $149,999 CRMLS
- 2026-04-24 Listed $154,999 CRMLS
Cash-flow waterfall
monthlySold comps — $/sqft
last 12 mo · ≤1 miLoading sold comps…