 🌊 Lakefront
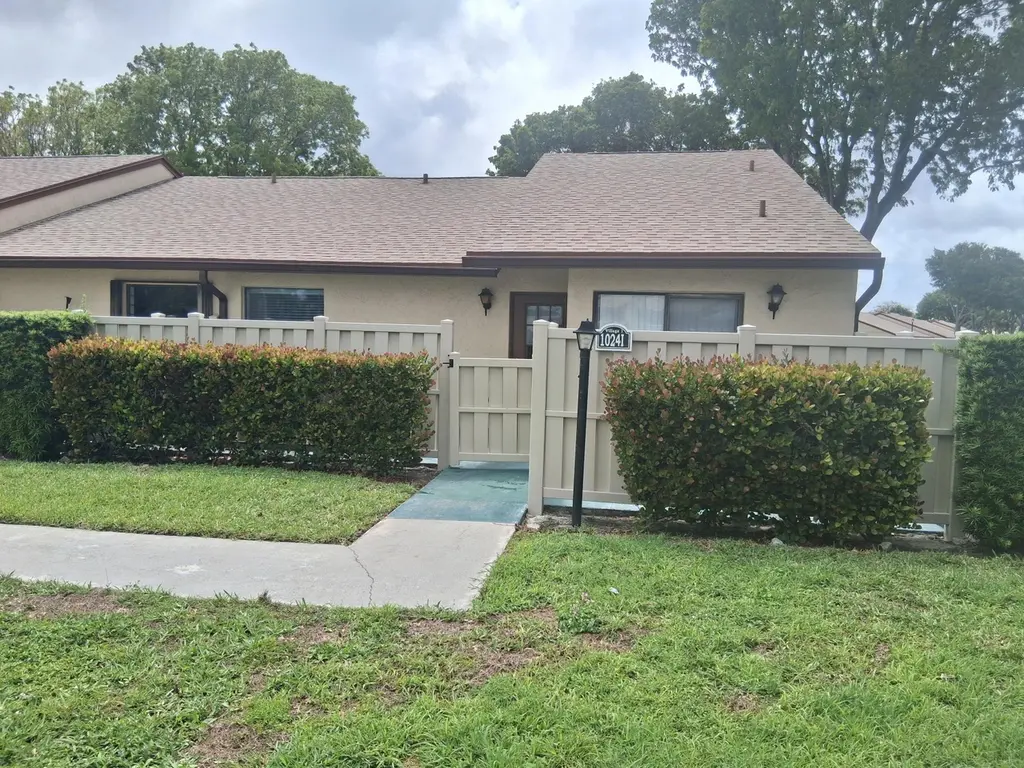
1024 Green Pine Blvd Unit I · West Palm Beach, FL
Flood risk 1/10 · Minimal
- FEMA flood zone
- X (unshaded)
- Chance of flooding over 30 yrs
- 0.0%
- Est. flood insurance / yr
- $507 – $1,088
Fire risk 1/10 · Minimal
- Est. fire insurance / yr
- $947 – $1,759
Heat risk 10/10 · Severe
- Hot days now (above 105°F)
- 7 days/yr
- Hot days in 30 yrs
- 25 days/yr
Wind risk 10/10 · Severe
- Chance of severe wind over 30 yrs
- 99.0%
Air-quality risk 2/10 · Minimal
- Unhealthy air days now
- 1 days/yr
- Unhealthy air days in 30 yrs
- 1 days/yr
Risk factors via First Street. Map © Google.
Why this score? — see what drove the C- grade
The composite is a weighted blend of 9 inputs, each scored 0–100. Each bar is that input's sub-score; the figure is the points it added to the 100-point composite (weight × sub-score).
- Cash flow +15.6/30.0
- 1% rule +9.5/10.0
- ARV discount +7.5/15.0
- DSCR +4.8/10.0
- Schools +4.3/10.0
- Livability +4.1/5.0
- Rent growth +2.5/5.0
- Condition / age +2.5/5.0
- Appreciation +0.0/10.0
$215,500
🖨 Deal sheet 📄 Offer letter ✓ Due diligence
Listing remarks
THE HEIR TO THE PROPERTY WANTS IT SOLD! PRICED TO SELL DUE TO THE ORIGINAL CONDITION OF THE PROPERTY. ALL OFFERS TO BE CONSIDERED. Desired end unit with unobstructed lake views. Palm Club Village offers a resort style lifestyle in the heart of West Palm Beach. The community offers a 24 hour guard gate, community pool, clubhouse and tennis courts. Two bedroom, two bathroom with rear screen porch, front patio and private PVC fence. Since the unit is in original condition it is offered at an aggressive price. Sale conditional on Probate court approval.
Key facts
- Clubhouse
- 24 hour guard gate
- Community pool
Tags
Property features AI
Finance
- Financial info: Pets allowed with breed and size restrictions
- HOA & community: Monthly HOA fee of $789; HOA includes cable TV, insurance, grounds maintenance, security, sewer, trash, common areas and recreation facilities; Community amenities: clubhouse, pool, tennis courts, community room, maintained grounds, sidewalks, gated entry, recreation facilities, manager on site
Exterior
- Parking: 2 parking spaces; Parking available in community
- Security: Security gate; Gated community; On-site manager; Security as an association amenity
- Utilities: Public water; Private sewer; Cable available; Electricity available
- Home design: Condominium; One story; Resale property; Faces west; Manned guard gate at main entrance
- Construction: Concrete/Stucco/CBS construction; Shingle roof; Built as a single-story building
- Exterior features: Open patio; Screened porch; Patio; Porch; Vinyl fencing; Waterfront (no specific waterfront features listed); Private maintained road
Interior
- Kitchen: Electric range; Dishwasher; Microwave; Refrigerator; Garbage disposal; Electric water heater
- Bedrooms: 2 bedrooms on the main level
- Flooring: Carpet; Vinyl
- Bathrooms: 2 full bathrooms
- Heating & cooling: Central heating; Central air conditioning; Ceiling fans
- Interior features: High ceilings; Vaulted ceilings; Walk-in closets
- Laundry & utility: Laundry inside
Neighborhood map
What this means for you Summary
Snapshot
- This is a 2-bed/2.0-bath condo listed at $216k.
Deal economics
- At list price, monthly cash flow is $91 ($1k/yr) — positive.
- The deal already cash-flows at list — no discount required.
- Meets the 1% rule at list price ($3k rent vs $216k).
- Recommended offer: $203k (6.0% below list) — sets the bar for market timing.
- Cap rate 6.8% vs local median 3.8% in West Palm Beach — top-decile yield for the area; either an underpriced asset or a hidden risk that comps aren't pricing in. Stress-test before assuming the spread holds.
Location & tenants
- Location reads 82/100 on livability (#75 in FL, #1,255 nationally) — a professional / high-income tenant draw. Strengths: commute A+, housing A+, health & safety A+; Watch: employment C-, crime F.
- Palm Beach (suburban): math 46% / reading 53% proficiency, ranked #34 of 73 in FL (top 47%) — families likely to look elsewhere, expect single-tenant / working-renter base with shorter leases.
- Zoned schools: Seminole Trails Elementary School (math 26% / reading 36%, grade F, #1,854 of 2,144 statewide, top 87%, 650 students, 73% FRL); Bear Lakes Middle School (math 19% / reading 33%, grade F, #506 of 571 statewide, top 89%, 842 students, 74% FRL); Palm Beach Lakes High School (math 17% / reading 26%, grade F, #546 of 667 statewide, top 82%, 2,688 students, 70% FRL) — zoned schools average 72% FRL vs 52% district-wide (20 pts higher); higher-poverty schools than district average — tighter screening recommended.
- Zoned-school proficiency averages 26% at this address vs 50% district-wide (-23 pts) — the specific schools serving this property underperform the Palm Beach average; the district grade overstates school quality for this exact location.
- Market conditions: Rents soft (-0.1%/yr); 189 active listings in the ZIP; 18 comparable units currently listed for rent nearby; rentals at typical pace (median 25d on market — plan ~3-4 weeks tenant-placement turnaround); 3,974 units permitted in Palm Beach County in 2024 (1,012 in 5+ unit buildings).
- At $3,133/mo this rent would consume 56% of the median local household income ($67k/yr) (locally 1333% of renters already pay >50% of income on rent) — very limited rent-growth headroom before tenants either downsize or default.
Forward outlook
- Local home prices are declining (-3.0%/yr); year-one equity from $1k of loan paydown is wiped out by about $6k of value loss. Plan a longer hold.
- Palm Beach County population projected at +30% by 2050 — long-run rental-demand tailwind backs the buy-and-hold thesis.
Negotiation context
- It's been on market 65 days — a 6% lower offer ($203k) is reasonable based on typical stale-listing flexibility.
Risks & watch-outs
- Watch-outs: HOA is 25% of rent.
- Climate carrying-cost: severe wind risk, 99% chance of damaging wind over 30y; extreme-heat days projected 7→25/yr by 2055 (HVAC capex compounding) — expect insurance premiums to compound above CPI over the hold.
Questions for the listing agent
- It's been on market 65 days. Have you received any prior offers? Is the seller open to a 6% concession, seller financing, or rate buy-down credit?
- What does the HOA fee cover, when was the last increase, and are there any pending special assessments or reserve-fund shortfalls?
- Any open or pending special assessments — roof, HVAC, plumbing, elevator, façade? What's the per-unit balance and payoff schedule, and is the seller paying it off at close or rolling it to the buyer?
- Why hasn't it sold? Are there any deal-killer items the seller is aware of (foundation, flood, title, zoning, code violations)?
- Is there a deadline driving the sale (1031 exchange, divorce, estate, relocation)? That informs how much negotiation room exists.
- Crime grade is F in this area — have there been break-ins, vandalism, or insurance claims at this property in the last 3 years? What carrier currently insures it and at what premium?
- This sits on a lake — are riparian / water-frontage rights deeded with the parcel? Any dock permits, shoreline easements, or HOA water-use restrictions?
- What's the documented flood / surge / shoreline-erosion history here (FEMA AND non-FEMA — e.g., storm surge, creek backup, septic-field saturation)?
- Any water-quality or seasonal algae-bloom issues that affect tenant satisfaction or short-term-rental demand?
- What's the average days-on-market for RENTAL listings here right now (not sales)? A rising rental-DOM trend means longer vacancies and softer asking-rent achievability than the comps imply.
- What's the recent tenant-quality profile in this submarket — average credit score on applications, eviction rate, late-payment / NSF rate, and stable-employment percentage? A property-management company in the area should have these aggregated.
- How much new apartment / multifamily construction is in the pipeline within 1–3 miles? Heavy new supply (>2% of stock underway) typically softens rents 12–24 months out; light construction supports rent growth.
Investment metrics
- 1% rule
- 1.45% ✓
- Cap rate
- 6.80%
- Cash-on-cash
- 1.81%
- DSCR
- 1.08
- GRM
- 5.7
CMA / ARV
No comps found within radius.
Projected returns pro-forma
-3.0% appreciation · 0.0% rent growth · sell at horizon
- IRR
- -18.6%
- Equity multiple
- 0.38×
- Total profit
- $-37,691
- Equity at exit
- $32,132
- IRR
- -25.6%
- Equity multiple
- 0.03×
- Total profit
- $-58,390
- Equity at exit
- $18,633
Cash invested: $60,340 (down + closing). Projections, not guarantees.
Landlord ↔ Tenant lean methodology
- Overall (STATE)
- 87 Strongly Landlord-Friendly
- State Florida
- 87 Strongly Landlord-Friendly · R+3
- County
- — inherits STATE
- City
- — inherits STATE
ZIP-level market 33409
- Home prices YoY
- -25.6%
- Rents YoY
- -0.1%
- Active inventory
- 189
- Price-to-rent
- 5.7×
Monthly cashflow live
- Estimated rent
- $3,133 high interval (Pro) →
- Mortgage (P&I)
- −$1,130
- Tax from tax record
- −$375 /mo · $4,495/yr
- Insurance
- −$90
- HOA
- −$789
- Vacancy / Maint / Mgmt
- −$658
- Net cashflow
- $91
Break-even live
UW: 25.0% down · 7.5% · 30yr · 1.5% tax · 5.0% vac · 8.0% maint · 8.0% mgmt
Financing live
Cash to close
- Down payment
- $53,875
- Closing costs
- $6,465
- Reserves months
- —
- Total cash needed
- —
Loan-product check · same deal, 3 products live
Conventional
25% down · 7.5% · 30yr
- Down + closing
- —
- Monthly P&I
- —
- Monthly cashflow
- —
- DSCR
- —
- Eligible?
- —
Personal DTI + credit; lowest rate.
DSCR
20% down · 8.5% · 30yr
- Down + closing
- —
- Monthly P&I
- —
- Monthly cashflow
- —
- DSCR
- —
- Eligible?
- —
No personal income docs; deal must DSCR.
Hard money
10% down · 12.0% · 12mo
- Down + closing
- —
- Monthly P&I
- —
- Monthly cashflow
- —
- DSCR
- —
- Eligible?
- —
Short-term bridge; refi at stabilization.
Rent comps 18 comps
| Address | Beds | Baths | Sqft | Rent | $/sqft | DOM | Units | Dist |
|---|---|---|---|---|---|---|---|---|
| 1211 Pine Sage Cir West Palm Beach, FL | 3.0 | 2.0 | 1367 | $3,200 | $2.34 | 5d | 1 | 0.26mi |
| 1912 Stratford Way West Palm Beach, FL | 2.0 | 2.5 | 1350 | $3,000 | $2.22 | 24d | 1 | 0.54mi |
| 1979 Brandywine Rd Unit 1979-108 West Palm Beach, FL | 3.0 | 2.0 | 1395 | $3,205 | $2.30 | 24d | 1 | 0.78mi |
| 4567 Brook Dr West Palm Beach, FL | 3.0 | 2.0 | 1528 | $3,000 | $1.96 | 24d | 1 | 0.83mi |
| 2820 Tennis Club Dr #408 West Palm Beach, FL | 3.0 | 2.0 | 1610 | $3,800 | $2.36 | 24d | 1 | 0.90mi |
| 4385 Willow Brook Cir West Palm Beach, FL | 3.0 | 2.0 | 1468 | $3,200 | $2.18 | 22d | 1 | 1.00mi |
| 4400 Portofino Way West Palm Beach, FL | 1.0–3.0 | 1.0–2.0 | 1222 | $2,528 | $2.07 | 18d | 60 | 1.04mi |
| 2480 Presidential Way #1903 West Palm Beach, FL | 2.0 | 2.0 | 1855 | $4,650 | $2.51 | 24d | 1 | 1.22mi |
| 2480 Presidential Way #902 West Palm Beach, FL | 2.0 | 2.0 | 1855 | $4,650 | $2.51 | 5d | 1 | 1.22mi |
| 2450 Presidential Way #7 West Palm Beach, FL | 2.0 | 2.0 | 1855 | $4,700 | $2.53 | 24d | 1 | 1.24mi |
| 2450 Presidential Way #7 West Palm Beach, FL | 2.0 | 2.0 | 1855 | $4,700 | $2.53 | 2d | 1 | 1.24mi |
| 2425 Presidential Way West Palm Beach, FL | 2.0 | 2.0 | 1294 | $4,500 | $3.48 | 24d | 1 | 1.26mi |
| 3810 Rowena Cir West Palm Beach, FL | 2.0 | 2.0 | 1505 | $3,150 | $2.09 | 14d | 1 | 1.28mi |
| 3810 Rowena Cir West Palm Beach, FL | 2.0 | 2.0 | 1505 | $3,000 | $1.99 | 8d | 1 | 1.28mi |
| 2400 Presidential Way #1906 West Palm Beach, FL | 1.0 | 2.0 | 1294 | $3,000 | $2.32 | 24d | 1 | 1.33mi |
| 1991 Presidential Way West Palm Beach, FL | 3.0 | 2.0 | 1485 | $4,905 | $3.30 | 16d | 1 | 1.35mi |
| 1714 Consulate Pl #101 West Palm Beach, FL | 3.0 | 3.0 | 1377 | $3,000 | $2.18 | 24d | 1 | 1.35mi |
| 149 Stratford N West Palm Beach, FL | 2.0 | 2.0 | 978 | $1,650 | $1.69 | 24d | 1 | 1.46mi |
HOA detail condo
- Monthly dues
- $789 · $9,468/yr
- Likely covers
- pool
- Assessments
- None detected in remarks — confirm with the listing agent.
Listing history 15 events
-
2026-06-18days on market $215,500 Active 65 DOM
-
2026-06-17days on market $215,500 Active 64 DOM
-
2026-06-16days on market $215,500 Active 63 DOM
-
2026-06-15days on market $215,500 Active 62 DOM
-
2026-06-13days on market $215,500 Active 60 DOM
-
2026-06-09days on market $215,500 Active 56 DOM
-
2026-06-08days on market $215,500 Active 55 DOM
-
2026-06-07days on market $215,500 Active 54 DOM
-
2026-06-04days on market $215,500 Active 51 DOM
-
2026-06-03days on market $215,500 Active 50 DOM
-
2026-06-02days on market $215,500 Active 49 DOM
-
2026-06-01days on market $215,500 Active 48 DOM
-
2026-05-31days on market $215,500 Active 47 DOM
-
2026-05-05price $215,500
-
2026-04-12$229,500 Active
ⓘ Source: listings_history table (triggers on properties + properties_extension) + one-shot
backfill from property_details.listing_events for pre-trigger history.
Tax reassessment forecast FL · Resets to sale price
- Current annual tax
- $4,495 · $375/mo
- Projected year-2 tax
- $4,495 · $375/mo
- Expected delta
- $0/yr ($0/mo · 0.0%)
ⓘ Screening estimate from a state-policy table — verify with the county assessor before closing.
Climate risk First Street
- Flood 1/10 Low FEMA zone X (unshaded) · 0% chance over 30 yrs
- Wildfire 1/10 Low
- Heat 10/10 Extreme 7 d/yr ≥105°F today · 25 d/yr by 30 yrs out
- Wind 10/10 Extreme 99% chance of damaging wind over 30 yrs
- Air quality 2/10 Low 1 unhealthy d/yr today · 1 by 30 yrs out
Nearby sold comps map
Loading sold comps map…
Walkable amenities ~0.75 mi
Loading nearby amenities…
Taxation est. · year 1
- Rental income
- $37,591
- − Mortgage interest
- −$12,071
- − Property taxes
- −$4,495
- − Insurance
- −$1,078
- − Repairs & maintenance
- −$3,007
- − Management
- −$3,007
- − HOA
- −$9,468
- − Depreciation
- −$6,269
- Taxable loss
- −$1,804
- Est. tax savings @ 24.0%
- +$433
- After-tax cash flow
- $1,528/yr
For passive investors: Depreciation is non-cash, so a rental often shows a tax loss while cash-flowing — sheltering income. Rental losses are passive: they offset passive income freely, and up to $25,000/yr can offset ordinary (W-2) income if you actively participate and your MAGI is under $100k (phasing out to $0 by $150k); unused losses carry forward. On sale, claimed depreciation is recaptured at up to 25%, and gains may owe capital-gains tax (a 1031 exchange can defer both). Figures are a year-1 estimate at your 24.0% rate — not tax advice; consult a CPA.
Schools (NCES district)
- District
- Palm Beach
- NCES district ID
- 1201500
- Math proficiency
- 46% ▼ -16.00%
- Reading proficiency
- 53% ▼ -4.00%
- Median HH income
- $53,943
- Composite
- 42.72/100
- National rank
- #3160
- State rank
- #34 of 73 in FL
Livability — West Palm Beach
- Score
- 82/100
- State rank
- #75
- US rank
- #1255
Category grades
Schools grade is shown separately in the Schools card above.
Census & demographics
- Census place
- West Palm Beach, FL
- County
- Palm Beach County · 1,438,312 people
- City population
- 222,012
- Metro
- Miami-Fort Lauderdale-Pompano Beach, FL
- Population (ZIP)
- 33,489
- Household income
- $67,073
- Rent vs Own
- Severe rent burden
- 1333.0
Population outlook (Palm Beach County) Hauer SSP2
- Today (2025)
- 1,637,487 people
- By 2030
- 1,743,255 · +6.5%
- By 2040
- 1,948,712 · +19.0%
- By 2050
- 2,132,979 · +30.3%
- By 2075
- 2,530,027 · +54.5%
- By 2100
- 2,706,979 · +65.3%
Race, ethnicity, and origin ACS 2023
- Neighborhood character
- Highly diverse neighborhood (Simpson 0.70)
- Race & ethnicity
- Hispanic / Latino 36% Black 31% White 27% Two or more races 21% Asian 2%
- Hispanic origin (detail)
- Mexican 4% Puerto Rican 4% Cuban 8% Dominican 1%
- Common ancestry
- Hispanic 8% Romanian 1% Lithuanian 1%
- Foreign-born
- 34% · Canada, Jamaica
- Languages at home
- 55% English-only · Spanish 30% French/Haitian/Cajun 10% Other Indo-European 2%
Political lean MEDSL · Palm Beach
- 2024 margin
- Toss-up / Even · D 50.0% · R 49.2%
- 2008→2024 swing
- -22.1pp toward R · 2008: 22.9pp · 2024: 0.8pp
- All cycles
- 2024: D+0.8 2020: D+12.8 2016: D+15.3 2012: D+17.0 2008: D+22.9
Not yet ingested
- Civics
- —
Market trends
- HPI YoY
- ▼ -128.54%
- Current HPI
- 374.2506
- Rent YoY
- ▼ -0.15%
- Metro
- Miami-Fort Lauderdale-Pompano Beach, FL
- State GDP YoY
- ▲ 3.28%
- F500 in state
- 36
Industry mix (Fortune 500 HQ in FL)
| Industry | F500 HQs | Revenue |
|---|---|---|
| Industrial Technology | 2 | $29B |
|
||
| Insurance | 2 | $17B |
|
||
| Retail | 1 | $60B |
|
||
| Technology Distribution | 1 | $58B |
|
||
| Homebuilding | 1 | $35B |
|
||
| Technology Manufacturing | 1 | $35B |
|
||
Price history
-6.1% since first listed2 events — show timeline
- 2026-05-05 Price Changed $215,500 Beaches MLS
- 2026-04-12 Listed $229,500 Beaches MLS
Property tax history
+6.3%/yrLatest (2025): $4,495 · +4.8% YoY. Source: county tax records.
Cash-flow waterfall
monthlySold comps — $/sqft
last 12 mo · ≤1 miLoading sold comps…