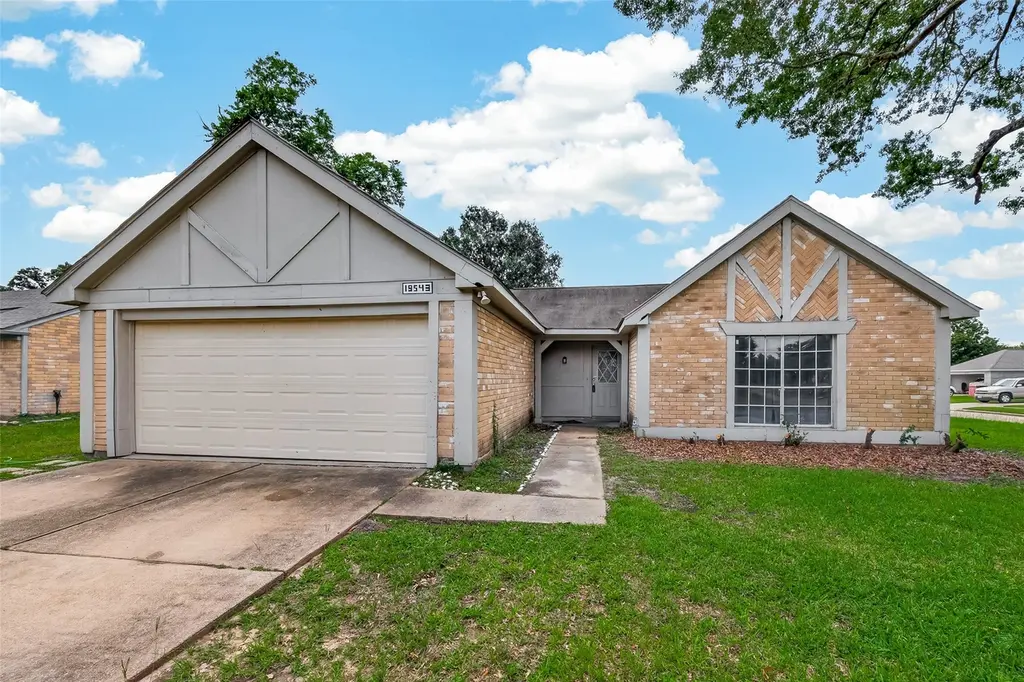
19543 Elmtree Estates Dr · Houston, TX
Flood risk 6/10 · Moderate
- FEMA flood zone
- X (unshaded)
- Chance of flooding over 30 yrs
- 0.74%
- Est. flood insurance / yr
- $507 – $1,088
Fire risk 1/10 · Minimal
- Est. fire insurance / yr
- $1,222 – $2,270
Heat risk 9/10 · Severe
- Hot days now (above 110°F)
- 7 days/yr
- Hot days in 30 yrs
- 23 days/yr
Wind risk 9/10 · Severe
- Chance of severe wind over 30 yrs
- 99.0%
Air-quality risk 2/10 · Minimal
- Unhealthy air days now
- 2 days/yr
- Unhealthy air days in 30 yrs
- 2 days/yr
Risk factors via First Street. Map © Google.
Why this score? — see what drove the C grade
The composite is a weighted blend of 9 inputs, each scored 0–100. Each bar is that input's sub-score; the figure is the points it added to the 100-point composite (weight × sub-score).
- ARV discount +15.0/15.0
- Cash flow +14.8/30.0
- 1% rule +5.7/10.0
- DSCR +4.5/10.0
- Appreciation +4.4/10.0
- Schools +4.4/10.0
- Livability +3.7/5.0
- Condition / age +2.5/5.0
- Rent growth +1.8/5.0
$175,000
🖨 Deal sheet 📄 Offer letter ✓ Due diligence
Listing remarks MLS
Open and Great floorplan on a corner lot! Tile throughout main living areas. Lots of natural light! This home won't last long!
Key facts
- 7,000 sq ft lot
- 2 garage spots
- Built 1983
Property features AI
Finance
- HOA & community: Highland Creek HOA with an annual fee of $500
Exterior
- Parking: Attached 2-car garage
- Utilities: Public water
- Home design: Residential property; Built in 1983; Slab foundation; Composition roof
- Construction: Brick and wood siding construction
- Exterior features: Back yard fence; Subdivision lot
Interior
- Kitchen: Gas range; Oven
- Bedrooms: Three bedrooms total; Primary bedroom on the first floor; Two additional bedrooms on the first floor
- Flooring: Concrete floors
- Bathrooms: Two full bathrooms
- Heating & cooling: Central heating (electric); Central air conditioning (gas)
- Interior features: Ceiling fans; Kitchen/dining combo; One fireplace; Washer hookup
- Laundry & utility: Washer hookup
Neighborhood map
What this means for you Summary
Snapshot
- This is a 3-bed/2.0-bath single-family listed at $175k.
Deal economics
- At list price, monthly cash flow is $50 ($594/yr) — positive.
- The deal already cash-flows at list — no discount required.
- Meets the 1% rule at list price ($2k rent vs $175k).
- Recommended offer: $172k (1.5% below list) — sets the bar for market timing.
- Cap rate 6.6% vs local median 3.2% in Houston — top-decile yield for the area; either an underpriced asset or a hidden risk that comps aren't pricing in. Stress-test before assuming the spread holds.
Location & tenants
- Location reads 74/100 on livability (#184 in TX, #4,771 nationally) — a middle-class / working-renter tenant base. Strengths: amenities A+, cost of living A+, housing A+; Watch: crime F.
- Cypress-Fairbanks ISD (suburban): math 45% / reading 52% proficiency, ranked #161 of 826 in TX (top 20%) — families likely to look elsewhere, expect single-tenant / working-renter base with shorter leases.
- Zoned schools: Hopper Middle (math 24% / reading 34%, grade F, #1,103 of 1,662 statewide, top 67%, 930 students, 80% FRL); Cypress Springs H S (math 35% / reading 60%, grade D, #583 of 1,632 statewide, top 36%, 2,788 students, 68% FRL) — zoned schools average 74% FRL vs 43% district-wide (31 pts higher); higher-poverty schools than district average — tighter screening recommended.
- Market conditions: Rents soft (-2.9%/yr); 744 active listings in the ZIP; 40 comparable units currently listed for rent nearby; rentals at typical pace (median 20d on market — plan ~3-4 weeks tenant-placement turnaround); solid renter incomes; 29,883 units permitted in Harris County in 2024 (8,621 in 5+ unit buildings).
Forward outlook
- Local home prices are declining (-1.3%/yr); year-one equity from $1k of loan paydown is wiped out by about $2k of value loss. Plan a longer hold.
- Harris County population projected at +47% by 2050 — long-run rental-demand tailwind backs the buy-and-hold thesis.
Negotiation context
- It's been on market 23 days — a 2% lower offer ($172k) is reasonable based on typical stale-listing flexibility.
- 6 sale attempts since 14y ago; this cycle's ask has dropped $10k (5%) from the opening price — seller is motivated, your offer sets the floor, not the list.
- Current owner paid $68k; list at $175k implies a 158% gain — meaningful room to come down on a strong offer.
Risks & watch-outs
- Watch-outs: property tax is 2.8% of price.
- Climate carrying-cost: major flood risk; severe wind risk, 99% chance of damaging wind over 30y; extreme-heat days projected 7→23/yr by 2055 (HVAC capex compounding) — expect insurance premiums to compound above CPI over the hold.
Questions for the listing agent
- Property tax is high relative to price — has the assessment been appealed recently, and will the sale trigger a re-assessment?
- What does the HOA fee cover, when was the last increase, and are there any pending special assessments or reserve-fund shortfalls?
- Is there a deadline driving the sale (1031 exchange, divorce, estate, relocation)? That informs how much negotiation room exists.
- Schools are D-rated, which usually means shorter tenancies and higher turnover. Who's the typical renter profile here, and what's been the actual vacancy rate?
- Crime grade is F in this area — have there been break-ins, vandalism, or insurance claims at this property in the last 3 years? What carrier currently insures it and at what premium?
- What's the average days-on-market for RENTAL listings here right now (not sales)? A rising rental-DOM trend means longer vacancies and softer asking-rent achievability than the comps imply.
- What's the recent tenant-quality profile in this submarket — average credit score on applications, eviction rate, late-payment / NSF rate, and stable-employment percentage? A property-management company in the area should have these aggregated.
- How much new for-sale + rental construction is in the pipeline within 1–3 miles? Heavy new supply typically softens prices + rents 12–24 months out; constrained supply supports both.
Investment metrics
- 1% rule
- 1.07% ✓
- Cap rate
- 6.63%
- Cash-on-cash
- 1.21%
- DSCR
- 1.05
- GRM
- 7.8
CMA / ARV
- ARV (on-the-fly)
- $229,500
- Comps found
- 12
Show comp detail 12 sales within ~0.75 mi
| Address | Dist | Beds/Ba | Sqft | Sold | Price | $/sf | Match |
|---|---|---|---|---|---|---|---|
| 19427 Elmtree Estates Dr | 0.17mi | 3/2.0 | 1,326 (-2%) | 1mo | $220,000 | $166 | 88 |
| 6734 Prairie Village Dr | 0.19mi | 3/2.0 | 1,326 (-2%) | 0mo | $225,000 | $170 | 88 |
| 19407 Glenway Falls Dr | 0.20mi | 3/2.0 | 1,326 (-2%) | 2mo | $229,900 | $173 | 86 |
| 6727 Cypress Glades Dr | 0.27mi | 3/2.0 | 1,256 (-7%) | 4mo | $225,000 | $179 | 72 |
| 19927 Mountain Dale Dr | 0.40mi | 3/2.0 | 1,282 (-5%) | 1mo | $199,000 | $155 | 72 |
| 19956 Sutton Falls Dr | 0.53mi | 3/2.0 | 1,326 (-2%) | 3mo | $199,900 | $151 | 70 |
| 7114 Pheasant Grove Dr | 0.40mi | 3/2.0 | 1,230 (-9%) | 3mo | $227,000 | $185 | 64 |
| 19538 Buckland Park Dr | 0.44mi | 3/2.0 | 1,221 (-10%) | 2mo | $228,000 | $187 | 62 |
| 7343 Village Lake Dr | 0.72mi | 3/2.5 | 1,350 (0%) | 4mo | $212,900 | $158 | 61 |
| 7351 Village Lake Dr | 0.73mi | 3/2.5 | 1,364 (+1%) | 4mo | $229,000 | $168 | 59 |
| 19326 River Bottom Rd | 0.51mi | 3/2.0 | 1,200 (-11%) | 5mo | $225,000 | $188 | 54 |
| 6635 Rusty Ridge Ln | 0.73mi | 3/2.0 | 1,206 (-11%) | 2mo | $205,000 | $170 | 47 |
Match score weights: distance 35% · size 25% · config 20% · recency 20%. Top-matched comps best support the ARV.
Projected returns pro-forma
-1.27% appreciation · 0.0% rent growth · sell at horizon
- IRR
- -8.7%
- Equity multiple
- 0.64×
- Total profit
- $-17,492
- Equity at exit
- $39,979
- IRR
- -5.1%
- Equity multiple
- 0.60×
- Total profit
- $-19,696
- Equity at exit
- $40,082
Cash invested: $49,000 (down + closing). Projections, not guarantees.
Landlord ↔ Tenant lean methodology
- Overall (STATE)
- 87 Strongly Landlord-Friendly
- State Texas
- 87 Strongly Landlord-Friendly · R+5
- County
- — inherits STATE
- City
- — inherits STATE
ZIP-level market 77449
- Home prices YoY
- -0.5%
- Rents YoY
- -2.9%
- Active inventory
- 744
- Price-to-rent
- 7.8×
Monthly cashflow live
- Estimated rent
- $1,880 high interval (Pro) →
- Mortgage (P&I)
- −$918
- Tax from tax record
- −$403 /mo · $4,838/yr
- Insurance
- −$73
- HOA
- −$42
- Vacancy / Maint / Mgmt
- −$395
- Net cashflow
- $50
Break-even live
UW: 25.0% down · 7.5% · 30yr · 1.5% tax · 5.0% vac · 8.0% maint · 8.0% mgmt
Financing live
Cash to close
- Down payment
- $43,750
- Closing costs
- $5,250
- Reserves months
- —
- Total cash needed
- —
Loan-product check · same deal, 3 products live
Conventional
25% down · 7.5% · 30yr
- Down + closing
- —
- Monthly P&I
- —
- Monthly cashflow
- —
- DSCR
- —
- Eligible?
- —
Personal DTI + credit; lowest rate.
DSCR
20% down · 8.5% · 30yr
- Down + closing
- —
- Monthly P&I
- —
- Monthly cashflow
- —
- DSCR
- —
- Eligible?
- —
No personal income docs; deal must DSCR.
Hard money
10% down · 12.0% · 12mo
- Down + closing
- —
- Monthly P&I
- —
- Monthly cashflow
- —
- DSCR
- —
- Eligible?
- —
Short-term bridge; refi at stabilization.
Rent comps 40 comps
| Address | Beds | Baths | Sqft | Rent | $/sqft | DOM | Units | Dist |
|---|---|---|---|---|---|---|---|---|
| 19442 Elmtree Estates Dr Katy, TX | 3.0 | 2.0 | 1735 | $1,776 | $1.02 | 12d | 1 | 0.12mi |
| 19434 Glenway Falls Dr Katy, TX | 3.0 | 2.0 | 1326 | $1,800 | $1.36 | 43d | 1 | 0.12mi |
| 19607 Buckland Park Dr Katy, TX | 3.0 | 2.0 | 1798 | $1,965 | $1.09 | 2d | 1 | 0.49mi |
| 19715 Swan Valley Dr Cypress, TX | 3.0 | 2.0 | 1380 | $1,886 | $1.37 | 43d | 1 | 0.60mi |
| 19917 Stoney Haven Dr Cypress, TX | 2.0 | 1.5 | 1060 | $1,579 | $1.49 | 43d | 1 | 0.60mi |
| 20123 Braley Ct Cypress, TX | 3.0 | 2.5 | 1726 | $2,036 | $1.18 | 4d | 1 | 0.68mi |
| 19638 Billineys Park Dr Katy, TX | 3.0 | 2.5 | 1752 | $1,750 | $1.00 | 19d | 1 | 0.72mi |
| 6502 Wellington Meadows Dr Katy, TX | 3.0 | 2.0 | 1416 | $1,500 | $1.06 | 12d | 1 | 0.74mi |
| 6810 N Fry Rd Katy, TX | 1.0–3.0 | 1.0–3.0 | 1151 | $2,683 | $2.33 | 1d | 56 | 0.75mi |
| 6619 Rusty Ridge Ln Katy, TX | 3.0 | 2.5 | 1450 | $1,895 | $1.31 | 3d | 1 | 0.76mi |
| 19299 W Little York Rd Unit ACS2 Katy, TX | 2.0 | 2.0 | 1112 | $1,984 | $1.78 | 43d | 1 | 0.80mi |
| 20978 Farm to Market Road 529 Cypress, TX | 2.0 | 2.0 | 1025 | $1,725 | $1.68 | 43d | 1 | 0.82mi |
| 20978 Farm to Market Road 529 Unit SWFS2 Cypress, TX | 2.0 | 2.0 | 1025 | $1,725 | $1.68 | 2d | 1 | 0.82mi |
| 19501 W Little York Rd Katy, TX | 2.0 | 2.0 | 990 | $1,250 | $1.26 | 43d | 1 | 0.86mi |
| 19501 W Little York Rd Katy, TX | 2.0 | 2.0 | 990 | $1,250 | $1.26 | 24d | 1 | 0.86mi |
| 20507 Barker Bend Ct Katy, TX | 3.0 | 2.0 | 1488 | $1,825 | $1.23 | 43d | 1 | 0.91mi |
| 18723 Lippizaner Dr Cypress, TX | 3.0 | 2.0 | 1274 | $1,750 | $1.37 | 7d | 1 | 0.95mi |
| 18723 Lippizaner Dr Cypress, TX | 3.0 | 2.0 | 1274 | $1,750 | $1.37 | 11d | 1 | 0.95mi |
| 7323 Livery Ln Cypress, TX | 3.0 | 2.0 | 1516 | $1,780 | $1.17 | 22d | 1 | 0.95mi |
| 19943 Crested Hill Ln Cypress, TX | 3.0 | 2.0 | 1204 | $1,621 | $1.35 | 7d | 1 | 0.96mi |
| 20126 Breezy Oak Ct Cypress, TX | 3.0 | 2.0 | 1667 | $2,100 | $1.26 | 4d | 1 | 1.00mi |
| 7850 Maverick Trace Ln Cypress, TX | 3.0 | 3.0 | 1852 | $1,875 | $1.01 | 43d | 1 | 1.04mi |
| 20735 Dewberry Creek Ln Katy, TX | 4.0 | 2.0 | 1609 | $1,756 | $1.09 | 22d | 1 | 1.05mi |
| 18531 Lippizaner Dr Cypress, TX | 4.0 | 2.0 | 1692 | $1,799 | $1.06 | 22d | 1 | 1.11mi |
| 6331 Scotchwood Dr Katy, TX | 3.0 | 2.5 | 1610 | $1,681 | $1.04 | 5d | 1 | 1.14mi |
| 5906 Grand Colony Dr Katy, TX | 2.0–3.0 | 2.0 | 1143 | $1,720 | $1.50 | 3d | 9 | 1.22mi |
| 19802 Plantation Grove Trl Katy, TX | 3.0 | 2.0 | 1607 | $1,745 | $1.09 | 43d | 1 | 1.23mi |
| 19735 Plantation Grove Trl Katy, TX | 3.0 | 2.0 | 1404 | $1,719 | $1.22 | 2d | 1 | 1.25mi |
| 19730 Cozy Cabbin Dr Katy, TX | 3.0 | 2.0 | 1544 | $1,800 | $1.17 | 22d | 1 | 1.27mi |
| 21035 Carmel Valley Dr Katy, TX | 3.0 | 2.0 | 1431 | $1,791 | $1.25 | 24d | 1 | 1.27mi |
| 20967 Young Meadows Way Katy, TX | 3.0 | 2.0 | 1256 | $1,795 | $1.43 | 7d | 1 | 1.28mi |
| 18319 Autumn Trails Ln Katy, TX | 3.0 | 2.5 | 1580 | $1,845 | $1.17 | 22d | 1 | 1.28mi |
| 19203 Canaras Ct Katy, TX | 3.0 | 2.0 | 1195 | $1,750 | $1.46 | 17d | 1 | 1.28mi |
| 6210 Scotchwood Dr Katy, TX | 3.0 | 2.0 | 1680 | $1,696 | $1.01 | 22d | 1 | 1.28mi |
| 19218 Sandelford Dr Katy, TX | 3.0 | 2.0 | 1195 | $1,000 | $0.84 | 2d | 1 | 1.30mi |
| 7310 Coconut Bay Dr Cypress, TX | 4.0 | 2.0 | 1620 | $2,307 | $1.42 | 43d | 1 | 1.30mi |
| 18311 Autumn Trails Ln Katy, TX | 3.0 | 2.0 | 1538 | $1,779 | $1.16 | 7d | 1 | 1.31mi |
| 19939 Longenbaugh Rd Cypress, TX | 1.0–2.0 | 1.0–2.0 | 933 | $2,105 | $2.26 | 1d | 15 | 1.32mi |
| 19235 Sandelford Dr Katy, TX | 3.0 | 2.0 | 1330 | $1,000 | $0.75 | 7d | 1 | 1.33mi |
| 6506 Garden Canyon Dr Katy, TX | 3.0 | 2.0 | 1842 | $1,895 | $1.03 | 22d | 1 | 1.33mi |
HOA detail
- Monthly dues
- $42 · $504/yr
Listing history 39 events
-
2026-06-18days on market $175,000 Active 23 DOM
-
2026-06-17price $175,000 Active 22 DOM
-
2026-06-17days on market $185,000 Active 22 DOM
-
2026-06-16days on market $185,000 Active 21 DOM
-
2026-06-15days on market $185,000 Active 20 DOM
-
2026-06-13days on market $185,000 Active 18 DOM
-
2026-06-13days on market $185,000 Active 17 DOM
-
2026-06-09days on market $185,000 Active 14 DOM
-
2026-06-08days on market $185,000 Active 13 DOM
-
2026-06-07days on market $185,000 Active 12 DOM
-
2026-06-04days on market $185,000 Active 9 DOM
-
2026-06-03days on market $185,000 Active 8 DOM
-
2026-06-02days on market $185,000 Active 7 DOM
-
2026-06-01days on market $185,000 Active 6 DOM
-
2026-05-31days on market $185,000 Active 5 DOM
-
2026-05-26$185,000 Active
-
2019-11-06soldstatus
-
2019-11-04soldstatus Sold
-
2019-10-04status Pending
-
2019-09-26price $150,000
-
2019-09-12price $152,000
-
2019-08-28price $154,000
-
2019-08-27$293,000 Active
-
2019-08-21soldstatus
-
2014-05-12soldstatus Sold 126-char remark
Show marketing remark (126 chars)
Open and Great floorplan on a corner lot! Tile throughout main living areas. Lots of natural light! This home won't last long!
-
2014-05-08status Pending 126-char remark
Show marketing remark (126 chars)
Open and Great floorplan on a corner lot! Tile throughout main living areas. Lots of natural light! This home won't last long!
-
2014-05-05status Option Pending 126-char remark
Show marketing remark (126 chars)
Open and Great floorplan on a corner lot! Tile throughout main living areas. Lots of natural light! This home won't last long!
-
2014-04-29$99,900 Active 126-char remark
Show marketing remark (126 chars)
Open and Great floorplan on a corner lot! Tile throughout main living areas. Lots of natural light! This home won't last long!
-
2014-03-14historical
-
2014-03-13status Active
-
2014-03-12status Pending, Continue to Show
-
2014-03-03status Option Pending
-
2014-02-22price $99,900
-
2014-02-01$112,000 Active
-
2012-12-07soldstatus
-
2012-11-19historical
-
2012-11-08$90,000
-
2000-05-03soldstatus
-
2000-04-01soldstatus $67,900
ⓘ Source: listings_history table (triggers on properties + properties_extension) + one-shot
backfill from property_details.listing_events for pre-trigger history.
Tax reassessment forecast TX · Resets to sale price
- Current annual tax
- $4,838 · $403/mo
- Projected year-2 tax
- $4,838 · $403/mo
- Expected delta
- $0/yr ($0/mo · 0.0%)
ⓘ Screening estimate from a state-policy table — verify with the county assessor before closing.
Climate risk First Street
- Flood 6/10 Major FEMA zone X (unshaded) · 74% chance over 30 yrs
- Wildfire 1/10 Low
- Heat 9/10 Extreme 7 d/yr ≥110°F today · 23 d/yr by 30 yrs out
- Wind 9/10 Extreme 99% chance of damaging wind over 30 yrs
- Air quality 2/10 Low 2 unhealthy d/yr today · 2 by 30 yrs out
Nearby sold comps map
Loading sold comps map…
Walkable amenities ~0.75 mi
Loading nearby amenities…
Taxation est. · year 1
- Rental income
- $22,561
- − Mortgage interest
- −$9,803
- − Property taxes
- −$4,838
- − Insurance
- −$875
- − Repairs & maintenance
- −$1,805
- − Management
- −$1,805
- − HOA
- −$504
- − Depreciation
- −$5,091
- Taxable loss
- −$2,159
- Est. tax savings @ 24.0%
- +$518
- After-tax cash flow
- $1,112/yr
For passive investors: Depreciation is non-cash, so a rental often shows a tax loss while cash-flowing — sheltering income. Rental losses are passive: they offset passive income freely, and up to $25,000/yr can offset ordinary (W-2) income if you actively participate and your MAGI is under $100k (phasing out to $0 by $150k); unused losses carry forward. On sale, claimed depreciation is recaptured at up to 25%, and gains may owe capital-gains tax (a 1031 exchange can defer both). Figures are a year-1 estimate at your 24.0% rate — not tax advice; consult a CPA.
Schools (NCES district)
- District
- Cypress-Fairbanks ISD
- NCES district ID
- 4816110
- Math proficiency
- 45% ▼ -12.00%
- Reading proficiency
- 52% ▼ -2.00%
- Median HH income
- $72,025
- Composite
- 43.63/100
- National rank
- #2968
- State rank
- #161 of 826 in TX
Livability — Houston
- Score
- 74/100
- State rank
- #184
- US rank
- #4771
Category grades
Schools grade is shown separately in the Schools card above.
Census & demographics
- County
- Harris County · 4,702,590 people
- City population
- 3,226,434
- Metro
- Houston-The Woodlands-Sugar Land, TX
- Population (ZIP)
- 130,028
- Household income
- $87,808
- Rent vs Own
- Severe rent burden
- 3088.0
Population outlook (Harris County) Hauer SSP2
- Today (2025)
- 5,571,493 people
- By 2030
- 6,089,821 · +9.3%
- By 2040
- 7,142,806 · +28.2%
- By 2050
- 8,185,864 · +46.9%
- By 2075
- 10,574,329 · +89.8%
- By 2100
- 12,109,958 · +117.4%
Race, ethnicity, and origin ACS 2023
- Neighborhood character
- Diverse neighborhood (Simpson 0.68)
- Race & ethnicity
- Hispanic / Latino 49% Two or more races 22% Black 20% White 19% Asian 6%
- Hispanic origin (detail)
- Mexican 26% Puerto Rican 1% Cuban 4%
- Common ancestry
- Lithuanian 1% Italian 1%
- Foreign-born
- 32% · Canada, Jamaica, Vietnam
- Languages at home
- 48% English-only · Spanish 40% Other Indo-European 3% Vietnamese 1%
Political lean MEDSL · Harris
- 2024 margin
- Lean D (+5.5) · D 52.0% · R 46.4% · Other 1.6%
- 2008→2024 swing
- +3.9pp toward D · 2008: 1.6pp · 2024: 5.5pp
- All cycles
- 2024: D+5.5 2020: D+13.3 2016: D+12.4 2012: D+0.1 2008: D+1.6
Not yet ingested
- Civics
- —
Market trends
- HPI YoY
- ▼ -1.27%
- Current HPI
- 254.6622
- Rent YoY
- ▼ -2.86%
- Metro
- Houston-The Woodlands-Sugar Land, TX
- State GDP YoY
- ▲ 3.95%
- F500 in state
- 110
Industry mix (Fortune 500 HQ in TX)
| Industry | F500 HQs | Revenue |
|---|---|---|
| Energy | 16 | $1,198B |
|
||
| Technology | 5 | $198B |
|
||
| Engineering / Construction | 4 | $72B |
|
||
| Energy Services | 3 | $60B |
|
||
| Utilities | 3 | $41B |
|
||
| Healthcare | 2 | $330B |
|
||
Price history
+172.5% since first listed24 events — show timeline
- 2026-05-26 Listed $185,000 HARMLS
- 2019-11-06 Sold (Public Records) — Public Records
- 2019-11-04 Sold (MLS) — HARMLS
- 2019-10-04 Pending — HARMLS
- 2019-09-26 Price Changed $150,000 HARMLS
- 2019-09-12 Price Changed $152,000 HARMLS
- 2019-08-28 Price Changed $154,000 HARMLS
- 2019-08-27 Listed $293,000 HARMLS
- 2019-08-21 Sold (Public Records) — Public Records
- 2014-05-12 Sold (MLS) — HARMLS
- 2014-05-08 Pending — HARMLS
- 2014-05-05 Pending — HARMLS
- 2014-04-29 Listed $99,900 HARMLS
- 2014-03-14 Listing Removed — HARMLS
- 2014-03-13 Relisted — HARMLS
- 2014-03-12 Pending — HARMLS
- 2014-03-03 Pending — HARMLS
- 2014-02-22 Price Changed $99,900 HARMLS
- 2014-02-01 Listed $112,000 HARMLS
- 2012-12-07 Sold (MLS) — HARMLS
- 2012-11-19 Listing Removed — HARMLS
- 2012-11-08 Listed $90,000 HARMLS
- 2000-05-03 Sold (Public Records) — Public Records
- 2000-04-01 Sold (Public Records) $67,900 Public Records
Property tax history
+7.0%/yrLatest (2025): $4,838 · +8.7% YoY. Source: county tax records.
Cash-flow waterfall
monthlySold comps — $/sqft
last 12 mo · ≤1 miLoading sold comps…