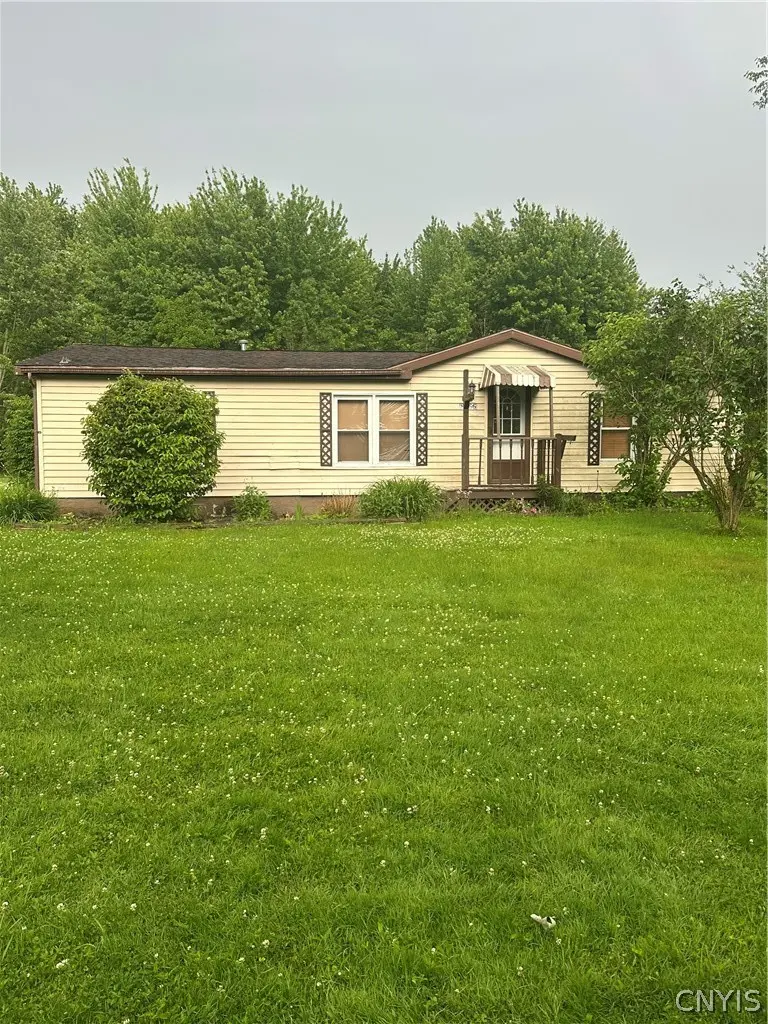
8966 Lestina Beach Rd · Bridgeport, NY
Flood risk 1/10 · Minimal
- FEMA flood zone
- X
- Chance of flooding over 30 yrs
- 0.0%
- Est. flood insurance / yr
- $507 – $1,088
Fire risk 3/10 · Minor
- Est. fire insurance / yr
- $691 – $1,283
Heat risk 3/10 · Minor
- Hot days now (above 95°F)
- 7 days/yr
- Hot days in 30 yrs
- 16 days/yr
Wind risk 1/10 · Minimal
- Chance of severe wind over 30 yrs
- 0.0%
Air-quality risk 2/10 · Minimal
- Unhealthy air days now
- 1 days/yr
- Unhealthy air days in 30 yrs
- 1 days/yr
Risk factors via First Street. Map © Google.
Why this score? — see what drove the C- grade
The composite is a weighted blend of 9 inputs, each scored 0–100. Each bar is that input's sub-score; the figure is the points it added to the 100-point composite (weight × sub-score).
- Cash flow +23.4/30.0
- DSCR +7.5/10.0
- 1% rule +6.2/10.0
- Schools +5.4/10.0
- Livability +3.3/5.0
- ARV discount +3.1/15.0
- Rent growth +2.5/5.0
- Condition / age +2.5/5.0
- Appreciation +0.0/10.0
$209,900
🖨 Deal sheet (PDF) 📄 Offer letter ✓ Due diligence
Listing remarks
A charming property located on Lestina Beach Road in Bridgeport, offering a peaceful setting just a two minute walk from two Oneida Lake public access points. Enjoy the convenience of nearby recreation, dining, and easy commuting while still having a quiet retreat to call home. Whether you’re looking for a year-round residence, weekend getaway, or investment opportunity, this property provides a great chance to enjoy all that Central New York lake living has to offer. This home is a three minute drive to Rogue's Roost Golf Club, seven minute drive to Pointe Place Casino, and a twenty minute drive to the Micron Technology site.
Key facts
- Nearby recreation
- Pointe place casino
- 0.75 acre lot
Tags
Property features AI
Exterior
- Parking: Detached garage; Two garage spaces
- Utilities: Public water connected; Septic tank sewer
- Home design: Single-story home; Existing/resale property; Vinyl siding
- Construction: Vinyl siding construction; Poured foundation; Built (existing structure)
- Exterior features: Blacktop driveway; Leased propane tank; Lake frontage
Interior
- Kitchen: Eat-in kitchen
- Bedrooms: Three main-level bedrooms
- Flooring: Laminate and varying flooring
- Bathrooms: Two full bathrooms (both on the main level)
- Heating & cooling: Propane-fired forced air heating
- Interior features: Eat-in kitchen; Main-level primary bedroom; Crawl space basement
- Laundry & utility: Main-level laundry; Propane water heater
Neighborhood map
What this means for you Summary
Snapshot
- This is a 3-bed/2.0-bath single-family listed at $210k.
Deal economics
- At list price, monthly cash flow is $390 ($5k/yr) — positive.
- The deal already cash-flows at list — no discount required.
- Meets the 1% rule at list price ($2k rent vs $210k).
- Cap rate 8.5% vs local median 2.3% in Bridgeport — top-decile yield for the area; either an underpriced asset or a hidden risk that comps aren't pricing in. Stress-test before assuming the spread holds.
Location & tenants
- Location reads 66/100 on livability (#655 in NY) — a middle-class / working-renter tenant base. Strengths: cost of living A+, housing A+, crime A-; Watch: amenities F, commute F, health & safety D-.
- Chittenango Central School District (rural): math 61% / reading 64% proficiency, ranked #192 of 590 in NY (top 32%) — acceptable for families but not a draw, mixed tenant base, ~2y average lease.
- Zoned schools: Bridgeport Elementary School (math 52% / reading 52%, grade C-, #988 of 2,108 statewide, top 49%, 234 students, 38% FRL); Chittenango Middle School (math 47% / reading 61%, grade B-, #225 of 729 statewide, top 31%, 562 students, 42% FRL); Chittenango High School (math 87% / reading 84%, grade A, #358 of 1,100 statewide, top 33%, 623 students, 38% FRL).
- Market conditions: 74 active listings in the ZIP; 137 units permitted in Madison County in 2024 (46 in 5+ unit buildings).
Forward outlook
- Local home prices are declining (-3.0%/yr); year-one equity from $1k of loan paydown is wiped out by about $6k of value loss. Plan a longer hold.
- Madison County population projected at -24% by 2050 — secular population decline; favor cash flow + early exit over multi-decade hold.
Negotiation context
- Only 9 days on market — expect competitive offers; lowballing is unlikely to land.
- Current owner paid $62k; list at $210k implies a 236% gain — meaningful room to come down on a strong offer.
Questions for the listing agent
- Is there a deadline driving the sale (1031 exchange, divorce, estate, relocation)? That informs how much negotiation room exists.
- What's the average days-on-market for RENTAL listings here right now (not sales)? A rising rental-DOM trend means longer vacancies and softer asking-rent achievability than the comps imply.
- What's the recent tenant-quality profile in this submarket — average credit score on applications, eviction rate, late-payment / NSF rate, and stable-employment percentage? A property-management company in the area should have these aggregated.
- How much new for-sale + rental construction is in the pipeline within 1–3 miles? Heavy new supply typically softens prices + rents 12–24 months out; constrained supply supports both.
Investment metrics
- 1% rule
- 1.12% ✓
- Cap rate
- 8.52%
- Cash-on-cash
- 7.95%
- DSCR
- 1.35
- GRM
- 7.5
CMA / ARV
- ARV (on-the-fly)
- $191,268
- Comps found
- 1
Show comp detail 1 sale within ~0.75 mi
| Address | Dist | Beds/Ba | Sqft | Sold | Price | $/sf | Match |
|---|---|---|---|---|---|---|---|
| 8970 Tyler Rd | 0.47mi | 2/1.0 (-1) | 960 (-5%) | 9mo | $181,000 | $189 | 53 |
Match score weights: distance 35% · size 25% · config 20% · recency 20%. Top-matched comps best support the ARV.
Projected returns pro-forma
-3.0% appreciation · 3.0% rent growth · sell at horizon
- IRR
- -4.2%
- Equity multiple
- 0.84×
- Total profit
- $-9,163
- Equity at exit
- $31,297
- IRR
- 5.5%
- Equity multiple
- 1.41×
- Total profit
- $24,133
- Equity at exit
- $18,148
Cash invested: $58,772 (down + closing). Projections, not guarantees.
Landlord ↔ Tenant lean methodology
- Overall (STATE)
- 15 Strongly Tenant-Friendly
- State New York
- 15 Strongly Tenant-Friendly · D+10
- County
- — inherits STATE
- City
- — inherits STATE
ZIP-level market 13037
- Home prices YoY
- -17.1%
- Active inventory
- 74
- Price-to-rent
- 7.5×
Monthly cashflow live
- Estimated rent
- $2,341 medium interval (Pro) →
- Mortgage (P&I)
- −$1,101
- Tax from tax record
- −$272 /mo · $3,260/yr
- Insurance
- −$87
- HOA
- −$0
- Vacancy / Maint / Mgmt
- −$492
- Net cashflow
- $390
Break-even live
Sensitivity live
| Price | -10% $508 | -5% $449 | +0% $390 | +5% $330 | +10% $271 |
|---|---|---|---|---|---|
| Rent | -10% $205 | -5% $297 | +0% $390 | +5% $482 | +10% $574 |
| Rate | -1.0pp $495 | -0.5pp $443 | base $390 | +0.5pp $335 | +1.0pp $280 |
UW: 25.0% down · 7.5% · 30yr · 1.5% tax · 5.0% vac · 8.0% maint · 8.0% mgmt
Financing live
Cash to close
- Down payment
- $52,475
- Closing costs
- $6,297
- Reserves months
- —
- Total cash needed
- —
Loan-product check · same deal, 3 products live
Conventional
25% down · 7.5% · 30yr
- Down + closing
- —
- Monthly P&I
- —
- Monthly cashflow
- —
- DSCR
- —
- Eligible?
- —
Personal DTI + credit; lowest rate.
DSCR
20% down · 8.5% · 30yr
- Down + closing
- —
- Monthly P&I
- —
- Monthly cashflow
- —
- DSCR
- —
- Eligible?
- —
No personal income docs; deal must DSCR.
Hard money
10% down · 12.0% · 12mo
- Down + closing
- —
- Monthly P&I
- —
- Monthly cashflow
- —
- DSCR
- —
- Eligible?
- —
Short-term bridge; refi at stabilization.
Listing history 7 events
-
2026-06-22days on market $209,900 Active 9 DOM
-
2026-06-18days on market $209,900 Active 6 DOM
-
2026-06-17days on market $209,900 Active 5 DOM
-
2026-06-16days on market $209,900 Active 4 DOM
-
2026-06-15days on market $209,900 Active 3 DOM
-
2026-06-13remarks 634-char remark
-
2026-06-13$209,900 Active 1 DOM
ⓘ Source: listings_history table (triggers on properties + properties_extension) + one-shot
backfill from property_details.listing_events for pre-trigger history.
Tax reassessment forecast NY · Partial reset (capped growth)
- Current annual tax
- $3,260 · $272/mo
- Projected year-2 tax
- $3,404 · $284/mo
- Expected delta
- +$144/yr (+$12/mo · 4.4%)
ⓘ Screening estimate from a state-policy table — verify with the county assessor before closing.
Climate risk First Street
- Flood 1/10 Low FEMA zone X · 0% chance over 30 yrs
- Wildfire 3/10 Moderate
- Heat 3/10 Moderate 7 d/yr ≥95°F today · 16 d/yr by 30 yrs out
- Wind 1/10 Low 0% chance of damaging wind over 30 yrs
- Air quality 2/10 Low 1 unhealthy d/yr today · 1 by 30 yrs out
Nearby sold comps map
Loading sold comps map…
Walkable amenities ~0.75 mi
Loading nearby amenities…
Taxation est. · year 1
- Rental income
- $28,092
- − Mortgage interest
- −$11,758
- − Property taxes
- −$3,260
- − Insurance
- −$1,050
- − Repairs & maintenance
- −$2,247
- − Management
- −$2,247
- − Depreciation
- −$6,106
- Taxable income
- $1,424
- Est. tax owed @ 24.0%
- −$342
- After-tax cash flow
- $4,333/yr
For passive investors: Depreciation is non-cash, so a rental often shows a tax loss while cash-flowing — sheltering income. Rental losses are passive: they offset passive income freely, and up to $25,000/yr can offset ordinary (W-2) income if you actively participate and your MAGI is under $100k (phasing out to $0 by $150k); unused losses carry forward. On sale, claimed depreciation is recaptured at up to 25%, and gains may owe capital-gains tax (a 1031 exchange can defer both). Figures are a year-1 estimate at your 24.0% rate — not tax advice; consult a CPA.
Schools (NCES district)
- District
- Chittenango Central School District
- NCES district ID
- 3607470
- Math proficiency
- 61% ▼ -4.00%
- Reading proficiency
- 64% ▲ 9.00%
- Median HH income
- $62,521
- Composite
- 54.34/100
- National rank
- #1365
- State rank
- #192 of 590 in NY
Livability — Bridgeport
- Score
- 66/100
- State rank
- #655
- US rank
- #12191
Category grades
Schools grade is shown separately in the Schools card above.
Census & demographics
- City population
- 3,611
- Population (ZIP)
- 9,519
Population outlook (Madison County) Hauer SSP2
- Today (2025)
- 69,528 people
- By 2030
- 66,599 · -4.2%
- By 2040
- 59,814 · -14.0%
- By 2050
- 52,842 · -24.0%
- By 2075
- 39,167 · -43.7%
- By 2100
- 28,442 · -59.1%
Race, ethnicity, and origin ACS 2023
- Neighborhood character
- Predominantly White (92%)
- Race & ethnicity
- White 92% Two or more races 5% Hispanic / Latino 4%
- Common ancestry
- Romanian 9% Iranian 3% Lithuanian 3%
- Foreign-born
- 3% · Canada, Jamaica
- Languages at home
- 96% English-only · Spanish 2% French/Haitian/Cajun 1%
Political lean MEDSL · Madison
- 2024 margin
- R (+13.1) · D 43.5% · R 56.5%
- 2008→2024 swing
- -13.9pp toward R · 2008: 0.9pp · 2024: -13.1pp
- All cycles
- 2024: R+13.1 2020: R+10.6 2016: R+15.9 2012: D+0.3 2008: D+0.9
Not yet ingested
- Civics
- —
Market trends
- HPI YoY
- ▼ -56.53%
- Current HPI
- 272.9953
- Rent YoY
- —
- Metro
- —
- State GDP YoY
- ▲ 2.60%
- F500 in state
- 92
Industry mix (Fortune 500 HQ in NY)
| Industry | F500 HQs | Revenue |
|---|---|---|
| Financial Services | 10 | $950B |
|
||
| Consumer Goods | 9 | $162B |
|
||
| Insurance | 4 | $225B |
|
||
| Telecommunications | 2 | $144B |
|
||
| Pharmaceuticals | 2 | $112B |
|
||
| Media / Entertainment | 2 | $69B |
|
||
Price history
+235.8% since first listed2 events — show timeline
- 2026-06-12 Listed $209,900 CNYIS
- 1993-07-19 Sold (Public Records) $62,500 Public Records
Property tax history
+7.3%/yrLatest (2025): $3,260 · +4.2% YoY. Source: county tax records.
Cash-flow waterfall
monthlySold comps — $/sqft
last 12 mo · ≤1 miLoading sold comps…