 Duplex
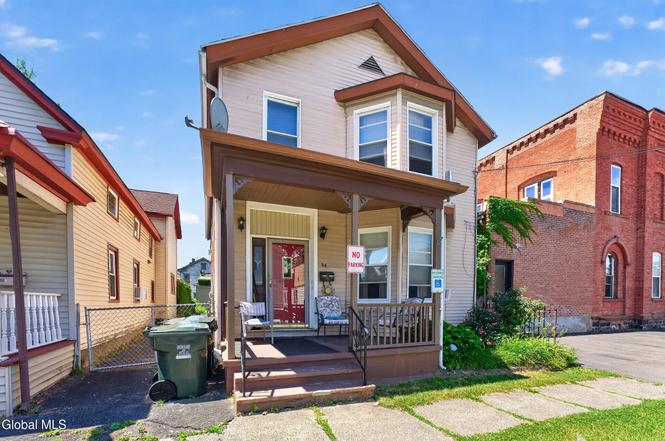
96 Hudson Ave · Green Island, NY
Flood risk 9/10 · Severe
- FEMA flood zone
- X (shaded)
- Chance of flooding over 30 yrs
- 0.99%
- Est. flood insurance / yr
- $473 – $860
Fire risk 3/10 · Minor
- Est. fire insurance / yr
- $691 – $1,283
Heat risk 4/10 · Minor
- Hot days now (above 98°F)
- 7 days/yr
- Hot days in 30 yrs
- 17 days/yr
Wind risk 3/10 · Minor
- Chance of severe wind over 30 yrs
- 7.0%
Air-quality risk 2/10 · Minimal
- Unhealthy air days now
- 0 days/yr
- Unhealthy air days in 30 yrs
- 1 days/yr
Risk factors via First Street. Map © Google.
Why this score? — see what drove the C grade
The composite is a weighted blend of 9 inputs, each scored 0–100. Each bar is that input's sub-score; the figure is the points it added to the 100-point composite (weight × sub-score).
- Cash flow +26.8/30.0
- DSCR +9.2/10.0
- 1% rule +7.4/10.0
- Livability +3.9/5.0
- Appreciation +3.6/10.0
- Rent growth +2.5/5.0
- Schools +2.5/10.0
- Condition / age +2.5/5.0
- ARV discount +0.0/15.0
$239,000
🖨 Deal sheet (PDF) 📄 Offer letter ✓ Due diligence
Multi-family units
County records classify this as Multi-Family (2-4 Unit). Listing-text estimate: 2 units. confirmed
Listing remarks
Two-family home in Green Island offering an excellent opportunity for both owner-occupants and investors. Each spacious unit features 2 bedrooms plus a den/office, along with a comfortable living room, formal dining room, kitchen, and dedicated laundry room. Both First and Second floors have beautiful cherry flooring, first floor has a large three-season room, perfect for relaxing or entertaining. Major updates include replacement windows approximately 12 years ago and a furnace that is just 8 years old. Conveniently located in the Village of Green Island, this property offers generous living space, solid mechanical updates, and strong investment potential. Whether you're looking to offset
Key facts
- Three-season room
- Two-family home
- Cherry flooring
Tags
Property features AI
Finance
- Financial info: No investor / cash flow details provided
Exterior
- Parking: No parking details provided
- Security: No security features provided
- Utilities: Public water; Public sewer; Tenants responsible for electricity and gas
- Home design: Duplex; Level, cleared lot
- Construction: Aluminum siding
- Exterior features: Front porch; Back yard with chain link fencing and gate; Shed(s)
Interior
- Kitchen: No kitchen appliance details provided
- Bedrooms: Two 2-bedroom units (Unit 1: 2 bedrooms, Unit 2: 2 bedrooms)
- Flooring: Hardwood
- Bathrooms: Two full bathrooms total (one full bath on the 1st level, one full bath on the 2nd level); Each unit has one full bathroom
- Heating & cooling: Hot water heating
- Interior features: Hardwood flooring; Unfinished basement
- Laundry & utility: Dedicated laundry room
Neighborhood map
What this means for you Summary
Snapshot
- This is a 2 × 2-bed/1.0-bath units multifamily listed at $239k.
Deal economics
- At list price, monthly cash flow is $597 ($7k/yr) — positive. Per door: $299/mo.
- The deal already cash-flows at list — no discount required.
- Meets the 1% rule at list price ($3k rent vs $239k).
Location & tenants
- Location reads 77/100 on livability (#186 in NY, #2,758 nationally) — a middle-class / working-renter tenant base. Strengths: commute A+, housing A+, health & safety A+; Watch: employment D, schools F.
- Green Island Union Free School District (suburban): math 20% / reading 30% proficiency, ranked #740 of 755 in NY (top 98%) — low school quality limits family demand, transient renter base, plan for 1-2y turnover.
- Market conditions: 8 active listings in the ZIP; 6 comparable units currently listed for rent nearby; rentals at typical pace (median 21d on market — plan ~3-4 weeks tenant-placement turnaround); 675 units permitted in Albany County in 2024 (451 in 5+ unit buildings).
Forward outlook
- Local home prices are declining (-2.7%/yr); year-one equity from $2k of loan paydown is wiped out by about $6k of value loss. Plan a longer hold.
- Albany County population projected at +9% by 2050 — modest demand growth; plan on rents tracking national, not racing it.
- At projected returns (-2.7% appreciation + 3.0% rent growth), your $67k cash investment doubles in ~10 years — after that, you're playing with house money.
Negotiation context
- Only 4 days on market — expect competitive offers; lowballing is unlikely to land.
Risks & watch-outs
- Watch-outs: flood insurance adds $56/mo; built in 1916 — expect roof / HVAC / electrical / plumbing capex.
- Climate carrying-cost: severe flood risk — expect insurance premiums to compound above CPI over the hold.
Questions for the listing agent
- Can we see the unit-by-unit rent roll, current vacancy, and any below-market leases? What's the average tenancy length?
- What capital expenditures (roof, boiler, parking lot, exteriors) have been made in the last 5 years, and what's planned in the next 2?
- Built in 1916 — when were the roof, HVAC, electrical panel, plumbing, and water heater last replaced?
- What's the actual annual flood-insurance premium (NFIP or private), and is the property in a SFHA with mandatory coverage?
- Is there a deadline driving the sale (1031 exchange, divorce, estate, relocation)? That informs how much negotiation room exists.
- Schools are F-rated, which usually means shorter tenancies and higher turnover. Who's the typical renter profile here, and what's been the actual vacancy rate?
- What's the average days-on-market for RENTAL listings here right now (not sales)? A rising rental-DOM trend means longer vacancies and softer asking-rent achievability than the comps imply.
- What's the recent tenant-quality profile in this submarket — average credit score on applications, eviction rate, late-payment / NSF rate, and stable-employment percentage? A property-management company in the area should have these aggregated.
- How much new apartment / multifamily construction is in the pipeline within 1–3 miles? Heavy new supply (>2% of stock underway) typically softens rents 12–24 months out; light construction supports rent growth.
Investment metrics
- 1% rule
- 1.24% ✓
- Cap rate
- 9.57%
- Cash-on-cash
- 11.71%
- DSCR
- 1.52
- GRM
- 6.7
CMA / ARV
- ARV (on-the-fly)
- $196,830
- Comps found
- 12
Show comp detail 12 sales within ~0.75 mi
| Address | Dist | Beds/Ba | Sqft | Sold | Price | $/sf | Match |
|---|---|---|---|---|---|---|---|
| 102 Hudson Ave | 0.04mi | 5/2.0 (+1) | 2,508 (+3%) | 10mo | $176,000 | $70 | 79 |
| 97 George St | 0.03mi | 5/2.0 (+1) | 2,578 (+6%) | 9mo | $195,000 | $76 | 76 |
| 2513 5th Ave | 0.36mi | 3/3.0 (-1) | 2,426 (-0%) | 8mo | $120,000 | $49 | 68 |
| 374 8th St | 0.54mi | 5/2.0 (+1) | 2,348 (-3%) | 2mo | $197,000 | $84 | 63 |
| 2439 5th Ave | 0.37mi | 3/2.0 (-1) | 2,264 (-7%) | 6mo | $250,000 | $110 | 62 |
| 43 Oakwood Ave | 0.67mi | 4/2.0 | 2,394 (-2%) | 9mo | $126,000 | $53 | 59 |
| 747 River St | 0.55mi | 5/2.0 (+1) | 2,508 (+3%) | 9mo | $115,000 | $46 | 57 |
| 137 Paine St | 0.16mi | 5/2.0 (+1) | 2,090 (-14%) | 11mo | $170,000 | $81 | 55 |
| 29 Craig St | 0.61mi | 5/2.0 (+1) | 2,352 (-3%) | 12mo | $375,000 | $159 | 52 |
| 25 High St | 0.26mi | 5/2.0 (+1) | 2,116 (-13%) | 12mo | $255,000 | $121 | 52 |
| 2142 5th Ave | 0.62mi | 4/4.0 | 2,741 (+13%) | 4mo | $400,000 | $146 | 38 |
| 3229 6th Ave | 0.72mi | 5/3.0 (+1) | 2,658 (+9%) | 9mo | $30,000 | $11 | 34 |
Match score weights: distance 35% · size 25% · config 20% · recency 20%. Top-matched comps best support the ARV.
Projected returns pro-forma
-2.71% appreciation · 3.0% rent growth · sell at horizon
- IRR
- 0.9%
- Equity multiple
- 1.04×
- Total profit
- $2,362
- Equity at exit
- $38,768
- IRR
- 10.0%
- Equity multiple
- 1.81×
- Total profit
- $54,001
- Equity at exit
- $26,085
Cash invested: $66,920 (down + closing). Projections, not guarantees.
Landlord ↔ Tenant lean methodology
- Overall (STATE)
- 15 Strongly Tenant-Friendly
- State New York
- 15 Strongly Tenant-Friendly · D+10
- County
- — inherits STATE
- City
- — inherits STATE
ZIP-level market 12183
- Home prices YoY
- -1.5%
- Active inventory
- 8
- Price-to-rent
- 13.4×
Monthly cashflow live
- Estimated rent
- $2,972 high interval (Pro) →
- Mortgage (P&I)
- −$1,253
- Tax from tax record
- −$342 /mo · $4,106/yr
- Insurance
- −$100
- Flood insurance flood zone
- −$56 /mo · $666/yr
- HOA
- −$0
- Vacancy / Maint / Mgmt
- −$624
- Net cashflow
- $597
Break-even live
Sensitivity live
| Price | -10% $733 | -5% $665 | +0% $597 | +5% $530 | +10% $462 |
|---|---|---|---|---|---|
| Rent | -10% $362 | -5% $480 | +0% $597 | +5% $715 | +10% $832 |
| Rate | -1.0pp $718 | -0.5pp $658 | base $597 | +0.5pp $535 | +1.0pp $472 |
2-unit breakdown (identical units grouped — click to expand)
| Units | Beds | Baths | Est. rent |
|---|---|---|---|
| 2× units | 2 | 1 | $2,972 |
| #1 | 2 | 1 | $1,486 |
| #2 | 2 | 1 | $1,486 |
| Total (2 units) | $2,972 | ||
UW: 25.0% down · 7.5% · 30yr · 1.5% tax · 5.0% vac · 8.0% maint · 8.0% mgmt
Financing live
Cash to close
- Down payment
- $59,750
- Closing costs
- $7,170
- Reserves months
- —
- Total cash needed
- —
Loan-product check · same deal, 3 products live
Conventional
25% down · 7.5% · 30yr
- Down + closing
- —
- Monthly P&I
- —
- Monthly cashflow
- —
- DSCR
- —
- Eligible?
- —
Personal DTI + credit; lowest rate.
DSCR
20% down · 8.5% · 30yr
- Down + closing
- —
- Monthly P&I
- —
- Monthly cashflow
- —
- DSCR
- —
- Eligible?
- —
No personal income docs; deal must DSCR.
Hard money
10% down · 12.0% · 12mo
- Down + closing
- —
- Monthly P&I
- —
- Monthly cashflow
- —
- DSCR
- —
- Eligible?
- —
Short-term bridge; refi at stabilization.
Rent comps 6 comps
| Address | Beds | Baths | Sqft | Rent | $/sqft | DOM | Units | Dist |
|---|---|---|---|---|---|---|---|---|
| 904 Peoples Ave Troy, NY | 4.0 | 1.0 | 1800 | $645 | $0.36 | 20d | 1 | 0.77mi |
| 17 State St Troy, NY | 4.0 | 1.0–1.5 | 1810 | $3,635 | $2.01 | 16d | 7 | 0.87mi |
| 150 2nd St Troy, NY | 4.0 | 1.5 | 2442 | $3,000 | $1.23 | 23d | 1 | 1.18mi |
| 288 Hoosick St Troy, NY | 3.0 | 1.0 | 1800 | $695 | $0.39 | 20d | 1 | 1.20mi |
| 97 14th St Unit 2 Troy, NY | 5.0 | 2.0 | 1600 | $625 | $0.39 | 20d | 1 | 1.27mi |
| 51 14th St Unit 2 Troy, NY | 4.0 | 2.0 | 2000 | $725 | $0.36 | 20d | 1 | 1.36mi |
Listing history 3 events
-
2026-06-21days on market $239,000 Active 4 DOM
-
2026-06-17remarks 699-char remark
-
2026-06-17$239,000 Active 1 DOM
ⓘ Source: listings_history table (triggers on properties + properties_extension) + one-shot
backfill from property_details.listing_events for pre-trigger history.
Tax reassessment forecast NY · Partial reset (capped growth)
- Current annual tax
- $4,106 · $342/mo
- Projected year-2 tax
- $4,106 · $342/mo
- Expected delta
- $0/yr ($0/mo · 0.0%)
ⓘ Screening estimate from a state-policy table — verify with the county assessor before closing.
Climate risk First Street
- Flood 9/10 Extreme FEMA zone X (shaded) · 99% chance over 30 yrs
- Wildfire 3/10 Moderate
- Heat 4/10 Moderate 7 d/yr ≥98°F today · 17 d/yr by 30 yrs out
- Wind 3/10 Moderate 7% chance of damaging wind over 30 yrs
- Air quality 2/10 Low 0 unhealthy d/yr today · 1 by 30 yrs out
Nearby sold comps map
Loading sold comps map…
Walkable amenities ~0.75 mi
Loading nearby amenities…
Taxation est. · year 1
- Rental income
- $35,664
- − Mortgage interest
- −$13,388
- − Property taxes
- −$4,106
- − Insurance
- −$1,862
- − Repairs & maintenance
- −$2,853
- − Management
- −$2,853
- − Depreciation
- −$6,953
- Taxable income
- $3,650
- Est. tax owed @ 24.0%
- −$876
- After-tax cash flow
- $6,291/yr
For passive investors: Depreciation is non-cash, so a rental often shows a tax loss while cash-flowing — sheltering income. Rental losses are passive: they offset passive income freely, and up to $25,000/yr can offset ordinary (W-2) income if you actively participate and your MAGI is under $100k (phasing out to $0 by $150k); unused losses carry forward. On sale, claimed depreciation is recaptured at up to 25%, and gains may owe capital-gains tax (a 1031 exchange can defer both). Figures are a year-1 estimate at your 24.0% rate — not tax advice; consult a CPA.
Schools (NCES district)
- District
- Green Island Union Free School District
- NCES district ID
- 3612660
- Math proficiency
- 20% ▬ 0.00%
- Reading proficiency
- 30% ▲ 5.00%
- Median HH income
- $51,151
- Composite
- 25.19/100
- National rank
- #12922
- State rank
- #740 of 755 in NY
Livability — Green Island
- Score
- 77/100
- State rank
- #186
- US rank
- #2758
Category grades
Schools grade is shown separately in the Schools card above.
Census & demographics
- Census place
- Green Island, NY
- City population
- 2,966
- Population (ZIP)
- 2,966
Population outlook (Albany County) Hauer SSP2
- Today (2025)
- 320,794 people
- By 2030
- 327,401 · +2.1%
- By 2040
- 338,218 · +5.4%
- By 2050
- 348,467 · +8.6%
- By 2075
- 381,693 · +19.0%
- By 2100
- 393,809 · +22.8%
Race, ethnicity, and origin ACS 2023
- Neighborhood character
- Predominantly White (66%)
- Race & ethnicity
- White 66% Hispanic / Latino 16% Black 9% Two or more races 8% Asian 1%
- Hispanic origin (detail)
- Puerto Rican 15%
- Common ancestry
- Lithuanian 5% Romanian 3% Iranian 2%
- Foreign-born
- 2% · China, Canada
- Languages at home
- 94% English-only · Spanish 4% Chinese 1% Other Indo-European 1%
Political lean MEDSL · Albany
- 2024 margin
- Strong D (+25.8) · D 62.9% · R 37.1%
- 2008→2024 swing
- -3.6pp toward R · 2008: 29.4pp · 2024: 25.8pp
- All cycles
- 2024: D+25.8 2020: D+31.4 2016: D+24.3 2012: D+31.0 2008: D+29.4
Not yet ingested
- Civics
- —
Market trends
- HPI YoY
- ▼ -2.71%
- Current HPI
- 177.2848
- Rent YoY
- —
- Metro
- —
- State GDP YoY
- ▲ 2.60%
- F500 in state
- 92
Industry mix (Fortune 500 HQ in NY)
| Industry | F500 HQs | Revenue |
|---|---|---|
| Financial Services | 10 | $950B |
|
||
| Consumer Goods | 9 | $162B |
|
||
| Insurance | 4 | $225B |
|
||
| Telecommunications | 2 | $144B |
|
||
| Pharmaceuticals | 2 | $112B |
|
||
| Media / Entertainment | 2 | $69B |
|
||
Price history
1 event — show timeline
- 2026-06-17 Listed $239,000 Global MLS
Property tax history
+5.6%/yrLatest (2025): $4,106 · -1.0% YoY. Source: county tax records.
Cash-flow waterfall
monthlySold comps — $/sqft
last 12 mo · ≤1 miLoading sold comps…