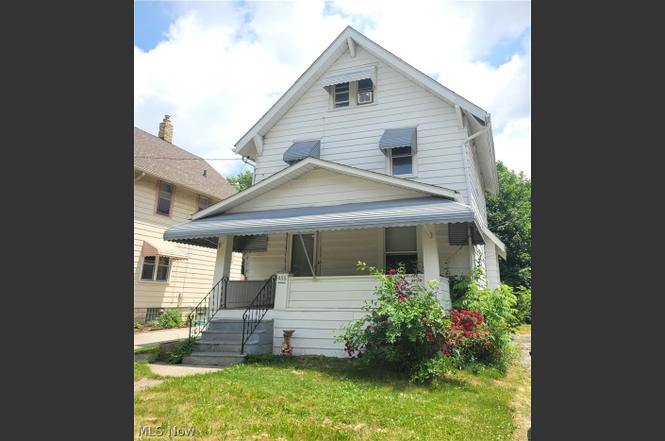
455 Delmar Ave · Akron, OH
Flood risk 3/10 · Minor
- FEMA flood zone
- X (unshaded)
- Chance of flooding over 30 yrs
- 0.2%
- Est. flood insurance / yr
- $473 – $860
Fire risk 1/10 · Minimal
- Est. fire insurance / yr
- $713 – $1,323
Heat risk 3/10 · Minor
- Hot days now (above 97°F)
- 7 days/yr
- Hot days in 30 yrs
- 16 days/yr
Wind risk 1/10 · Minimal
- Chance of severe wind over 30 yrs
- —
Air-quality risk 3/10 · Minor
- Unhealthy air days now
- 2 days/yr
- Unhealthy air days in 30 yrs
- 4 days/yr
Risk factors via First Street. Map © Google.
Why this score? — see what drove the B grade
The composite is a weighted blend of 9 inputs, each scored 0–100. Each bar is that input's sub-score; the figure is the points it added to the 100-point composite (weight × sub-score).
- Cash flow +26.7/30.0
- ARV discount +15.0/15.0
- DSCR +9.2/10.0
- 1% rule +7.9/10.0
- Livability +4.0/5.0
- Rent growth +3.7/5.0
- Condition / age +2.5/5.0
- Schools +2.1/10.0
- Appreciation +0.0/10.0
$89,000
🖨 Deal sheet (PDF) 📄 Offer letter ✓ Due diligence
Listing remarks MLS
This home gives you a couple great opportunities. .. the choice is yours. The first one, it is a great size and location is super close to Route 8. It's a blank slate, and has room for everyone, you can even tailor it to your specific taste. .. or, the second option, you can use it as an income/rental property. There are a few perks that come with this home. The current owner just recently installed a new roof. There are newer vinyl windows, exterior has been freshly painted and the kitchen has new laminate flooring installed. The second floor has three nice sized bedrooms and a full bathroom. The third floor is huge, could be utilized as a second living space or even a home office.
Key facts
- Colonial style home
- Remodeled kitchen
- Original woodwork
Tags
Property features AI
Finance
- Financial info: Annual taxes recorded (amount withheld from description)
Exterior
- Parking: Driveway
- Utilities: Public water; Public sewer; Electric service (standard)
- Home design: Single-family property (above-grade finished area recorded); Facing direction not specified
- Construction: Aluminum siding; Shingle roof; Full unfinished basement; Year built per public records
- Exterior features: Rear covered porch; Front porch; Deck; City lot
Interior
- Kitchen: Disposal; Microwave; Range; Refrigerator
- Bedrooms: Total of 7 rooms (bedroom count not specified); Basement level present
- Bathrooms: 1 full bathroom
- Interior features: Blinds on windows; Ceiling fan(s)
- Laundry & utility: Washer; Dryer located in basement
Neighborhood map
What this means for you Summary
Snapshot
- This is a 3-bed/1.0-bath single-family listed at $89k.
Deal economics
- At list price, monthly cash flow is $242 ($3k/yr) — positive.
- The deal already cash-flows at list — no discount required.
- Meets the 1% rule at list price ($1k rent vs $89k).
- Cap rate 9.6% vs local median 6.6% in Akron — top-decile yield for the area; either an underpriced asset or a hidden risk that comps aren't pricing in. Stress-test before assuming the spread holds.
Location & tenants
- Location reads 81/100 on livability (#104 in OH, #1,591 nationally) — a professional / high-income tenant draw. Strengths: amenities A+, commute A+, cost of living A+; Watch: crime F, employment F.
- Akron City (urban): math 22% / reading 30% proficiency, ranked #602 of 656 in OH (top 92%) — low school quality limits family demand, transient renter base, plan for 1-2y turnover; 66% free/reduced lunch — lower-income household profile, screen leases tightly.
- Market conditions: Rents rising fast (+4.8%/yr); 86 active listings in the ZIP; 26 comparable units currently listed for rent nearby; rentals lingering (median 45d on market — plan ~5-8 weeks vacancy on turnover, expect pricing pressure); 54% of comp listings sitting > 30 days — soft ceiling on asking rent; lower-income renter base — watch delinquency; 1,114 units permitted in Summit County in 2024 (397 in 5+ unit buildings).
- This rent runs 34% of the median local income ($41k/yr) — at the standard rent-burdened threshold; future hikes will face affordability resistance.
Forward outlook
- Local home prices are declining (-3.0%/yr); year-one equity from $615 of loan paydown is wiped out by about $3k of value loss. Plan a longer hold.
- Summit County population projected to shrink 6% by 2050 — rents likely to lag national; underwrite the cash flow, not the appreciation.
- At projected returns (-3.0% appreciation + 4.8% rent growth), your $25k cash investment doubles in ~8 years — after that, you're playing with house money.
Negotiation context
- Only 2 days on market — expect competitive offers; lowballing is unlikely to land.
- 5 sale attempts since 31y ago with the ask held roughly flat each time — persistent listings suggest the price (not the market) is what's stuck; bring a comps-based counter.
- Current owner paid $52k; list at $89k implies a 71% gain — meaningful room to come down on a strong offer.
Risks & watch-outs
- Watch-outs: built in 1919 — expect roof / HVAC / electrical / plumbing capex.
Questions for the listing agent
- Built in 1919 — when were the roof, HVAC, electrical panel, plumbing, and water heater last replaced?
- Is there a deadline driving the sale (1031 exchange, divorce, estate, relocation)? That informs how much negotiation room exists.
- Crime grade is F in this area — have there been break-ins, vandalism, or insurance claims at this property in the last 3 years? What carrier currently insures it and at what premium?
- What's the average days-on-market for RENTAL listings here right now (not sales)? A rising rental-DOM trend means longer vacancies and softer asking-rent achievability than the comps imply.
- What's the recent tenant-quality profile in this submarket — average credit score on applications, eviction rate, late-payment / NSF rate, and stable-employment percentage? A property-management company in the area should have these aggregated.
- How much new for-sale + rental construction is in the pipeline within 1–3 miles? Heavy new supply typically softens prices + rents 12–24 months out; constrained supply supports both.
Investment metrics
- 1% rule
- 1.29% ✓
- Cap rate
- 9.56%
- Cash-on-cash
- 11.66%
- DSCR
- 1.52
- GRM
- 6.5
CMA / ARV
- ARV (on-the-fly)
- $142,792
- Comps found
- 12
Show comp detail 12 sales within ~0.75 mi
| Address | Dist | Beds/Ba | Sqft | Sold | Price | $/sf | Match |
|---|---|---|---|---|---|---|---|
| 203 E York St | 0.24mi | 3/1.5 | 1,415 (+3%) | 6mo | $75,000 | $53 | 77 |
| 523 Evans Ave | 0.44mi | 3/1.5 | 1,374 (+0%) | 6mo | $125,000 | $91 | 72 |
| 670 Singley Ave | 0.36mi | 3/1.5 | 1,312 (-4%) | 4mo | $170,000 | $130 | 70 |
| 600 Robinette Ct | 0.27mi | 3/2.0 | 1,264 (-8%) | 1mo | $105,000 | $83 | 69 |
| 307 E Glenwood Ave | 0.09mi | 4/2.0 (+1) | 1,528 (+11%) | 1mo | $65,000 | $43 | 67 |
| 683 Ranney St | 0.45mi | 3/1.0 | 1,291 (-6%) | 3mo | $125,000 | $97 | 67 |
| 230 Helen Ave | 0.72mi | 4/1.5 (+1) | 1,390 (+1%) | 1mo | $154,000 | $111 | 57 |
| 705 Damon St | 0.54mi | 3/2.0 | 1,486 (+8%) | 6mo | $175,000 | $118 | 52 |
| 310 Ontario St | 0.52mi | 3/2.5 | 1,512 (+10%) | 5mo | $225,000 | $149 | 48 |
| 584 Evans Ave | 0.56mi | 3/1.5 | 1,196 (-13%) | 4mo | $162,000 | $135 | 48 |
| 717 Columbia Ave | 0.48mi | 3/2.5 | 1,572 (+14%) | 1mo | $163,000 | $104 | 47 |
| 868 Iredell St | 0.58mi | 4/2.0 (+1) | 1,548 (+13%) | 6mo | $145,000 | $94 | 38 |
Match score weights: distance 35% · size 25% · config 20% · recency 20%. Top-matched comps best support the ARV.
Projected returns pro-forma
-3.0% appreciation · 4.82% rent growth · sell at horizon
- IRR
- 3.3%
- Equity multiple
- 1.13×
- Total profit
- $3,194
- Equity at exit
- $13,270
- IRR
- 14.6%
- Equity multiple
- 2.28×
- Total profit
- $31,963
- Equity at exit
- $7,695
Cash invested: $24,920 (down + closing). Projections, not guarantees.
Landlord ↔ Tenant lean methodology
- Overall (STATE)
- 73 Landlord-Friendly
- State Ohio
- 73 Landlord-Friendly · R+6
- County
- — inherits STATE
- City
- — inherits STATE
ZIP-level market 44310
- Rents YoY
- 4.8%
- Active inventory
- 86
- Price-to-rent
- 6.5×
Monthly cashflow live
- Estimated rent
- $1,149 high interval (Pro) →
- Mortgage (P&I)
- −$467
- Tax from tax record
- −$162 /mo · $1,940/yr
- Insurance
- −$37
- HOA
- −$0
- Vacancy / Maint / Mgmt
- −$241
- Net cashflow
- $242
Break-even live
Sensitivity live
| Price | -10% $293 | -5% $267 | +0% $242 | +5% $217 | +10% $192 |
|---|---|---|---|---|---|
| Rent | -10% $151 | -5% $197 | +0% $242 | +5% $288 | +10% $333 |
| Rate | -1.0pp $287 | -0.5pp $265 | base $242 | +0.5pp $219 | +1.0pp $196 |
UW: 25.0% down · 7.5% · 30yr · 1.5% tax · 5.0% vac · 8.0% maint · 8.0% mgmt
Financing live
Cash to close
- Down payment
- $22,250
- Closing costs
- $2,670
- Reserves months
- —
- Total cash needed
- —
Loan-product check · same deal, 3 products live
Conventional
25% down · 7.5% · 30yr
- Down + closing
- —
- Monthly P&I
- —
- Monthly cashflow
- —
- DSCR
- —
- Eligible?
- —
Personal DTI + credit; lowest rate.
DSCR
20% down · 8.5% · 30yr
- Down + closing
- —
- Monthly P&I
- —
- Monthly cashflow
- —
- DSCR
- —
- Eligible?
- —
No personal income docs; deal must DSCR.
Hard money
10% down · 12.0% · 12mo
- Down + closing
- —
- Monthly P&I
- —
- Monthly cashflow
- —
- DSCR
- —
- Eligible?
- —
Short-term bridge; refi at stabilization.
Rent comps 26 comps
| Address | Beds | Baths | Sqft | Rent | $/sqft | DOM | Units | Dist |
|---|---|---|---|---|---|---|---|---|
| 500 Delmar Ave Unit 502 Akron, OH | 2.0 | 1.0 | 1000 | $775 | $0.78 | 24d | 1 | 0.09mi |
| 265 Cranz Pl Akron, OH | 4.0 | 1.0 | 1376 | $1,300 | $0.94 | 44d | 1 | 0.13mi |
| 559 Dayton St Akron, OH | 3.0 | 1.0 | 1200 | $1,200 | $1.00 | 44d | 1 | 0.25mi |
| 586 Robinette Ct Akron, OH | 4.0 | 1.0 | 1040 | $1,250 | $1.20 | 44d | 1 | 0.25mi |
| 570 Dayton St Akron, OH | 3.0 | 1.0 | 1140 | $1,350 | $1.18 | 15d | 1 | 0.28mi |
| 649 Patterson Ave Unit B Akron, OH | 3.0 | 1.0 | 1200 | $900 | $0.75 | 44d | 1 | 0.38mi |
| 649 Patterson Ave Unit a Akron, OH | 2.0 | 1.0 | 1000 | $775 | $0.78 | 44d | 1 | 0.38mi |
| 674 Thayer St Unit 674 Akron, OH | 2.0 | 1.0 | 1208 | $825 | $0.68 | 44d | 1 | 0.47mi |
| 674 Thayer St #676 Akron, OH | 2.0 | 1.0 | 1208 | $795 | $0.66 | 44d | 1 | 0.47mi |
| 15 W York St Akron, OH | 3.0 | 1.0 | 1178 | $1,150 | $0.98 | 22d | 1 | 0.65mi |
| 15 W York St Akron, OH | 2.0 | 1.5 | 1178 | $1,150 | $0.98 | 15d | 1 | 0.65mi |
| 825 Avon St Unit 1 Akron, OH | 2.0 | 1.0 | 960 | $875 | $0.91 | 22d | 1 | 0.81mi |
| 248 Arch St Akron, OH | 3.0 | 1.0 | 1210 | $1,300 | $1.07 | 44d | 1 | 0.95mi |
| 240 Arch St Akron, OH | 3.0 | 1.0 | 1182 | $1,375 | $1.16 | 44d | 1 | 0.96mi |
| 835 Carlysle St Akron, OH | 3.0 | 1.0 | 1152 | $1,250 | $1.09 | 44d | 1 | 1.00mi |
| 805 Carpenter St Akron, OH | 3.0 | 1.0 | 1056 | $1,100 | $1.04 | 24d | 1 | 1.02mi |
| 539 E Cuyahoga Falls Ave Unit 1 Akron, OH | 2.0 | 1.0 | 1000 | $895 | $0.90 | 24d | 1 | 1.11mi |
| 1088 Lexington Ave Akron, OH | 3.0 | 1.0 | 1008 | $1,600 | $1.59 | 14d | 1 | 1.20mi |
| 208 Denver St Akron, OH | 3.0 | 1.0 | 1248 | $895 | $0.72 | 44d | 1 | 1.28mi |
| 207 Crosby St Akron, OH | 4.0 | 1.0 | 1200 | $1,395 | $1.16 | 44d | 1 | 1.33mi |
| 1180 Murray Ave Akron, OH | 3.0 | 2.0 | 1340 | $1,175 | $0.88 | 22d | 1 | 1.36mi |
| 156 S Main St Akron, OH | 2.0–3.0 | 2.0 | 1197 | $2,985 | $2.49 | 24d | 4 | 1.41mi |
| 1423 Creighton Ave Unit 1 Akron, OH | 3.0 | 1.0 | 1040 | $1,100 | $1.06 | 24d | 1 | 1.47mi |
| 545 E Buchtel Ave Unit 1 Akron, OH | 2.0 | 1.0 | 900 | $1,300 | $1.44 | 44d | 1 | 1.47mi |
| 605 E Buchtel Ave Unit 1 Akron, OH | 2.0 | 1.0 | 1000 | $695 | $0.69 | 15d | 1 | 1.47mi |
| 311 Crestwood Ave Akron, OH | 4.0 | 2.0 | 1800 | $1,395 | $0.78 | 44d | 1 | 1.49mi |
Listing history 4 events
-
2026-06-19remarks 599-char remark
-
2026-06-18days on market $89,000 Active 2 DOM
-
2026-06-17remarks 584-char remark
-
2026-06-17$89,000 Active 1 DOM
ⓘ Source: listings_history table (triggers on properties + properties_extension) + one-shot
backfill from property_details.listing_events for pre-trigger history.
Tax reassessment forecast OH · Partial reset (capped growth)
- Current annual tax
- $1,940 · $162/mo
- Projected year-2 tax
- $1,940 · $162/mo
- Expected delta
- $0/yr ($0/mo · 0.0%)
ⓘ Screening estimate from a state-policy table — verify with the county assessor before closing.
Climate risk First Street
- Flood 3/10 Moderate FEMA zone X (unshaded) · 20% chance over 30 yrs
- Wildfire 1/10 Low
- Heat 3/10 Moderate 7 d/yr ≥97°F today · 16 d/yr by 30 yrs out
- Wind 1/10 Low
- Air quality 3/10 Moderate 2 unhealthy d/yr today · 4 by 30 yrs out
Nearby sold comps map
Loading sold comps map…
Walkable amenities ~0.75 mi
Loading nearby amenities…
Taxation est. · year 1
- Rental income
- $13,787
- − Mortgage interest
- −$4,985
- − Property taxes
- −$1,940
- − Insurance
- −$445
- − Repairs & maintenance
- −$1,103
- − Management
- −$1,103
- − Depreciation
- −$2,589
- Taxable income
- $1,622
- Est. tax owed @ 24.0%
- −$389
- After-tax cash flow
- $2,517/yr
For passive investors: Depreciation is non-cash, so a rental often shows a tax loss while cash-flowing — sheltering income. Rental losses are passive: they offset passive income freely, and up to $25,000/yr can offset ordinary (W-2) income if you actively participate and your MAGI is under $100k (phasing out to $0 by $150k); unused losses carry forward. On sale, claimed depreciation is recaptured at up to 25%, and gains may owe capital-gains tax (a 1031 exchange can defer both). Figures are a year-1 estimate at your 24.0% rate — not tax advice; consult a CPA.
Schools (NCES district)
- District
- Akron City
- NCES district ID
- 3904348
- Math proficiency
- 22% ▼ -17.00%
- Reading proficiency
- 30% ▼ -12.00%
- Median HH income
- $33,811
- Composite
- 21.31/100
- National rank
- #8383
- State rank
- #602 of 656 in OH
Livability — Akron
- Score
- 81/100
- State rank
- #104
- US rank
- #1591
Category grades
Schools grade is shown separately in the Schools card above.
Census & demographics
- Census place
- Akron, OH
- County
- Summit County · 440,783 people
- City population
- 174,375
- Metro
- Akron, OH
- Population (ZIP)
- 25,496
- Household income
- $41,066
- Rent vs Own
- Severe rent burden
- 2058.0
Population outlook (Summit County) Hauer SSP2
- Today (2025)
- 546,583 people
- By 2030
- 544,028 · -0.5%
- By 2040
- 531,363 · -2.8%
- By 2050
- 514,923 · -5.8%
- By 2075
- 481,765 · -11.9%
- By 2100
- 432,265 · -20.9%
Race, ethnicity, and origin ACS 2023
- Neighborhood character
- Highly diverse neighborhood (Simpson 0.73)
- Race & ethnicity
- White 40% Black 25% Asian 20% Hispanic / Latino 10% Two or more races 9%
- Hispanic origin (detail)
- Mexican 6% Puerto Rican 2%
- Common ancestry
- Romanian 2% Slovak 1% Italian 1%
- Foreign-born
- 25% · Canada, India, Philippines
- Languages at home
- 69% English-only · Other Indo-European 13% Spanish 7% Other Asian/Pacific 6%
Political lean MEDSL · Summit
- 2024 margin
- Lean D (+7.0) · D 53.0% · R 46.0%
- 2008→2024 swing
- -9.6pp toward R · 2008: 16.6pp · 2024: 7.0pp
- All cycles
- 2024: D+7.0 2020: D+9.6 2016: D+8.2 2012: D+14.8 2008: D+16.6
Not yet ingested
- Civics
- —
Market trends
- HPI YoY
- ▼ -194.41%
- Current HPI
- 203.4431
- Rent YoY
- ▲ 4.82%
- Metro
- Akron, OH
- State GDP YoY
- ▲ 1.98%
- F500 in state
- 48
Industry mix (Fortune 500 HQ in OH)
| Industry | F500 HQs | Revenue |
|---|---|---|
| Insurance | 3 | $145B |
|
||
| Industrial Machinery | 3 | $49B |
|
||
| Financial Services | 3 | $24B |
|
||
| Consumer Goods | 2 | $93B |
|
||
| Aerospace / Defense | 2 | $47B |
|
||
| Utilities | 2 | $33B |
|
||
Price history
+65.1% since first listed12 events — show timeline
- 2026-06-16 Listed $89,000 MLSNOW
- 2019-02-11 Relisted — MLSNOW
- 2019-02-11 Sold (Public Records) $52,000 Public Records
- 2019-02-11 Sold (MLS) $52,000 MLSNOW
- 2019-02-10 Listing Removed — MLSNOW
- 2019-01-29 Contingent — MLSNOW
- 2018-09-17 Price Changed $58,000 MLSNOW
- 2018-09-10 Listed $68,000 MLSNOW
- 2015-09-09 Listing Removed — MLSNOW
- 2015-05-28 Price Changed $58,000 MLSNOW
- 2015-03-04 Listed $62,000 MLSNOW
- 1995-09-22 Listed $53,900 MLSNOW
Property tax history
+1.6%/yrLatest (2025): $1,940 · -2.8% YoY. Source: county tax records.
Cash-flow waterfall
monthlySold comps — $/sqft
last 12 mo · ≤1 miLoading sold comps…