 Multi-family
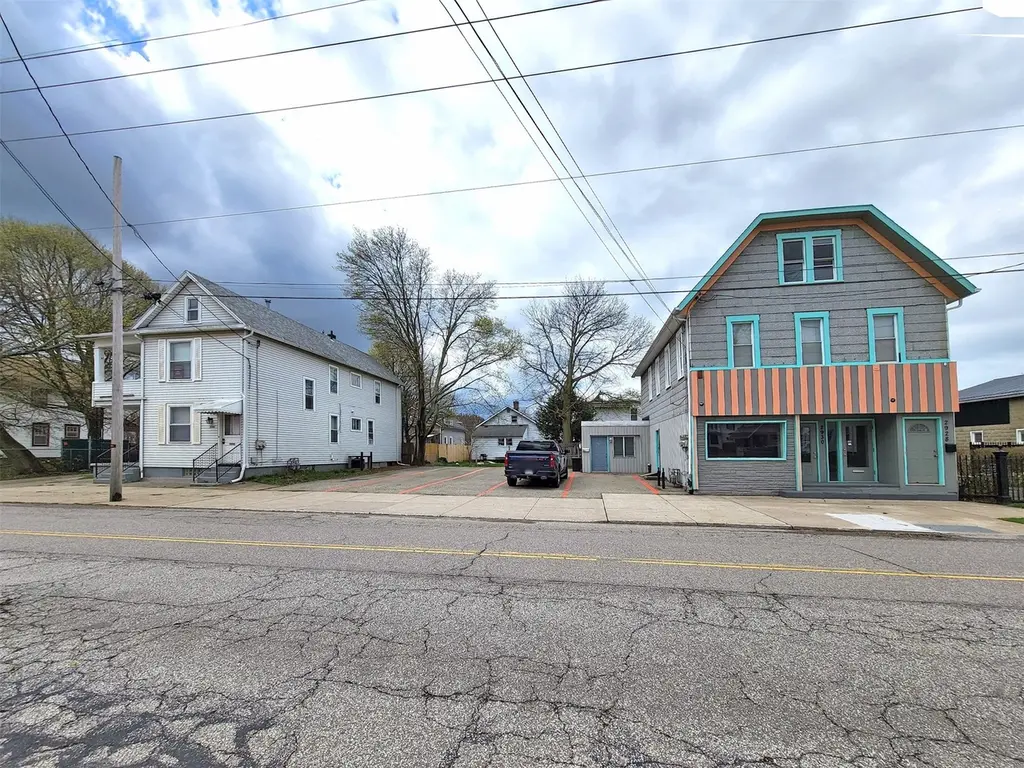
2930 Cherry St · Erie, PA
Flood risk No data
- FEMA flood zone
- —
- Chance of flooding over 30 yrs
- —
- Est. flood insurance / yr
- —
Fire risk No data
- Est. fire insurance / yr
- —
Heat risk No data
- Hot days now (above threshold)
- —
- Hot days in 30 yrs
- —
Wind risk No data
- Chance of severe wind over 30 yrs
- —
Air-quality risk No data
- Unhealthy air days now
- —
- Unhealthy air days in 30 yrs
- —
Risk factors via First Street. Map © Google.
Why this score? — see what drove the C+ grade
The composite is a weighted blend of 9 inputs, each scored 0–100. Each bar is that input's sub-score; the figure is the points it added to the 100-point composite (weight × sub-score).
- Cash flow +28.0/30.0
- DSCR +9.9/10.0
- 1% rule +7.7/10.0
- ARV discount +7.5/15.0
- Livability +4.2/5.0
- Condition / age +3.8/5.0
- Rent growth +2.5/5.0
- Schools +1.3/10.0
- Appreciation +0.0/10.0
$645,000
🖨 Deal sheet 📄 Offer letter ✓ Due diligence
Multi-family units
County records classify this as Multi-Family (5+ Unit). Listing-text estimate: 1 unit. estimate disagrees with records
5+ unit building — per-unit beds/baths from public records are typically unavailable; the breakdown below (if shown) is an estimate from the listing text.
Listing remarks MLS
6-Unit, mixed-use investment package for sale. Comprised of 3 contiguous parcels totaling 0.19± acres with 1 commercial unit & 5 residential rentals. 83% occupancy with excellent income history. $54,615 annual income & $42,040 net operating income (2025). Upside potential with below market rents. Unit mix: 911± SF office/storefront, 1 bed/1 bath apartment, 2 bed/1 bath apartment, 3 bed/1 bath single family home & two 3 bed/1 bath apartments. Off-street parking for ±14 with paved parking lot for ±9 and 2 private driveways plus on-street parking. All units are separately metered for gas & /or electric (1 unit all electric). Centrally located just 0.4 miles (3 blocks) from Erie High School, the City’s only high school, and near Peach Street’s retail/service corridor and multiple public bus routes. Zoned Traditional Single Family Development (R-1A) in the City of Erie’s west side. $70,053 pro forma annual income - $57,959 pro forma NOI. Offered at $645,000 – 9.0% pro forma cap rate.
Key facts
- Private driveways
- Paved parking lot
- 3 contiguous parcels
Tags
Neighborhood map
What this means for you Summary
Snapshot
- This is a 12-bed/7.0-bath multifamily listed at $645k. Condition is rated good.
Deal economics
- At list price, monthly cash flow is $2k ($24k/yr) — positive.
- The deal already cash-flows at list — no discount required.
- Meets the 1% rule at list price ($8k rent vs $645k).
- Recommended offer: $626k (3.0% below list) — sets the bar for market timing.
- Cap rate 10.0% vs local median 5.2% in Erie — top-decile yield for the area; either an underpriced asset or a hidden risk that comps aren't pricing in. Stress-test before assuming the spread holds.
Location & tenants
- Location reads 83/100 on livability (#109 in PA, #840 nationally) — a professional / high-income tenant draw. Strengths: amenities A+, commute A+, cost of living A+; Watch: crime D+, employment F.
- Erie City SD (urban): math 12% / reading 19% proficiency, ranked #510 of 539 in PA (top 95%) — low school quality limits family demand, transient renter base, plan for 1-2y turnover; 81% free/reduced lunch — lower-income household profile, screen leases tightly.
- Market conditions: 76 active listings in the ZIP; 364 units permitted in Erie County in 2024 (188 in 5+ unit buildings).
- At $8,177/mo this rent would consume 174% of the median local household income ($56k/yr) (locally 420% of renters already pay >50% of income on rent) — very limited rent-growth headroom before tenants either downsize or default.
Forward outlook
- Local home prices are declining (-3.0%/yr); year-one equity from $4k of loan paydown is wiped out by about $19k of value loss. Plan a longer hold.
- Erie County population projected at -14% by 2050 — secular population decline; favor cash flow + early exit over multi-decade hold.
- At projected returns (-3.0% appreciation + 3.0% rent growth), your $181k cash investment doubles in ~9 years — after that, you're playing with house money.
Negotiation context
- It's been on market 46 days — a 3% lower offer ($626k) is reasonable based on typical stale-listing flexibility.
Risks & watch-outs
- Watch-outs: built in 1909 — expect roof / HVAC / electrical / plumbing capex.
Questions for the listing agent
- It's been on market 46 days. Have you received any prior offers? Is the seller open to a 3% concession, seller financing, or rate buy-down credit?
- Built in 1909 — when were the roof, HVAC, electrical panel, plumbing, and water heater last replaced?
- Is there a deadline driving the sale (1031 exchange, divorce, estate, relocation)? That informs how much negotiation room exists.
- Crime grade is D in this area — have there been break-ins, vandalism, or insurance claims at this property in the last 3 years? What carrier currently insures it and at what premium?
- What's the average days-on-market for RENTAL listings here right now (not sales)? A rising rental-DOM trend means longer vacancies and softer asking-rent achievability than the comps imply.
- What's the recent tenant-quality profile in this submarket — average credit score on applications, eviction rate, late-payment / NSF rate, and stable-employment percentage? A property-management company in the area should have these aggregated.
- How much new apartment / multifamily construction is in the pipeline within 1–3 miles? Heavy new supply (>2% of stock underway) typically softens rents 12–24 months out; light construction supports rent growth.
Investment metrics
- 1% rule
- 1.27% ✓
- Cap rate
- 10.02%
- Cash-on-cash
- 13.30%
- DSCR
- 1.59
- GRM
- 6.6
CMA / ARV
- ARV (median comp)
- $178,533
- List price
- $645,000
- Delta
- 261.28%
- Verdict
- OVERPRICED
- Comps
- 9 within 1.0 mi
Show comp detail 1 sale within ~0.75 mi
| Address | Dist | Beds/Ba | Sqft | Sold | Price | $/sf | Match |
|---|---|---|---|---|---|---|---|
| 330-338 W 23rd St | 0.58mi | 11/6.0 (-1) | 5,808 (-12%) | 9mo | $337,600 | $58 | 38 |
Match score weights: distance 35% · size 25% · config 20% · recency 20%. Top-matched comps best support the ARV.
Projected returns pro-forma
-3.0% appreciation · 3.0% rent growth · sell at horizon
- IRR
- 3.3%
- Equity multiple
- 1.13×
- Total profit
- $23,138
- Equity at exit
- $96,172
- IRR
- 12.9%
- Equity multiple
- 2.02×
- Total profit
- $184,868
- Equity at exit
- $55,768
Cash invested: $180,600 (down + closing). Projections, not guarantees.
Landlord ↔ Tenant lean methodology
- Overall (STATE)
- 62 Landlord-Friendly
- State Pennsylvania
- 62 Landlord-Friendly · EVEN
- County
- — inherits STATE
- City
- — inherits STATE
ZIP-level market 16508
- Home prices YoY
- -22.8%
- Active inventory
- 76
- Price-to-rent
- 57.9×
Monthly cashflow live
- Estimated rent
- $8,177 high interval (Pro) →
- Mortgage (P&I)
- −$3,382
- Tax est. 1.5%
- −$806 /mo · $9,675/yr
- Insurance
- −$269
- HOA
- −$0
- Vacancy / Maint / Mgmt
- −$1,717
- Net cashflow
- $2,002
Break-even live
8-unit breakdown (identical units grouped — click to expand)
| Units | Beds | Baths | Est. rent |
|---|---|---|---|
| 2× units | 1 | 1 | $1,856 |
| #1 | 1 | 1 | $928 |
| #7 | 1 | 1 | $928 |
| 1× unit | 2 | 1 | $984 |
| 5× units | 3 | 1 | $5,335 |
| #3 | 3 | 1 | $1,067 |
| #4 | 3 | 1 | $1,067 |
| #5 | 3 | 1 | $1,067 |
| #6 | 3 | 1 | $1,067 |
| #8 | 3 | 1 | $1,067 |
| Total (8 units) | $8,177 | ||
UW: 25.0% down · 7.5% · 30yr · 1.5% tax · 5.0% vac · 8.0% maint · 8.0% mgmt
Financing live
Cash to close
- Down payment
- $161,250
- Closing costs
- $19,350
- Reserves months
- —
- Total cash needed
- —
Loan-product check · same deal, 3 products live
Conventional
25% down · 7.5% · 30yr
- Down + closing
- —
- Monthly P&I
- —
- Monthly cashflow
- —
- DSCR
- —
- Eligible?
- —
Personal DTI + credit; lowest rate.
DSCR
20% down · 8.5% · 30yr
- Down + closing
- —
- Monthly P&I
- —
- Monthly cashflow
- —
- DSCR
- —
- Eligible?
- —
No personal income docs; deal must DSCR.
Hard money
10% down · 12.0% · 12mo
- Down + closing
- —
- Monthly P&I
- —
- Monthly cashflow
- —
- DSCR
- —
- Eligible?
- —
Short-term bridge; refi at stabilization.
Listing history 18 events
-
2026-06-19days on market $645,000 Active 46 DOM
-
2026-06-18days on market $645,000 Active 45 DOM
-
2026-06-17days on market $645,000 Active 44 DOM
-
2026-06-16days on market $645,000 Active 43 DOM
-
2026-06-15days on market $645,000 Active 42 DOM
-
2026-06-14days on market $645,000 Active 40 DOM
-
2026-06-13days on market $645,000 Active 39 DOM
-
2026-06-10days on market $645,000 Active 37 DOM
-
2026-06-09days on market $645,000 Active 36 DOM
-
2026-06-08days on market $645,000 Active 35 DOM
-
2026-06-07days on market $645,000 Active 34 DOM
-
2026-06-05days on market $645,000 Active 31 DOM
-
2026-06-03days on market $645,000 Active 30 DOM
-
2026-06-02days on market $645,000 Active 29 DOM
-
2026-06-01days on market $645,000 Active 28 DOM
-
2026-05-31days on market $645,000 Active 27 DOM
-
2026-05-30days on market $645,000 Active 26 DOM
-
2026-05-04$645,000 Active 1068-char remark
Show marketing remark (1068 chars)
6-Unit, mixed-use investment package for sale. Comprised of 3 contiguous parcels totaling 0.19± acres with 1 commercial unit & 5 residential rentals. 83% occupancy with excellent income history. $54,615 annual income & $42,040 net operating income (2025). Upside potential with below market rents. Unit mix: 911± SF office/storefront, 1 bed/1 bath apartment, 2 bed/1 bath apartment, 3 bed/1 bath single family home & two 3 bed/1 bath apartments. Off-street parking for ±14 with paved parking lot for ±9 and 2 private driveways plus on-street parking. All units are separately metered for gas & /or electric (1 unit all electric). Centrally located just 0.4 miles (3 blocks) from Erie High School, the City’s only high school, and near Peach Street’s retail/service corridor and multiple public bus routes. Zoned Traditional Single Family Development (R-1A) in the City of Erie’s west side. $70,053 pro forma annual income - $57,959 pro forma NOI. Offered at $645,000 – 9.0% pro forma cap rate.
ⓘ Source: listings_history table (triggers on properties + properties_extension) + one-shot
backfill from property_details.listing_events for pre-trigger history.
Nearby sold comps map
Loading sold comps map…
Walkable amenities ~0.75 mi
Loading nearby amenities…
Taxation est. · year 1
- Rental income
- $98,124
- − Mortgage interest
- −$36,130
- − Property taxes
- −$9,675
- − Insurance
- −$3,225
- − Repairs & maintenance
- −$7,850
- − Management
- −$7,850
- − Depreciation
- −$18,764
- Taxable income
- $14,630
- Est. tax owed @ 24.0%
- −$3,511
- After-tax cash flow
- $20,517/yr
For passive investors: Depreciation is non-cash, so a rental often shows a tax loss while cash-flowing — sheltering income. Rental losses are passive: they offset passive income freely, and up to $25,000/yr can offset ordinary (W-2) income if you actively participate and your MAGI is under $100k (phasing out to $0 by $150k); unused losses carry forward. On sale, claimed depreciation is recaptured at up to 25%, and gains may owe capital-gains tax (a 1031 exchange can defer both). Figures are a year-1 estimate at your 24.0% rate — not tax advice; consult a CPA.
Condition & rehab AI · 12 photos
This 6-unit mixed-use property is in good condition with cosmetic updates needed. Painting the exterior and replacing the carpet would significantly enhance its resale and rental value.
Repairs flagged
- Minor Kitchen flooring — Carpeted floor
- Minor Bathroom fixtures — Dated fixtures
Value-add opportunities
- Both Paint exterior — Enhances curb appeal and resale value
- Both Replace carpet — Improves living space and rental appeal
Renovation cost estimate screening
| Repair item | Severity | Est. cost |
|---|---|---|
| Kitchen flooring · Carpeted floor | Minor | $500–3,000 |
| Bathroom fixtures · Dated fixtures | Minor | $500–3,000 |
| Total estimated repair cost · 2 items | $1,000–6,000 |
Value-add ROI direction
- Both Paint exterior — Enhances curb appeal and resale value ↑
- Both Replace carpet — Improves living space and rental appeal ↑
ⓘ Cost ranges are severity-bucket heuristics (US national rule-of-thumb). Get contractor quotes + a written scope before underwriting a rehab budget.
Schools (NCES district)
- District
- Erie City SD
- NCES district ID
- 4209300
- Math proficiency
- 12% ▼ -11.00%
- Reading proficiency
- 19% ▼ -16.00%
- Median HH income
- $33,625
- Composite
- 12.59/100
- National rank
- #9617
- State rank
- #510 of 539 in PA
Livability — Erie
- Score
- 83/100
- State rank
- #109
- US rank
- #840
Category grades
Schools grade is shown separately in the Schools card above.
Census & demographics
- Census place
- Erie, PA
- County
- Erie County · 92,215 people
- City population
- 92,215
- Metro
- Erie, PA
- Population (ZIP)
- 14,958
- Household income
- $56,391
- Rent vs Own
- Severe rent burden
- 420.0
Population outlook (Erie County) Hauer SSP2
- Today (2025)
- 272,159 people
- By 2030
- 266,299 · -2.2%
- By 2040
- 250,987 · -7.8%
- By 2050
- 234,925 · -13.7%
- By 2075
- 199,164 · -26.8%
- By 2100
- 162,985 · -40.1%
Race, ethnicity, and origin ACS 2023
- Neighborhood character
- Predominantly White (80%)
- Race & ethnicity
- White 80% Two or more races 12% Black 5% Hispanic / Latino 4% Asian 1%
- Common ancestry
- Romanian 13% Lithuanian 2% Scotch-Irish 2%
- Foreign-born
- 3% · Canada
- Languages at home
- 95% English-only · Spanish 2% Russian/Polish/Slavic 1% Other Indo-European 1%
Political lean MEDSL · Erie
- 2024 margin
- Toss-up / Even · D 49.0% · R 50.0%
- 2008→2024 swing
- -20.9pp toward R · 2008: 19.9pp · 2024: -1.0pp
- All cycles
- 2024: R+1.0 2020: D+1.0 2016: R+2.0 2012: D+16.9 2008: D+19.9
Not yet ingested
- Civics
- —
Market trends
- HPI YoY
- ▼ -74.05%
- Current HPI
- 250.759
- Rent YoY
- —
- Metro
- Erie, PA
- State GDP YoY
- ▲ 1.68%
- F500 in state
- 34
Industry mix (Fortune 500 HQ in PA)
| Industry | F500 HQs | Revenue |
|---|---|---|
| Healthcare | 2 | $309B |
|
||
| Insurance | 2 | $27B |
|
||
| Telecommunications / Media | 1 | $124B |
|
||
| Industrial Distribution | 1 | $22B |
|
||
| Financial Services | 1 | $20B |
|
||
| Chemicals / Materials | 1 | $18B |
|
||
Price history
1 event — show timeline
- 2026-05-04 Listed $645,000 GEBOR
Cash-flow waterfall
monthlySold comps — $/sqft
last 12 mo · ≤1 miLoading sold comps…