4860 Pony Express Trl #19 · Pollock Pines, CA
Flood risk 1/10 · Minimal
- FEMA flood zone
- X (unshaded)
- Chance of flooding over 30 yrs
- 0.0%
- Est. flood insurance / yr
- $507 – $1,088
Fire risk 7/10 · Major
- Est. fire insurance / yr
- $659 – $1,223
Heat risk 4/10 · Minor
- Hot days now (above 98°F)
- 6 days/yr
- Hot days in 30 yrs
- 14 days/yr
Wind risk 1/10 · Minimal
- Chance of severe wind over 30 yrs
- —
Air-quality risk 10/10 · Severe
- Unhealthy air days now
- 26 days/yr
- Unhealthy air days in 30 yrs
- 31 days/yr
Risk factors via First Street. Map © Google.
Why this score? — see what drove the B grade
The composite is a weighted blend of 9 inputs, each scored 0–100. Each bar is that input's sub-score; the figure is the points it added to the 100-point composite (weight × sub-score).
- Cash flow +30.0/30.0
- 1% rule +10.0/10.0
- DSCR +10.0/10.0
- ARV discount +7.5/15.0
- Schools +5.1/10.0
- Condition / age +4.8/5.0
- Livability +2.8/5.0
- Rent growth +2.5/5.0
- Appreciation +0.0/10.0
$79,950
🖨 Deal sheet 📄 Offer letter ✓ Due diligence
Listing remarks
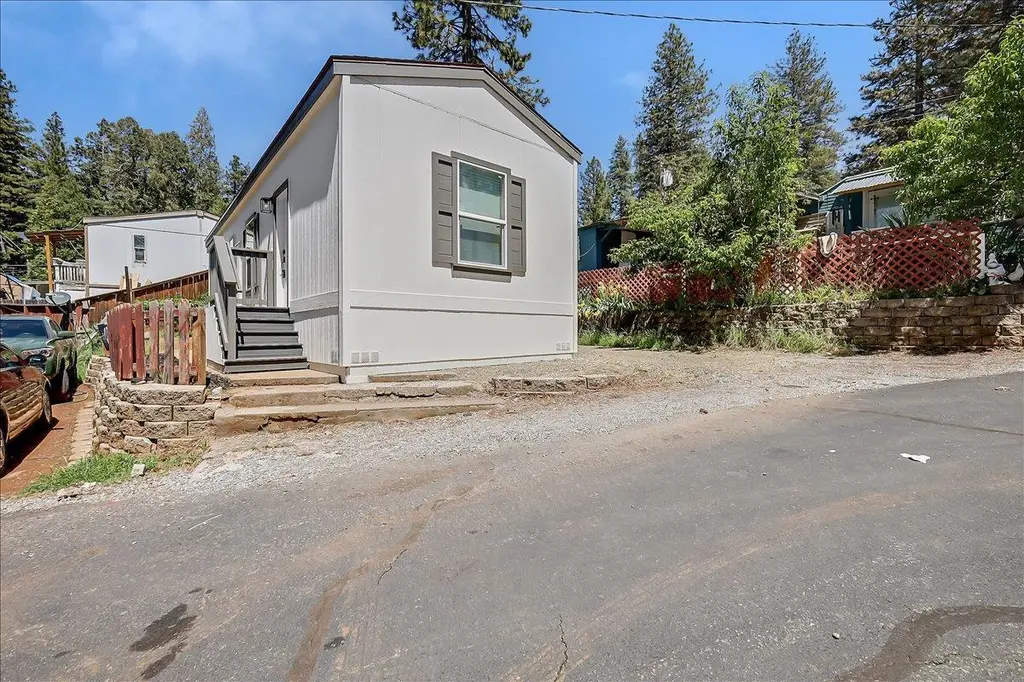
Welcome to this brand new 2025 Clayton home located in the desirable Cedar Grove community in Camino, CA. This 2 bedroom, 1 bathroom home offers a bright open concept layout with sleek modern finishes throughout. The kitchen and bathroom feature stylish black matte finishes, adding a clean, contemporary touch. Enjoy abundant natural light and an indoor laundry area with washer and dryer hookups. Designed for comfort and efficiency, this home is completely move-in ready. Situated in a peaceful community with affordable space rent of $695 per month, this is a great opportunity for low-maintenance living in the beautiful Apple Hill area.
Key facts
- Move-in ready
- Indoor laundry area
- Parking
Tags
Property features AI
Finance
- Other: Located in Cedar Grove community at 4860 Pony Express Trl #19, Camino, CA 95709 (directions available)
- Financial info: Land lease: No (listed land lease amount present but property marked as not land leased)
- HOA & community: No association
Exterior
- Parking: Assigned parking
- Utilities: Propane service; Individual electric meter; Public water; Public sewer
- Home design: Manufactured in-park single wide; Made by Clayton (CMH Manufacturing West, Inc.); Built in 2025
- Construction: Wood skirting; Manufactured construction
- Exterior features: Composition roof; Wood skirting
Interior
- Kitchen: Free standing gas range; Free standing refrigerator; Range hood; Dishwasher
- Bedrooms: 2 bedrooms
- Flooring: Carpet
- Bathrooms: 1 full bathroom with tub/shower over
- Heating & cooling: Central heating; Gas heating; No cooling
- Interior features: Stone countertops in the kitchen; Kitchen and family/dining combo; Living room with other/unspecified feature; Pets allowed
- Laundry & utility: Laundry hookups inside (in kitchen/inside area/inside room); Gas hookup for laundry
Neighborhood map
What this means for you Summary
Snapshot
- This is a 2-bed/1.0-bath manufactured listed at $80k. Condition is rated excellent.
Deal economics
- At list price, monthly cash flow is $757 ($9k/yr) — positive.
- The deal already cash-flows at list — no discount required.
- Meets the 1% rule at list price ($2k rent vs $80k).
- Recommended offer: $78k (3.0% below list) — sets the bar for market timing.
- Cap rate 17.6% vs local median 3.8% in Pollock Pines — top-decile yield for the area; either an underpriced asset or a hidden risk that comps aren't pricing in. Stress-test before assuming the spread holds.
Location & tenants
- Location reads 55/100 on livability (#864 in CA) — a working-class tenant base; expect higher turnover. Strengths: housing A-; Watch: schools D, crime D, amenities F.
- El Dorado Union High (suburban): math 44% / reading 69% proficiency, ranked #89 of 517 in CA (top 17%) — acceptable for families but not a draw, mixed tenant base, ~2y average lease.
- Market conditions: 48 active listings in the ZIP; 437 units permitted in El Dorado County in 2024 (0 in 5+ unit buildings).
Forward outlook
- Local home prices are declining (-3.0%/yr); year-one equity from $552 of loan paydown is wiped out by about $2k of value loss. Plan a longer hold.
- El Dorado County population projected to shrink 3% by 2050 — rents likely to lag national; underwrite the cash flow, not the appreciation.
- At projected returns (-3.0% appreciation + 3.0% rent growth), your $22k cash investment doubles in ~3 years — after that, you're playing with house money.
Negotiation context
- It's been on market 52 days — a 3% lower offer ($78k) is reasonable based on typical stale-listing flexibility.
Risks & watch-outs
- Climate carrying-cost: major wildfire risk — expect insurance premiums to compound above CPI over the hold.
Questions for the listing agent
- It's been on market 52 days. Have you received any prior offers? Is the seller open to a 3% concession, seller financing, or rate buy-down credit?
- Is there a deadline driving the sale (1031 exchange, divorce, estate, relocation)? That informs how much negotiation room exists.
- Schools are D-rated, which usually means shorter tenancies and higher turnover. Who's the typical renter profile here, and what's been the actual vacancy rate?
- Crime grade is D in this area — have there been break-ins, vandalism, or insurance claims at this property in the last 3 years? What carrier currently insures it and at what premium?
- What's the average days-on-market for RENTAL listings here right now (not sales)? A rising rental-DOM trend means longer vacancies and softer asking-rent achievability than the comps imply.
- What's the recent tenant-quality profile in this submarket — average credit score on applications, eviction rate, late-payment / NSF rate, and stable-employment percentage? A property-management company in the area should have these aggregated.
- How much new for-sale + rental construction is in the pipeline within 1–3 miles? Heavy new supply typically softens prices + rents 12–24 months out; constrained supply supports both.
Investment metrics
- 1% rule
- 2.07% ✓
- Cap rate
- 17.65%
- Cash-on-cash
- 40.56%
- DSCR
- 2.80
- GRM
- 4.0
CMA / ARV
No comps found within radius.
Projected returns pro-forma
-3.0% appreciation · 3.0% rent growth · sell at horizon
- IRR
- 37.0%
- Equity multiple
- 2.58×
- Total profit
- $35,260
- Equity at exit
- $11,921
- IRR
- 43.6%
- Equity multiple
- 5.15×
- Total profit
- $92,859
- Equity at exit
- $6,913
Cash invested: $22,386 (down + closing). Projections, not guarantees.
Landlord ↔ Tenant lean methodology
- Overall (STATE)
- 18 Strongly Tenant-Friendly
- State California
- 18 Strongly Tenant-Friendly · D+13
- County
- — inherits STATE
- City
- — inherits STATE
ZIP-level market 95709
- Home prices YoY
- -28.7%
- Active inventory
- 48
- Price-to-rent
- 4.0×
Monthly cashflow live
- Estimated rent
- $1,657 medium interval (Pro) →
- Mortgage (P&I)
- −$419
- Tax est. 1.5%
- −$100 /mo · $1,199/yr
- Insurance
- −$33
- HOA
- −$0
- Vacancy / Maint / Mgmt
- −$348
- Net cashflow
- $757
Break-even live
UW: 25.0% down · 7.5% · 30yr · 1.5% tax · 5.0% vac · 8.0% maint · 8.0% mgmt
Financing live
Cash to close
- Down payment
- $19,988
- Closing costs
- $2,398
- Reserves months
- —
- Total cash needed
- —
Loan-product check · same deal, 3 products live
Conventional
25% down · 7.5% · 30yr
- Down + closing
- —
- Monthly P&I
- —
- Monthly cashflow
- —
- DSCR
- —
- Eligible?
- —
Personal DTI + credit; lowest rate.
DSCR
20% down · 8.5% · 30yr
- Down + closing
- —
- Monthly P&I
- —
- Monthly cashflow
- —
- DSCR
- —
- Eligible?
- —
No personal income docs; deal must DSCR.
Hard money
10% down · 12.0% · 12mo
- Down + closing
- —
- Monthly P&I
- —
- Monthly cashflow
- —
- DSCR
- —
- Eligible?
- —
Short-term bridge; refi at stabilization.
Listing history 14 events
-
2026-06-19price $79,950 Active 52 DOM
-
2026-06-18days on market $84,950 Active 52 DOM
-
2026-06-17days on market $84,950 Active 51 DOM
-
2026-06-16days on market $84,950 Active 50 DOM
-
2026-06-15days on market $84,950 Active 49 DOM
-
2026-06-13days on market $84,950 Active 47 DOM
-
2026-06-09days on market $84,950 Active 43 DOM
-
2026-06-08days on market $84,950 Active 42 DOM
-
2026-06-07days on market $84,950 Active 41 DOM
-
2026-06-05days on market $84,950 Active 38 DOM
-
2026-06-03days on market $84,950 Active 37 DOM
-
2026-06-02days on market $84,950 Active 36 DOM
-
2026-06-01days on market $84,950 Active 35 DOM
-
2026-05-31days on market $84,950 Active 34 DOM
ⓘ Source: listings_history table (triggers on properties + properties_extension) + one-shot
backfill from property_details.listing_events for pre-trigger history.
Climate risk First Street
- Flood 1/10 Low FEMA zone X (unshaded) · 0% chance over 30 yrs
- Wildfire 7/10 Severe
- Heat 4/10 Moderate 6 d/yr ≥98°F today · 14 d/yr by 30 yrs out
- Wind 1/10 Low
- Air quality 10/10 Extreme 26 unhealthy d/yr today · 31 by 30 yrs out
Nearby sold comps map
Loading sold comps map…
Walkable amenities ~0.75 mi
Loading nearby amenities…
Taxation est. · year 1
- Rental income
- $19,886
- − Mortgage interest
- −$4,478
- − Property taxes
- −$1,199
- − Insurance
- −$400
- − Repairs & maintenance
- −$1,591
- − Management
- −$1,591
- − Depreciation
- −$2,326
- Taxable income
- $8,301
- Est. tax owed @ 24.0%
- −$1,992
- After-tax cash flow
- $7,087/yr
For passive investors: Depreciation is non-cash, so a rental often shows a tax loss while cash-flowing — sheltering income. Rental losses are passive: they offset passive income freely, and up to $25,000/yr can offset ordinary (W-2) income if you actively participate and your MAGI is under $100k (phasing out to $0 by $150k); unused losses carry forward. On sale, claimed depreciation is recaptured at up to 25%, and gains may owe capital-gains tax (a 1031 exchange can defer both). Figures are a year-1 estimate at your 24.0% rate — not tax advice; consult a CPA.
Condition & rehab AI · 14 photos
This 2025 Clayton manufactured home is in excellent condition with no visible repairs or maintenance needed. It is move-in ready and offers a bright, open concept layout with modern finishes. The home is located in a peaceful community with affordable space rent, making it a great opportunity for low-maintenance living in the beautiful Apple Hill area.
Value-add opportunities
- Resale Painting the exterior siding and roof (if applicable) — A fresh coat of paint can enhance the home's curb appeal and make it more attractive to potential buyers.
- Rental Landscaping the front yard — A well-maintained front yard can attract more renters and make the home more appealing.
Renovation cost estimate screening
Value-add ROI direction
- Resale Painting the exterior siding and roof (if applicable) — A fresh coat of paint can enhance the home's curb appeal and make it more attractive to potential buyers. ↑
- Rental Landscaping the front yard — A well-maintained front yard can attract more renters and make the home more appealing. ↑
ⓘ Cost ranges are severity-bucket heuristics (US national rule-of-thumb). Get contractor quotes + a written scope before underwriting a rehab budget.
Schools (NCES district)
- District
- El Dorado Union High
- NCES district ID
- 0612070
- Math proficiency
- 44% ▼ -11.00%
- Reading proficiency
- 69% ▬ 0.00%
- Median HH income
- $78,936
- Composite
- 50.84/100
- National rank
- #1798
- State rank
- #89 of 517 in CA
Livability — Pollock Pines
- Score
- 55/100
- State rank
- #864
- US rank
- #23561
Category grades
Schools grade is shown separately in the Schools card above.
Census & demographics
- Census place
- Pollock Pines, CA
- Population (ZIP)
- 5,844
Population outlook (El Dorado County) Hauer SSP2
- Today (2025)
- 191,666 people
- By 2030
- 193,662 · +1.0%
- By 2040
- 192,583 · +0.5%
- By 2050
- 185,904 · -3.0%
- By 2075
- 169,543 · -11.5%
- By 2100
- 139,623 · -27.2%
Race, ethnicity, and origin ACS 2023
- Neighborhood character
- Predominantly White (84%)
- Race & ethnicity
- White 84% Hispanic / Latino 10% Two or more races 9% Asian 2% Pacific Islander 1%
- Hispanic origin (detail)
- Mexican 8%
- Common ancestry
- Italian 5% Lithuanian 4% Portuguese 3%
- Foreign-born
- 8% · Canada, Vietnam
- Languages at home
- 90% English-only · Spanish 8% Other Asian/Pacific 1%
Political lean MEDSL · El Dorado
- 2024 margin
- R (+12.0) · D 42.6% · R 54.6% · Other 2.8%
- 2008→2024 swing
- -1.5pp toward R · 2008: -10.5pp · 2024: -12.0pp
- All cycles
- 2024: R+12.0 2020: R+8.8 2016: R+13.9 2012: R+18.2 2008: R+10.5
Not yet ingested
- Civics
- —
Market trends
- HPI YoY
- ▼ -107.84%
- Current HPI
- 267.8967
- Rent YoY
- —
- Metro
- —
- State GDP YoY
- ▲ 3.21%
- F500 in state
- 116
Industry mix (Fortune 500 HQ in CA)
| Industry | F500 HQs | Revenue |
|---|---|---|
| Technology | 27 | $1,492B |
|
||
| Financial Services | 3 | $174B |
|
||
| Retail | 3 | $44B |
|
||
| Insurance | 3 | $26B |
|
||
| Media / Entertainment | 2 | $115B |
|
||
| Pharmaceuticals / Biotech | 2 | $62B |
|
||
Cash-flow waterfall
monthlySold comps — $/sqft
last 12 mo · ≤1 miLoading sold comps…