 🏷️ Likely Rental
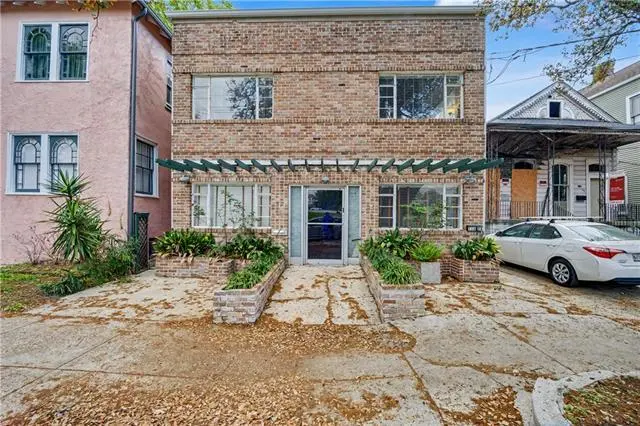
116 S Norman C Francis Pkwy · New Orleans, LA
Flood risk No data
- FEMA flood zone
- —
- Chance of flooding over 30 yrs
- —
- Est. flood insurance / yr
- —
Fire risk No data
- Est. fire insurance / yr
- —
Heat risk No data
- Hot days now (above threshold)
- —
- Hot days in 30 yrs
- —
Wind risk No data
- Chance of severe wind over 30 yrs
- —
Air-quality risk No data
- Unhealthy air days now
- —
- Unhealthy air days in 30 yrs
- —
Risk factors via First Street. Map © Google.
Why this score? — see what drove the C+ grade
The composite is a weighted blend of 9 inputs, each scored 0–100. Each bar is that input's sub-score; the figure is the points it added to the 100-point composite (weight × sub-score).
- Cash flow +22.0/30.0
- ARV discount +15.0/15.0
- DSCR +7.1/10.0
- 1% rule +5.5/10.0
- Livability +4.0/5.0
- Condition / age +3.8/5.0
- Rent growth +2.5/5.0
- Schools +1.6/10.0
- Appreciation +0.0/10.0
$449,000
🖨 Deal sheet 📄 Offer letter ✓ Due diligence
Multi-family units
County records classify this as Multi-Family (2-4 Unit). Listing-text estimate: 2 units. confirmed
Listing remarks MLS
Exceptional mixed-use opportunity in the heart of New Orleans! This expansive 4300 sq. ft. property features two fully renovated units (2017), offering the perfect combination of modern living and strong income potential. The owner's unit showcases a beautifully updated 4-bedroom, 2.5-bath layout with high end finishes and thoughtful design throughout. The second unit spans approximately 1600 sq. ft. and offers 3 bedrooms and 2 bathrooms, providing consistent income-producing capability. Historically generating $4200/month ($50,400 annually), this property delivers an estimated ~7.9% cap rate at the current list price, making it an exceptional opportunity for both investors and owner-occupants. Zoned for both residential and commercial use, the flexibilty allows for a wide range of possibilities, including live/work, long term rental, or business use. Rare chance to own a high performing, fully renovated asset in one of New Orleans' most desirable areas.
Key facts
- Built 1970
- Listed 12 days
Neighborhood map
What this means for you Summary
Snapshot
- This is a 1×4bd/2.2ba + 1×3bd/2ba units multifamily listed at $449k. Condition is rated good.
Deal economics
- At list price, monthly cash flow is $719 ($9k/yr) — positive. Per door: $359/mo.
- The deal already cash-flows at list — no discount required.
- Meets the 1% rule at list price ($5k rent vs $449k).
- Cap rate 8.2% vs local median 4.4% in New Orleans — top-decile yield for the area; either an underpriced asset or a hidden risk that comps aren't pricing in. Stress-test before assuming the spread holds.
Location & tenants
- Location reads 81/100 on livability (#3 in LA, #1,383 nationally) — a professional / high-income tenant draw. Strengths: amenities A+, commute A+, health & safety A+; Watch: crime C-, employment D.
- Orleans Parish (urban): math 11% / reading 27% proficiency, ranked #69 of 98 in LA (top 70%) — low school quality limits family demand, transient renter base, plan for 1-2y turnover; 68% free/reduced lunch — lower-income household profile, screen leases tightly.
- Market conditions: Rents soft (-0.2%/yr); 381 active listings in the ZIP; 2 comparable units currently listed for rent nearby; 710 units permitted in Orleans Parish in 2024 (244 in 5+ unit buildings).
- At $4,707/mo this rent would consume 106% of the median local household income ($53k/yr) (locally 3381% of renters already pay >50% of income on rent) — very limited rent-growth headroom before tenants either downsize or default.
Forward outlook
- Local home prices are declining (-3.0%/yr); year-one equity from $3k of loan paydown is wiped out by about $13k of value loss. Plan a longer hold.
- Orleans County population projected at +61% by 2050 — long-run rental-demand tailwind backs the buy-and-hold thesis.
Negotiation context
- Only 12 days on market — expect competitive offers; lowballing is unlikely to land.
- 12 sale attempts since 3y ago with the ask held roughly flat each time — persistent listings suggest the price (not the market) is what's stuck; bring a comps-based counter.
Questions for the listing agent
- Can we see the unit-by-unit rent roll, current vacancy, and any below-market leases? What's the average tenancy length?
- What capital expenditures (roof, boiler, parking lot, exteriors) have been made in the last 5 years, and what's planned in the next 2?
- Built in 1970 — when were the roof, HVAC, electrical panel, plumbing, and water heater last replaced?
- Is there a deadline driving the sale (1031 exchange, divorce, estate, relocation)? That informs how much negotiation room exists.
- What's the average days-on-market for RENTAL listings here right now (not sales)? A rising rental-DOM trend means longer vacancies and softer asking-rent achievability than the comps imply.
- What's the recent tenant-quality profile in this submarket — average credit score on applications, eviction rate, late-payment / NSF rate, and stable-employment percentage? A property-management company in the area should have these aggregated.
- How much new apartment / multifamily construction is in the pipeline within 1–3 miles? Heavy new supply (>2% of stock underway) typically softens rents 12–24 months out; light construction supports rent growth.
Investment metrics
- 1% rule
- 1.05% ✓
- Cap rate
- 8.21%
- Cash-on-cash
- 6.86%
- DSCR
- 1.31
- GRM
- 7.9
CMA / ARV
- ARV (on-the-fly)
- $627,770
- Comps found
- 5
Show comp detail 5 sales within ~0.75 mi
| Address | Dist | Beds/Ba | Sqft | Sold | Price | $/sf | Match |
|---|---|---|---|---|---|---|---|
| 116 S Norman C Francis Pkwy | 0.00mi | 7/4.5 (+1) | 4,390 (0%) | 0mo | $449,000 | $102 | 87 |
| 301 03 S Pierce St | 0.48mi | 6/5.0 | 4,484 (+2%) | 13mo | $845,000 | $188 | 54 |
| 3100 02 Palmyra St | 0.20mi | 6/5.0 | 4,009 (-9%) | 16mo | $575,000 | $143 | 53 |
| 633-35 N Carrollton Ave | 0.68mi | 7/4.5 (+1) | 3,943 (-10%) | 14mo | $720,000 | $183 | 27 |
| 124 N Solomon St | 0.65mi | 5/5.0 (-1) | 3,796 (-14%) | 12mo | $494,000 | $130 | 22 |
Match score weights: distance 35% · size 25% · config 20% · recency 20%. Top-matched comps best support the ARV.
Projected returns pro-forma
-3.0% appreciation · 0.0% rent growth · sell at horizon
- IRR
- -9.1%
- Equity multiple
- 0.68×
- Total profit
- $-40,762
- Equity at exit
- $66,947
- IRR
- -4.1%
- Equity multiple
- 0.76×
- Total profit
- $-29,821
- Equity at exit
- $38,821
Cash invested: $125,720 (down + closing). Projections, not guarantees.
Landlord ↔ Tenant lean methodology
- Overall (STATE)
- 90 Strongly Landlord-Friendly
- State Louisiana
- 90 Strongly Landlord-Friendly · R+12
- County
- — inherits STATE
- City
- — inherits STATE
ZIP-level market 70119
- Home prices YoY
- -34.8%
- Rents YoY
- -0.2%
- Active inventory
- 381
- Price-to-rent
- 14.7×
Monthly cashflow live
- Estimated rent
- $4,707 high interval (Pro) →
- Mortgage (P&I)
- −$2,355
- Tax from tax record
- −$458 /mo · $5,496/yr
- Insurance
- −$187
- HOA
- −$0
- Vacancy / Maint / Mgmt
- −$988
- Net cashflow
- $719
Break-even live
2-unit breakdown (identical units grouped — click to expand)
| Units | Beds | Baths | Est. rent |
|---|---|---|---|
| 1× unit | 4 | 2.2 | $2,537 |
| 1× unit | 3 | 2 | $2,171 |
| Total (2 units) | $4,707 | ||
UW: 25.0% down · 7.5% · 30yr · 1.5% tax · 5.0% vac · 8.0% maint · 8.0% mgmt
Financing live
Cash to close
- Down payment
- $112,250
- Closing costs
- $13,470
- Reserves months
- —
- Total cash needed
- —
Loan-product check · same deal, 3 products live
Conventional
25% down · 7.5% · 30yr
- Down + closing
- —
- Monthly P&I
- —
- Monthly cashflow
- —
- DSCR
- —
- Eligible?
- —
Personal DTI + credit; lowest rate.
DSCR
20% down · 8.5% · 30yr
- Down + closing
- —
- Monthly P&I
- —
- Monthly cashflow
- —
- DSCR
- —
- Eligible?
- —
No personal income docs; deal must DSCR.
Hard money
10% down · 12.0% · 12mo
- Down + closing
- —
- Monthly P&I
- —
- Monthly cashflow
- —
- DSCR
- —
- Eligible?
- —
Short-term bridge; refi at stabilization.
Rent comps 2 comps
| Address | Beds | Baths | Sqft | Rent | $/sqft | DOM | Units | Dist |
|---|---|---|---|---|---|---|---|---|
| 1608 Governor Nicholls St Unit D New Orleans, LA | 5.0 | 3.5 | 5245 | $4,000 | $0.76 | 43d | 1 | 1.49mi |
| 1608 Governor Nicholls St Unit D New Orleans, LA | 5.0 | 3.5 | 5245 | $4,000 | $0.76 | 23d | 1 | 1.49mi |
Listing history 31 events
-
2026-04-14status Pending 968-char remark
Show marketing remark (968 chars)
Exceptional mixed-use opportunity in the heart of New Orleans! This expansive 4300 sq. ft. property features two fully renovated units (2017), offering the perfect combination of modern living and strong income potential. The owner's unit showcases a beautifully updated 4-bedroom, 2.5-bath layout with high end finishes and thoughtful design throughout. The second unit spans approximately 1600 sq. ft. and offers 3 bedrooms and 2 bathrooms, providing consistent income-producing capability. Historically generating $4200/month ($50,400 annually), this property delivers an estimated ~7.9% cap rate at the current list price, making it an exceptional opportunity for both investors and owner-occupants. Zoned for both residential and commercial use, the flexibilty allows for a wide range of possibilities, including live/work, long term rental, or business use. Rare chance to own a high performing, fully renovated asset in one of New Orleans' most desirable areas.
-
2026-04-14status Pending
Show marketing remark (968 chars)
Exceptional mixed-use opportunity in the heart of New Orleans! This expansive 4300 sq. ft. property features two fully renovated units (2017), offering the perfect combination of modern living and strong income potential. The owner's unit showcases a beautifully updated 4-bedroom, 2.5-bath layout with high end finishes and thoughtful design throughout. The second unit spans approximately 1600 sq. ft. and offers 3 bedrooms and 2 bathrooms, providing consistent income-producing capability. Historically generating $4200/month ($50,400 annually), this property delivers an estimated ~7.9% cap rate at the current list price, making it an exceptional opportunity for both investors and owner-occupants. Zoned for both residential and commercial use, the flexibilty allows for a wide range of possibilities, including live/work, long term rental, or business use. Rare chance to own a high performing, fully renovated asset in one of New Orleans' most desirable areas.
-
2026-03-28$449,000 Active 968-char remark
Show marketing remark (968 chars)
Exceptional mixed-use opportunity in the heart of New Orleans! This expansive 4300 sq. ft. property features two fully renovated units (2017), offering the perfect combination of modern living and strong income potential. The owner's unit showcases a beautifully updated 4-bedroom, 2.5-bath layout with high end finishes and thoughtful design throughout. The second unit spans approximately 1600 sq. ft. and offers 3 bedrooms and 2 bathrooms, providing consistent income-producing capability. Historically generating $4200/month ($50,400 annually), this property delivers an estimated ~7.9% cap rate at the current list price, making it an exceptional opportunity for both investors and owner-occupants. Zoned for both residential and commercial use, the flexibilty allows for a wide range of possibilities, including live/work, long term rental, or business use. Rare chance to own a high performing, fully renovated asset in one of New Orleans' most desirable areas.
-
2026-03-28$449,000 Active
Show marketing remark (968 chars)
Exceptional mixed-use opportunity in the heart of New Orleans! This expansive 4300 sq. ft. property features two fully renovated units (2017), offering the perfect combination of modern living and strong income potential. The owner's unit showcases a beautifully updated 4-bedroom, 2.5-bath layout with high end finishes and thoughtful design throughout. The second unit spans approximately 1600 sq. ft. and offers 3 bedrooms and 2 bathrooms, providing consistent income-producing capability. Historically generating $4200/month ($50,400 annually), this property delivers an estimated ~7.9% cap rate at the current list price, making it an exceptional opportunity for both investors and owner-occupants. Zoned for both residential and commercial use, the flexibilty allows for a wide range of possibilities, including live/work, long term rental, or business use. Rare chance to own a high performing, fully renovated asset in one of New Orleans' most desirable areas.
-
2026-01-10historical $1,995
-
2025-12-09price $1,995
-
2025-11-21price $2,025
-
2025-10-16$545,000 Active
-
2025-10-09$2,095
-
2025-09-04historical $2,200
-
2025-07-11price $2,200
-
2025-06-27price $2,250
-
2025-06-23price $545,000
-
2025-06-23price $545,000
-
2025-06-23price $545,000
-
2025-06-23price $545,000
-
2025-06-21price $2,349
-
2025-06-06price $2,450
-
2025-05-20$2,550
-
2025-03-25$599,900 Active
-
2025-03-25$599,900 Active
-
2024-06-07$639,000
-
2024-06-06$639,000
-
2024-05-13price $695,000
-
2024-05-13price $695,000
-
2024-04-16price $745,000
-
2024-04-16price $745,000
-
2024-01-11$695,000
-
2024-01-11$695,000
-
2023-10-13price $844,000
-
2023-07-13$844,000
ⓘ Source: listings_history table (triggers on properties + properties_extension) + one-shot
backfill from property_details.listing_events for pre-trigger history.
Tax reassessment forecast LA · Resets to sale price
- Current annual tax
- $5,496 · $458/mo
- Projected year-2 tax
- $5,496 · $458/mo
- Expected delta
- $0/yr ($0/mo · 0.0%)
ⓘ Screening estimate from a state-policy table — verify with the county assessor before closing.
Nearby sold comps map
Loading sold comps map…
Walkable amenities ~0.75 mi
Loading nearby amenities…
Taxation est. · year 1
- Rental income
- $56,484
- − Mortgage interest
- −$25,151
- − Property taxes
- −$5,496
- − Insurance
- −$2,245
- − Repairs & maintenance
- −$4,519
- − Management
- −$4,519
- − Depreciation
- −$13,062
- Taxable income
- $1,493
- Est. tax owed @ 24.0%
- −$358
- After-tax cash flow
- $8,268/yr
For passive investors: Depreciation is non-cash, so a rental often shows a tax loss while cash-flowing — sheltering income. Rental losses are passive: they offset passive income freely, and up to $25,000/yr can offset ordinary (W-2) income if you actively participate and your MAGI is under $100k (phasing out to $0 by $150k); unused losses carry forward. On sale, claimed depreciation is recaptured at up to 25%, and gains may owe capital-gains tax (a 1031 exchange can defer both). Figures are a year-1 estimate at your 24.0% rate — not tax advice; consult a CPA.
Condition & rehab AI · 13 photos
This multi-family property is in good condition with well-maintained interiors and exteriors. Painting and updating the flooring can further enhance its appeal and value.
Value-add opportunities
- Both Painting the exterior and interior walls — Fresh paint can enhance the curb appeal and interior aesthetics, potentially increasing both resale and rental value.
- Both Updating the flooring in the living areas — Replacing worn-out flooring with a more modern and durable option can improve the overall look and feel of the home, benefiting both resale and rental.
Renovation cost estimate screening
Value-add ROI direction
- Both Painting the exterior and interior walls — Fresh paint can enhance the curb appeal and interior aesthetics, potentially increasing both resale and rental value. ↑
- Both Updating the flooring in the living areas — Replacing worn-out flooring with a more modern and durable option can improve the overall look and feel of the home, benefiting both resale and rental. ↑
ⓘ Cost ranges are severity-bucket heuristics (US national rule-of-thumb). Get contractor quotes + a written scope before underwriting a rehab budget.
Schools (NCES district)
- District
- Orleans Parish
- NCES district ID
- 2201170
- Math proficiency
- 11% ▼ -52.00%
- Reading proficiency
- 27% ▼ -46.00%
- Median HH income
- $37,011
- Composite
- 15.78/100
- National rank
- #9271
- State rank
- #69 of 98 in LA
Livability — New Orleans
- Score
- 81/100
- State rank
- #3
- US rank
- #1383
Category grades
Schools grade is shown separately in the Schools card above.
Census & demographics
- Census place
- New Orleans, LA
- County
- Orleans Parish · 338,817 people
- City population
- 338,817
- Metro
- New Orleans-Metairie, LA
- Population (ZIP)
- 37,253
- Household income
- $53,143
- Rent vs Own
- Severe rent burden
- 3381.0
Population outlook (Orleans County) Hauer SSP2
- Today (2025)
- 513,025 people
- By 2030
- 575,781 · +12.2%
- By 2040
- 700,174 · +36.5%
- By 2050
- 826,541 · +61.1%
- By 2075
- 1,123,374 · +119.0%
- By 2100
- 1,355,609 · +164.2%
Race, ethnicity, and origin ACS 2023
- Neighborhood character
- Diverse neighborhood (Simpson 0.64)
- Race & ethnicity
- Black 44% White 40% Two or more races 10% Hispanic / Latino 9% Asian 1%
- Hispanic origin (detail)
- Mexican 2%
- Common ancestry
- Lithuanian 8% Slovak 2% Romanian 1%
- Foreign-born
- 6% · Canada, Jamaica
- Languages at home
- 91% English-only · Spanish 6% French/Haitian/Cajun 1% Other Indo-European 0%
Political lean MEDSL · Orleans
- 2024 margin
- Solid D (+67.0) · D 82.2% · R 15.2% · Other 2.7%
- 2008→2024 swing
- +6.7pp toward D · 2008: 60.3pp · 2024: 67.0pp
- All cycles
- 2024: D+67.0 2020: D+68.2 2016: D+66.2 2012: D+62.5 2008: D+60.3
Not yet ingested
- Civics
- —
Market trends
- HPI YoY
- ▼ -135.38%
- Current HPI
- 253.1929
- Rent YoY
- ▼ -0.20%
- Metro
- New Orleans-Metairie, LA
- State GDP YoY
- ▲ 3.29%
- F500 in state
- 10
Industry mix (Fortune 500 HQ in LA)
| Industry | F500 HQs | Revenue |
|---|---|---|
| Telecommunications | 2 | $23B |
|
||
| Utilities | 1 | $12B |
|
||
| Wholesale / Distribution | 1 | $5B |
|
||
| Advertising | 1 | $2B |
|
||
Price history
-46.8% since first listed31 events — show timeline
- 2026-04-14 Pending — AcadianaMLS
- 2026-04-14 Pending — GSREIN
- 2026-03-28 Listed $449,000 GSREIN
- 2026-03-28 Listed $449,000 AcadianaMLS
- 2026-01-10 Rental Removed $1,995 GSREIN
- 2025-12-09 Price Changed $1,995 GSREIN
- 2025-11-21 Price Changed $2,025 GSREIN
- 2025-10-16 Listed $545,000 AcadianaMLS
- 2025-10-09 Listed for Rent $2,095 GSREIN
- 2025-09-04 Rental Removed $2,200 GSREIN
- 2025-07-11 Price Changed $2,200 GSREIN
- 2025-06-27 Price Changed $2,250 GSREIN
- 2025-06-23 Price Changed $545,000 AcadianaMLS
- 2025-06-23 Price Changed $545,000 AcadianaMLS
- 2025-06-23 Price Changed $545,000 GSREIN
- 2025-06-23 Price Changed $545,000 GSREIN
- 2025-06-21 Price Changed $2,349 GSREIN
- 2025-06-06 Price Changed $2,450 GSREIN
- 2025-05-20 Listed for Rent $2,550 GSREIN
- 2025-03-25 Listed $599,900 AcadianaMLS
- 2025-03-25 Listed $599,900 AcadianaMLS
- 2024-06-07 Listed $639,000 AcadianaMLS
- 2024-06-06 Listed $639,000 AcadianaMLS
- 2024-05-13 Price Changed $695,000 GSREIN
- 2024-05-13 Price Changed $695,000 GSREIN
- 2024-04-16 Price Changed $745,000 GSREIN
- 2024-04-16 Price Changed $745,000 GSREIN
- 2024-01-11 Listed $695,000 AcadianaMLS
- 2024-01-11 Listed $695,000 AcadianaMLS
- 2023-10-13 Price Changed $844,000 GSREIN
- 2023-07-13 Listed $844,000 AcadianaMLS
Property tax history
-21.1%/yrLatest (2026): $5,496 · -21.1% YoY. Source: county tax records.
Cash-flow waterfall
monthlySold comps — $/sqft
last 12 mo · ≤1 miLoading sold comps…